
Reports
Reports
Global High Content Screening Products Market: Snapshot
Keen players in the global high content screening products market are pouring money into research and development of new technologically advanced instruments that would help the cause of designing new therapies for different ailments. In this manner they are trying to bolster their positions in the market. They are also resorting to mergers and acquisitions to expand their geographical outreach. Since the degree of competition in the global high content screening products market is relatively low at present, many aspiring players are planning to foray into it.
Increasing thrust on cell-based research, various initiatives to develop new drugs, and emergence of more sophisticated image analysis instruments are some of the factors that are serving to drive the global high-content screening (HCS) market. The increasing instances of chronic diseases requiring prolonged treatment such as HIV AIDS, epilepsy and Parkinson’s disease along with the growing requirement of determination and study of toxicity levels in the initial phases of drug discovery is also bolstering the market.
Research organizations, pharmaceutical and biotechnology companies, and academic and research institutes are the end-use segments in the global high content screening products market.
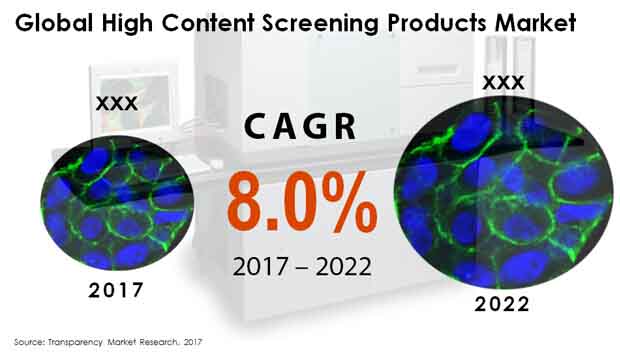
As per Transparency Market Research, the global high content screening products market will likely rise at a CAGR of 8.0% from 2017 to 2022 to become worth US$1.23 bn by 2022.
Cost Effectiveness of High Screening Instruments Generates Demand in Market
Depending upon the type of products, the global high content screening products market can be segmented into consumables, microplates, instruments, software, and service. The consumables, among them, hold maximum market share at present. By expanding at a CAGR of 8.3% in the forecast period, the segment will become worth US$486.6 mn in 2022. The high screening instruments too account for a substantial share in the market because of their cost efficiency that results from deployment of LED light engines that brings down the intensity fluctuations and hence negates the need to switch to external illuminating sources.
High content screening software will likely grow at a healthy clip in the foreseeable future in the global high content screening market because of features such as confocal imaging and intuitive workflow interface. This helps to bring about development of three dimensional models allowing better evaluation, increased sensitivity precise image capture, and analyzation of more parameters which is predicted to generate more demand in the market in the upcoming years.
Prevalence of Chronic Diseases Drives North America Market to Fore
From a geographical standpoint, North America leads the global high content screening market on the back of increasing prevalence of chronic diseases, a considerable population of elderly, rising collaborations of research institutes, carefully-considered mergers and acquisitions between companies, and an advanced healthcare infrastructure. The market in the region is predicted to clock a healthy 8.2% CAGR between 2017 and 2022. Rising at this pace it is expected to attain a value of US$402.1 mn in 2022.
Europe follows North America vis-à-vis revenue generation in the global high content screening products market. It currently accounts for 25.8% revenue share in the global high content screening products market. This is mainly because of the substantial investments in healthcare and government regulations in the region. Vis-à-vis growth rate, Asia Pacific is projected to outpace all other regions. By the end of 2022, Japan high content screening products market is projected to reach US$113.1 mn, by registering a CAGR of 7.8% over the forecast period.
Global High Content Screening Market: Competitive Analysis
Some of the prominent participants in the global high content screening products market are Thermo Fisher Scientific, Molecular Devices, GE Healthcare, PerkinElmer Inc., Becton, Dickinson and Company, Thorlabs, Inc., Merck KGaA, Cell Signaling Technology, Genedata AG, and Yokogawa Electric Corporation.
Research in Therapeutics for SARS-CoV-2 Expands Revenue Potential in High Content Screening Products Market
High-Content Screening (HCS) products are advanced imaging technology for high-throughput screening (HTS) used in analyzing and extracting quantitative multi-parametric data in cellular studies. The HCS products market has progressed steadily on the rising application of the technologies for drug discovery. The recent SARS-CoV-2 that caused Covid-19 has expanded the potential of HCS. The pandemic since it hit the world in 2019 December has caused havoc for the healthcare systems on one hand and the macroeconomic fundamentals of countries across the world on the other hand. Currently there has been no established drug that can be used for treating this life-threatening severe pneumonia. In one of the studied in Thailand, HCS products show promise in the pursuit of finding anti-SARS-CoV-2 agents from Thai medicinal plants. More such studies leveraging the potential of HCS products have helped test these in finding novel ingredients for other similar infectious conditions world over.
The various advantages HCS products exhibit have enabled HCS to become a part of high-throughput screening (HTS) used in drug making industries. Growing number of applications of high content screening in in vitro toxicology. HCS products find use in range of toxicity studies such as developmental toxicity and genotoxicity. The advent of induced pluripotent stem cells (iPSCs) and growing research in them using CRISPR/Cas9 have expanded the opportunity for players in the HCS products market. Growing clinical significance of automated microscope-based screening in drug making has further fueled the demand. In oncology, HCS products are being harnessed for protein-localization changes in cancer cells. Growing array of RNAi reagents that can be used in HCS studies has also boosted the market potential of recently launched HCS products. Evolving area of functional genomics has boosted the application area in the HCS products market. Furthermore, the growing use of in vitro cellular models in animal studies has expanded the avenue in the HCS products market.
1. Global High Content Screening Products Market - Executive Summary
2. Global High Content Screening Products Market Overview
2.1. Introduction
2.1.1. Global High Content Screening Products Market Taxonomy
2.1.2. Global High Content Screening Products Market Definition
2.2. Global High Content Screening Products Market Size (US$ Mn) and Forecast, 2012-2022
2.2.1. Global High Content Screening Products Market Y-o-Y Growth
2.3. Global High Content Screening Products Market Dynamics
2.4. Supply Chain
2.5. Cost Structure
2.6. Pricing Analysis
2.7. Raw Material Sourcing Strategy and Analysis
2.8. Supplier List
2.9. Key Participants Market Presence (Intensity Map) By Region
3. Global High Content Screening Products Market Analysis and Forecast By Product Type
3.1. Global High Content Screening Products Market Size and Forecast By Product Type, 2012-2022
3.1.1. Flow Cytometers High Content Screening Products Market Size and Forecast, 2012-2022
3.1.1.1. Revenue (US$ Mn) Comparison, By Region
3.1.1.2. Market Share Comparison, By Region
3.1.1.3. Y-o-Y growth Comparison, By Region
3.1.2. HCS Instruments High Content Screening Products Market Size and Forecast, 2012-2022
3.1.2.1. Revenue (US$ Mn) Comparison, By Region
3.1.2.2. Market Share Comparison, By Region
3.1.2.3. Y-o-Y growth Comparison, By Region
3.1.3. Consumables High Content Screening Products Market Size and Forecast, 2012-2022
3.1.3.1. Revenue (US$ Mn) Comparison, By Region
3.1.3.2. Market Share Comparison, By Region
3.1.3.3. Y-o-Y growth Comparison, By Region
4. Global High Content Screening Products Market Analysis and Forecast By Industry
4.1. Global High Content Screening Products Market Size and Forecast By Industry, 2012-2022
4.1.1. BioHigh Content Screening Products Market Size and Forecast, 2012-2022
4.1.1.1. Revenue (US$ Mn) Comparison, By Region
4.1.1.2. Market Share Comparison, By Region
4.1.1.3. Y-o-Y growth Comparison, By Region
4.1.2. Educational Institutions High Content Screening Products Market Size and Forecast, 2012-2022
4.1.2.1. Revenue (US$ Mn) Comparison, By Region
4.1.2.2. Market Share Comparison, By Region
4.1.2.3. Y-o-Y growth Comparison, By Region
4.1.3. Government Organizations High Content Screening Products Market Size and Forecast, 2012-2022
4.1.3.1. Revenue (US$ Mn) Comparison, By Region
4.1.3.2. Market Share Comparison, By Region
4.1.3.3. Y-o-Y growth Comparison, By Region
4.1.4. Independent Contract Research Organizations High Content Screening Products Market Size and Forecast, 2012-2022
4.1.4.1. Revenue (US$ Mn) Comparison, By Region
4.1.4.2. Market Share Comparison, By Region
4.1.4.3. Y-o-Y growth Comparison, By Region
4.1.5. Pharmaceutical and Healthcare High Content Screening Products Market Size and Forecast, 2012-2022
4.1.5.1. Revenue (US$ Mn) Comparison, By Region
4.1.5.2. Market Share Comparison, By Region
4.1.5.3. Y-o-Y growth Comparison, By Region
4.1.6. Other Industries High Content Screening Products Market Size and Forecast, 2012-2022
4.1.6.1. Revenue (US$ Mn) Comparison, By Region
4.1.6.2. Market Share Comparison, By Region
4.1.6.3. Y-o-Y growth Comparison, By Region
5. Global High Content Screening Products Market Analysis and Forecast By Application
5.1. Global High Content Screening Products Market Size and Forecast By Application, 2012-2022
5.1.1. Compound Profiling High Content Screening Products Market Size and Forecast, 2012-2022
5.1.1.1. Revenue (US$ Mn) Comparison, By Region
5.1.1.2. Market Share Comparison, By Region
5.1.1.3. Y-o-Y growth Comparison, By Region
5.1.2. Primary & Secondary Screening High Content Screening Products Market Size and Forecast, 2012-2022
5.1.2.1. Revenue (US$ Mn) Comparison, By Region
5.1.2.2. Market Share Comparison, By Region
5.1.2.3. Y-o-Y growth Comparison, By Region
5.1.3. Target Identification and Validation High Content Screening Products Market Size and Forecast, 2012-2022
5.1.3.1. Revenue (US$ Mn) Comparison, By Region
5.1.3.2. Market Share Comparison, By Region
5.1.3.3. Y-o-Y growth Comparison, By Region
5.1.4. Toxicity Studies High Content Screening Products Market Size and Forecast, 2012-2022
5.1.4.1. Revenue (US$ Mn) Comparison, By Region
5.1.4.2. Market Share Comparison, By Region
5.1.4.3. Y-o-Y growth Comparison, By Region
5.1.5. Others High Content Screening Products Market Size and Forecast, 2012-2022
5.1.5.1. Revenue (US$ Mn) Comparison, By Region
5.1.5.2. Market Share Comparison, By Region
5.1.5.3. Y-o-Y growth Comparison, By Region
6. Global High Content Screening Products Market Analysis and Forecast By Region
6.1. Global High Content Screening Products Market Size and Forecast, 2012-2022
6.1.1. North America High Content Screening Products Market Size and Forecast, 2012-2022
6.1.1.1. Revenue (US$ Mn) Comparison, By Product Type
6.1.1.2. Revenue (US$ Mn) Comparison, By Industry
6.1.1.3. Revenue (US$ Mn) Comparison, By Application
6.1.2. Latin America High Content Screening Products Market Size and Forecast, 2012-2022
6.1.2.1. Revenue (US$ Mn) Comparison, By Product Type
6.1.2.2. Revenue (US$ Mn) Comparison, By Industry
6.1.2.3. Revenue (US$ Mn) Comparison, By Application
6.1.3. Europe High Content Screening Products Market Size and Forecast, 2012-2022
6.1.3.1. Revenue (US$ Mn) Comparison, By Product Type
6.1.3.2. Revenue (US$ Mn) Comparison, By Industry
6.1.3.3. Revenue (US$ Mn) Comparison, By Application
6.1.4. Japan High Content Screening Products Market Size and Forecast, 2012-2022
6.1.4.1. Revenue (US$ Mn) Comparison, By Product Type
6.1.4.2. Revenue (US$ Mn) Comparison, By Industry
6.1.4.3. Revenue (US$ Mn) Comparison, By Application
6.1.5. APEJ High Content Screening Products Market Size and Forecast, 2012-2022
6.1.5.1. Revenue (US$ Mn) Comparison, By Product Type
6.1.5.2. Revenue (US$ Mn) Comparison, By Industry
6.1.5.3. Revenue (US$ Mn) Comparison, By Application
6.1.6. MEA High Content Screening Products Market Size and Forecast, 2012-2022
6.1.6.1. Revenue (US$ Mn) Comparison, By Product Type
6.1.6.2. Revenue (US$ Mn) Comparison, By Industry
6.1.6.3. Revenue (US$ Mn) Comparison, By Application
7. North America High Content Screening Products Market Analysis and Forecast, By Country, 2012-2022
7.1. US High Content Screening Products Market Size and Forecast, 2012-2022
7.1.1. Revenue (US$ Mn) Comparison, By Product Type
7.1.2. Revenue (US$ Mn) Comparison, By Industry
7.1.3. Revenue (US$ Mn) Comparison, By Application
7.2. Canada High Content Screening Products Market Size and Forecast, 2012-2022
7.2.1. Revenue (US$ Mn) Comparison, By Product Type
7.2.2. Revenue (US$ Mn) Comparison, By Industry
7.2.3. Revenue (US$ Mn) Comparison, By Application
8. Latin America High Content Screening Products Market Analysis and Forecast, By Country, 2012-2022
8.1. Brazil High Content Screening Products Market Size and Forecast, 2012-2022
8.1.1. Revenue (US$ Mn) Comparison, By Product Type
8.1.2. Revenue (US$ Mn) Comparison, By Industry
8.1.3. Revenue (US$ Mn) Comparison, By Application
8.2. Mexico High Content Screening Products Market Size and Forecast, 2012-2022
8.2.1. Revenue (US$ Mn) Comparison, By Product Type
8.2.2. Revenue (US$ Mn) Comparison, By Industry
8.2.3. Revenue (US$ Mn) Comparison, By Application
8.3. Argentina High Content Screening Products Market Size and Forecast, 2012-2022
8.3.1. Revenue (US$ Mn) Comparison, By Product Type
8.3.2. Revenue (US$ Mn) Comparison, By Industry
8.3.3. Revenue (US$ Mn) Comparison, By Application
9. Europe High Content Screening Products Market Analysis and Forecast, By Country, 2012-2022
9.1. Germany High Content Screening Products Market Size and Forecast, 2012-2022
9.1.1. Revenue (US$ Mn) Comparison, By Product Type
9.1.2. Revenue (US$ Mn) Comparison, By Industry
9.1.3. Revenue (US$ Mn) Comparison, By Application
9.2. UK High Content Screening Products Market Size and Forecast, 2012-2022
9.2.1. Revenue (US$ Mn) Comparison, By Product Type
9.2.2. Revenue (US$ Mn) Comparison, By Industry
9.2.3. Revenue (US$ Mn) Comparison, By Application
9.3. France High Content Screening Products Market Size and Forecast, 2012-2022
9.3.1. Revenue (US$ Mn) Comparison, By Product Type
9.3.2. Revenue (US$ Mn) Comparison, By Industry
9.3.3. Revenue (US$ Mn) Comparison, By Application
9.4. Spain High Content Screening Products Market Size and Forecast, 2012-2022
9.4.1. Revenue (US$ Mn) Comparison, By Product Type
9.4.2. Revenue (US$ Mn) Comparison, By Industry
9.4.3. Revenue (US$ Mn) Comparison, By Application
9.5. Italy High Content Screening Products Market Size and Forecast, 2012-2022
9.5.1. Revenue (US$ Mn) Comparison, By Product Type
9.5.2. Revenue (US$ Mn) Comparison, By Industry
9.5.3. Revenue (US$ Mn) Comparison, By Application
9.6. Nordic High Content Screening Products Market Size and Forecast, 2012-2022
9.6.1. Revenue (US$ Mn) Comparison, By Product Type
9.6.2. Revenue (US$ Mn) Comparison, By Industry
9.6.3. Revenue (US$ Mn) Comparison, By Application
10. Japan High Content Screening Products Market Analysis and Forecast, By Country, 2012-2022
10.1. Japan High Content Screening Products Market Size and Forecast, 2012-2022
10.1.1. Revenue (US$ Mn) Comparison, By Product Type
10.1.2. Revenue (US$ Mn) Comparison, By Industry
10.1.3. Revenue (US$ Mn) Comparison, By Application
11. APEJ High Content Screening Products Market Analysis and Forecast, By Country, 2012-2022
11.1. China High Content Screening Products Market Size and Forecast, 2012-2022
11.1.1. Revenue (US$ Mn) Comparison, By Product Type
11.1.2. Revenue (US$ Mn) Comparison, By Industry
11.1.3. Revenue (US$ Mn) Comparison, By Application
11.2. India High Content Screening Products Market Size and Forecast, 2012-2022
11.2.1. Revenue (US$ Mn) Comparison, By Product Type
11.2.2. Revenue (US$ Mn) Comparison, By Industry
11.2.3. Revenue (US$ Mn) Comparison, By Application
11.3. Malaysia High Content Screening Products Market Size and Forecast, 2012-2022
11.3.1. Revenue (US$ Mn) Comparison, By Product Type
11.3.2. Revenue (US$ Mn) Comparison, By Industry
11.3.3. Revenue (US$ Mn) Comparison, By Application
11.4. Thailand High Content Screening Products Market Size and Forecast, 2012-2022
11.4.1. Revenue (US$ Mn) Comparison, By Product Type
11.4.2. Revenue (US$ Mn) Comparison, By Industry
11.4.3. Revenue (US$ Mn) Comparison, By Application
11.5. Singapore High Content Screening Products Market Size and Forecast, 2012-2022
11.5.1. Revenue (US$ Mn) Comparison, By Product Type
11.5.2. Revenue (US$ Mn) Comparison, By Industry
11.5.3. Revenue (US$ Mn) Comparison, By Application
11.6. Australia High Content Screening Products Market Size and Forecast, 2012-2022
11.6.1. Revenue (US$ Mn) Comparison, By Product Type
11.6.2. Revenue (US$ Mn) Comparison, By Industry
11.6.3. Revenue (US$ Mn) Comparison, By Application
12. MEA High Content Screening Products Market Analysis and Forecast, By Country, 2012-2022
12.1. GCC Countries High Content Screening Products Market Size and Forecast, 2012-2022
12.1.1. Revenue (US$ Mn) Comparison, By Product Type
12.1.2. Revenue (US$ Mn) Comparison, By Industry
12.1.3. Revenue (US$ Mn) Comparison, By Application
12.2. South Africa High Content Screening Products Market Size and Forecast, 2012-2022
12.2.1. Revenue (US$ Mn) Comparison, By Product Type
12.2.2. Revenue (US$ Mn) Comparison, By Industry
12.2.3. Revenue (US$ Mn) Comparison, By Application
12.3. Nigeria High Content Screening Products Market Size and Forecast, 2012-2022
12.3.1. Revenue (US$ Mn) Comparison, By Product Type
12.3.2. Revenue (US$ Mn) Comparison, By Industry
12.3.3. Revenue (US$ Mn) Comparison, By Application
12.4. Israel High Content Screening Products Market Size and Forecast, 2012-2022
12.4.1. Revenue (US$ Mn) Comparison, By Product Type
12.4.2. Revenue (US$ Mn) Comparison, By Industry
12.4.3. Revenue (US$ Mn) Comparison, By Application
13. Global High Content Screening Products Market Company Share, Competition Landscape and Company Profiles
13.1. Company Share Analysis
13.2. Competition Landscape
13.3. Company Profiles
13.3.1. Becton, Dickinson and Company
13.3.2. Thermo Fisher Scientific Inc.
13.3.3. GE Healthcare
13.3.4. Olympus Corporation
13.3.5. PerkinElmer Inc.
13.3.6. Merck Millipore Corporation
13.3.7. Danaher Corporation
13.3.8. Yokogawa Electric Corporation
13.3.9. Sysmex Corporation
13.3.10. Thorlabs, Inc.
13.3.11. Valeo S.A.
13.3.12. Montaplast GmbH
14. Research Methodology
15. Secondary and Primary Sources
16. Assumptions and Acronyms
17. Disclaimer
List of Table
TABLE 1 Global High Content Screening Products Market Value (US$ Mn), 2012-2016
TABLE 2 Global High Content Screening Products Market Value (US$ Mn), 2017-2022
TABLE 3 Global High Content Screening Products Market Value (US$ Mn) and Y-o-Y, 2015-2022
TABLE 4 Global Flow Cytometers Segment Value (US$ Mn), By Region 2012-2016
TABLE 5 Global Flow Cytometers Segment Value (US$ Mn), By Region 2017-2022
TABLE 6 Global Flow Cytometers Segment Market Share, By Region 2012-2016
TABLE 7 Global Flow Cytometers Segment Market Share, By Region 2017-2022
TABLE 8 Global Flow Cytometers Segment Y-o-Y, By Region 2015-2022
TABLE 9 Global HCS Instruments Segment Value (US$ Mn), By Region 2012-2016
TABLE 10 Global HCS Instruments Segment Value (US$ Mn), By Region 2017-2022
TABLE 11 Global HCS Instruments Segment Market Share, By Region 2012-2016
TABLE 12 Global HCS Instruments Segment Market Share, By Region 2017-2022
TABLE 13 Global HCS Instruments Segment Y-o-Y, By Region 2015-2022
TABLE 14 Global Consumables Segment Value (US$ Mn), By Region 2012-2016
TABLE 15 Global Consumables Segment Value (US$ Mn), By Region 2017-2022
TABLE 16 Global Consumables Segment Market Share, By Region 2012-2016
TABLE 17 Global Consumables Segment Market Share, By Region 2017-2022
TABLE 18 Global Consumables Segment Y-o-Y, By Region 2015-2022
TABLE 19 Global Biotechnology Segment Value (US$ Mn), By Region 2012-2016
TABLE 20 Global Biotechnology Segment Value (US$ Mn), By Region 2017-2022
TABLE 21 Global Biotechnology Segment Market Share, By Region 2012-2016
TABLE 22 Global Biotechnology Segment Market Share, By Region 2017-2022
TABLE 23 Global Biotechnology Segment Y-o-Y, By Region 2015-2022
TABLE 24 Global Educational Institutions Segment Value (US$ Mn), By Region 2012-2016
TABLE 25 Global Educational Institutions Segment Value (US$ Mn), By Region 2017-2022
TABLE 26 Global Educational Institutions Segment Market Share, By Region 2012-2016
TABLE 27 Global Educational Institutions Segment Market Share, By Region 2017-2022
TABLE 28 Global Educational Institutions Segment Y-o-Y, By Region 2015-2022
TABLE 29 Global Government Organizations Segment Value (US$ Mn), By Region 2012-2016
TABLE 30 Global Government Organizations Segment Value (US$ Mn), By Region 2017-2022
TABLE 31 Global Government Organizations Segment Market Share, By Region 2012-2016
TABLE 32 Global Government Organizations Segment Market Share, By Region 2017-2022
TABLE 33 Global Government Organizations Segment Y-o-Y, By Region 2015-2022
TABLE 34 Global Independent Contract Research Organizations Segment Value (US$ Mn), By Region 2012-2016
TABLE 35 Global Independent Contract Research Organizations Segment Value (US$ Mn), By Region 2017-2022
TABLE 36 Global Independent Contract Research Organizations Segment Market Share, By Region 2012-2016
TABLE 37 Global Independent Contract Research Organizations Segment Market Share, By Region 2017-2022
TABLE 38 Global Independent Contract Research Organizations Segment Y-o-Y, By Region 2015-2022
TABLE 39 Global Pharmaceutical and Healthcare Segment Value (US$ Mn), By Region 2012-2016
TABLE 40 Global Pharmaceutical and Healthcare Segment Value (US$ Mn), By Region 2017-2022
TABLE 41 Global Pharmaceutical and Healthcare Segment Market Share, By Region 2012-2016
TABLE 42 Global Pharmaceutical and Healthcare Segment Market Share, By Region 2017-2022
TABLE 43 Global Pharmaceutical and Healthcare Segment Y-o-Y, By Region 2015-2022
TABLE 44 Global Other Industries Segment Value (US$ Mn), By Region 2012-2016
TABLE 45 Global Other Industries Segment Value (US$ Mn), By Region 2017-2022
TABLE 46 Global Other Industries Segment Market Share, By Region 2012-2016
TABLE 47 Global Other Industries Segment Market Share, By Region 2017-2022
TABLE 48 Global Other Industries Segment Y-o-Y, By Region 2015-2022
TABLE 49 Global Compound Profiling Segment Value (US$ Mn), By Region 2012-2016
TABLE 50 Global Compound Profiling Segment Value (US$ Mn), By Region 2017-2022
TABLE 51 Global Compound Profiling Segment Market Share, By Region 2012-2016
TABLE 52 Global Compound Profiling Segment Market Share, By Region 2017-2022
TABLE 53 Global Compound Profiling Segment Y-o-Y, By Region 2015-2022
TABLE 54 Global Primary & Secondary Screening Segment Value (US$ Mn), By Region 2012-2016
TABLE 55 Global Primary & Secondary Screening Segment Value (US$ Mn), By Region 2017-2022
TABLE 56 Global Primary & Secondary Screening Segment Market Share, By Region 2012-2016
TABLE 57 Global Primary & Secondary Screening Segment Market Share, By Region 2017-2022
TABLE 58 Global Primary & Secondary Screening Segment Y-o-Y, By Region 2015-2022
TABLE 59 Global Target Identification and Validation Segment Value (US$ Mn), By Region 2012-2016
TABLE 60 Global Target Identification and Validation Segment Value (US$ Mn), By Region 2017-2022
TABLE 61 Global Target Identification and Validation Segment Market Share, By Region 2012-2016
TABLE 62 Global Target Identification and Validation Segment Market Share, By Region 2017-2022
TABLE 63 Global Target Identification and Validation Segment Y-o-Y, By Region 2015-2022
TABLE 64 Global Toxicity Studies Segment Value (US$ Mn), By Region 2012-2016
TABLE 65 Global Toxicity Studies Segment Value (US$ Mn), By Region 2017-2022
TABLE 66 Global Toxicity Studies Segment Market Share, By Region 2012-2016
TABLE 67 Global Toxicity Studies Segment Market Share, By Region 2017-2022
TABLE 68 Global Toxicity Studies Segment Y-o-Y, By Region 2015-2022
TABLE 69 Global Others Segment Value (US$ Mn), By Region 2012-2016
TABLE 70 Global Others Segment Value (US$ Mn), By Region 2017-2022
TABLE 71 Global Others Segment Market Share, By Region 2012-2016
TABLE 72 Global Others Segment Market Share, By Region 2017-2022
TABLE 73 Global Others Segment Y-o-Y, By Region 2015-2022
TABLE 74 North America High Content Screening Products Market Value (US$ Mn), By Product Type 2012-2016
TABLE 75 North America High Content Screening Products Market Value (US$ Mn), By Product Type 2017-2022
TABLE 76 North America High Content Screening Products Market Value (US$ Mn), By Industry 2012-2016
TABLE 77 North America High Content Screening Products Market Value (US$ Mn), By Industry 2017-2022
TABLE 78 North America High Content Screening Products Market Value (US$ Mn), By Application 2012-2016
TABLE 79 North America High Content Screening Products Market Value (US$ Mn), By Application 2017-2022
TABLE 80 Latin America High Content Screening Products Market Value (US$ Mn), By Product Type 2012-2016
TABLE 81 Latin America High Content Screening Products Market Value (US$ Mn), By Product Type 2017-2022
TABLE 82 Latin America High Content Screening Products Market Value (US$ Mn), By Industry 2012-2016
TABLE 83 Latin America High Content Screening Products Market Value (US$ Mn), By Industry 2017-2022
TABLE 84 Latin America High Content Screening Products Market Value (US$ Mn), By Application 2012-2016
TABLE 85 Latin America High Content Screening Products Market Value (US$ Mn), By Application 2017-2022
TABLE 86 Europe High Content Screening Products Market Value (US$ Mn), By Product Type 2012-2016
TABLE 87 Europe High Content Screening Products Market Value (US$ Mn), By Product Type 2017-2022
TABLE 88 Europe High Content Screening Products Market Value (US$ Mn), By Industry 2012-2016
TABLE 89 Europe High Content Screening Products Market Value (US$ Mn), By Industry 2017-2022
TABLE 90 Europe High Content Screening Products Market Value (US$ Mn), By Application 2012-2016
TABLE 91 Europe High Content Screening Products Market Value (US$ Mn), By Application 2017-2022
TABLE 92 Japan High Content Screening Products Market Value (US$ Mn), By Product Type 2012-2016
TABLE 93 Japan High Content Screening Products Market Value (US$ Mn), By Product Type 2017-2022
TABLE 94 Japan High Content Screening Products Market Value (US$ Mn), By Industry 2012-2016
TABLE 95 Japan High Content Screening Products Market Value (US$ Mn), By Industry 2017-2022
TABLE 96 Japan High Content Screening Products Market Value (US$ Mn), By Application 2012-2016
TABLE 97 Japan High Content Screening Products Market Value (US$ Mn), By Application 2017-2022
TABLE 98 APEJ High Content Screening Products Market Value (US$ Mn), By Product Type 2012-2016
TABLE 99 APEJ High Content Screening Products Market Value (US$ Mn), By Product Type 2017-2022
TABLE 100 APEJ High Content Screening Products Market Value (US$ Mn), By Industry 2012-2016
TABLE 101 APEJ High Content Screening Products Market Value (US$ Mn), By Industry 2017-2022
TABLE 102 APEJ High Content Screening Products Market Value (US$ Mn), By Application 2012-2016
TABLE 103 APEJ High Content Screening Products Market Value (US$ Mn), By Application 2017-2022
TABLE 104 MEA High Content Screening Products Market Value (US$ Mn), By Product Type 2012-2016
TABLE 105 MEA High Content Screening Products Market Value (US$ Mn), By Product Type 2017-2022
TABLE 106 MEA High Content Screening Products Market Value (US$ Mn), By Industry 2012-2016
TABLE 107 MEA High Content Screening Products Market Value (US$ Mn), By Industry 2017-2022
TABLE 108 MEA High Content Screening Products Market Value (US$ Mn), By Application 2012-2016
TABLE 109 MEA High Content Screening Products Market Value (US$ Mn), By Application 2017-2022
TABLE 110 US High Content Screening Products Market Value (US$ Mn), By Product Type 2012-2016
TABLE 111 US High Content Screening Products Market Value (US$ Mn), By Product Type 2017-2022
TABLE 112 US High Content Screening Products Market Value (US$ Mn), By Industry 2012-2016
TABLE 113 US High Content Screening Products Market Value (US$ Mn), By Industry 2017-2022
TABLE 114 US High Content Screening Products Market Value (US$ Mn), By Application 2012-2016
TABLE 115 US High Content Screening Products Market Value (US$ Mn), By Application 2017-2022
TABLE 116 Canada High Content Screening Products Market Value (US$ Mn), By Product Type 2012-2016
TABLE 117 Canada High Content Screening Products Market Value (US$ Mn), By Product Type 2017-2022
TABLE 118 Canada High Content Screening Products Market Value (US$ Mn), By Industry 2012-2016
TABLE 119 Canada High Content Screening Products Market Value (US$ Mn), By Industry 2017-2022
TABLE 120 Canada High Content Screening Products Market Value (US$ Mn), By Application 2012-2016
TABLE 121 Canada High Content Screening Products Market Value (US$ Mn), By Application 2017-2022
TABLE 122 Brazil High Content Screening Products Market Value (US$ Mn), By Product Type 2012-2016
TABLE 123 Brazil High Content Screening Products Market Value (US$ Mn), By Product Type 2017-2022
TABLE 124 Brazil High Content Screening Products Market Value (US$ Mn), By Industry 2012-2016
TABLE 125 Brazil High Content Screening Products Market Value (US$ Mn), By Industry 2017-2022
TABLE 126 Brazil High Content Screening Products Market Value (US$ Mn), By Application 2012-2016
TABLE 127 Brazil High Content Screening Products Market Value (US$ Mn), By Application 2017-2022
TABLE 128 Mexico High Content Screening Products Market Value (US$ Mn), By Product Type 2012-2016
TABLE 129 Mexico High Content Screening Products Market Value (US$ Mn), By Product Type 2017-2022
TABLE 130 Mexico High Content Screening Products Market Value (US$ Mn), By Industry 2012-2016
TABLE 131 Mexico High Content Screening Products Market Value (US$ Mn), By Industry 2017-2022
TABLE 132 Mexico High Content Screening Products Market Value (US$ Mn), By Application 2012-2016
TABLE 133 Mexico High Content Screening Products Market Value (US$ Mn), By Application 2017-2022
TABLE 134 Argentina High Content Screening Products Market Value (US$ Mn), By Product Type 2012-2016
TABLE 135 Argentina High Content Screening Products Market Value (US$ Mn), By Product Type 2017-2022
TABLE 136 Argentina High Content Screening Products Market Value (US$ Mn), By Industry 2012-2016
TABLE 137 Argentina High Content Screening Products Market Value (US$ Mn), By Industry 2017-2022
TABLE 138 Argentina High Content Screening Products Market Value (US$ Mn), By Application 2012-2016
TABLE 139 Argentina High Content Screening Products Market Value (US$ Mn), By Application 2017-2022
TABLE 140 Germany High Content Screening Products Market Value (US$ Mn), By Product Type 2012-2016
TABLE 141 Germany High Content Screening Products Market Value (US$ Mn), By Product Type 2017-2022
TABLE 142 Germany High Content Screening Products Market Value (US$ Mn), By Industry 2012-2016
TABLE 143 Germany High Content Screening Products Market Value (US$ Mn), By Industry 2017-2022
TABLE 144 Germany High Content Screening Products Market Value (US$ Mn), By Application 2012-2016
TABLE 145 Germany High Content Screening Products Market Value (US$ Mn), By Application 2017-2022
TABLE 146 UK High Content Screening Products Market Value (US$ Mn), By Product Type 2012-2016
TABLE 147 UK High Content Screening Products Market Value (US$ Mn), By Product Type 2017-2022
TABLE 148 UK High Content Screening Products Market Value (US$ Mn), By Industry 2012-2016
TABLE 149 UK High Content Screening Products Market Value (US$ Mn), By Industry 2017-2022
TABLE 150 UK High Content Screening Products Market Value (US$ Mn), By Application 2012-2016
TABLE 151 UK High Content Screening Products Market Value (US$ Mn), By Application 2017-2022
TABLE 152 France High Content Screening Products Market Value (US$ Mn), By Product Type 2012-2016
TABLE 153 France High Content Screening Products Market Value (US$ Mn), By Product Type 2017-2022
TABLE 154 France High Content Screening Products Market Value (US$ Mn), By Industry 2012-2016
TABLE 155 France High Content Screening Products Market Value (US$ Mn), By Industry 2017-2022
TABLE 156 France High Content Screening Products Market Value (US$ Mn), By Application 2012-2016
TABLE 157 France High Content Screening Products Market Value (US$ Mn), By Application 2017-2022
TABLE 158 Spain High Content Screening Products Market Value (US$ Mn), By Product Type 2012-2016
TABLE 159 Spain High Content Screening Products Market Value (US$ Mn), By Product Type 2017-2022
TABLE 160 Spain High Content Screening Products Market Value (US$ Mn), By Industry 2012-2016
TABLE 161 Spain High Content Screening Products Market Value (US$ Mn), By Industry 2017-2022
TABLE 162 Spain High Content Screening Products Market Value (US$ Mn), By Application 2012-2016
TABLE 163 Spain High Content Screening Products Market Value (US$ Mn), By Application 2017-2022
TABLE 164 Italy High Content Screening Products Market Value (US$ Mn), By Product Type 2012-2016
TABLE 165 Italy High Content Screening Products Market Value (US$ Mn), By Product Type 2017-2022
TABLE 166 Italy High Content Screening Products Market Value (US$ Mn), By Industry 2012-2016
TABLE 167 Italy High Content Screening Products Market Value (US$ Mn), By Industry 2017-2022
TABLE 168 Italy High Content Screening Products Market Value (US$ Mn), By Application 2012-2016
TABLE 169 Italy High Content Screening Products Market Value (US$ Mn), By Application 2017-2022
TABLE 170 Nordic High Content Screening Products Market Value (US$ Mn), By Product Type 2012-2016
TABLE 171 Nordic High Content Screening Products Market Value (US$ Mn), By Product Type 2017-2022
TABLE 172 Nordic High Content Screening Products Market Value (US$ Mn), By Industry 2012-2016
TABLE 173 Nordic High Content Screening Products Market Value (US$ Mn), By Industry 2017-2022
TABLE 174 Nordic High Content Screening Products Market Value (US$ Mn), By Application 2012-2016
TABLE 175 Nordic High Content Screening Products Market Value (US$ Mn), By Application 2017-2022
TABLE 176 Japan High Content Screening Products Market Value (US$ Mn), By Product Type 2012-2016
TABLE 177 Japan High Content Screening Products Market Value (US$ Mn), By Product Type 2017-2022
TABLE 178 Japan High Content Screening Products Market Value (US$ Mn), By Industry 2012-2016
TABLE 179 Japan High Content Screening Products Market Value (US$ Mn), By Industry 2017-2022
TABLE 180 Japan High Content Screening Products Market Value (US$ Mn), By Application 2012-2016
TABLE 181 Japan High Content Screening Products Market Value (US$ Mn), By Application 2017-2022
TABLE 182 China High Content Screening Products Market Value (US$ Mn), By Product Type 2012-2016
TABLE 183 China High Content Screening Products Market Value (US$ Mn), By Product Type 2017-2022
TABLE 184 China High Content Screening Products Market Value (US$ Mn), By Industry 2012-2016
TABLE 185 China High Content Screening Products Market Value (US$ Mn), By Industry 2017-2022
TABLE 186 China High Content Screening Products Market Value (US$ Mn), By Application 2012-2016
TABLE 187 China High Content Screening Products Market Value (US$ Mn), By Application 2017-2022
TABLE 188 India High Content Screening Products Market Value (US$ Mn), By Product Type 2012-2016
TABLE 189 India High Content Screening Products Market Value (US$ Mn), By Product Type 2017-2022
TABLE 190 India High Content Screening Products Market Value (US$ Mn), By Industry 2012-2016
TABLE 191 India High Content Screening Products Market Value (US$ Mn), By Industry 2017-2022
TABLE 192 India High Content Screening Products Market Value (US$ Mn), By Application 2012-2016
TABLE 193 India High Content Screening Products Market Value (US$ Mn), By Application 2017-2022
TABLE 194 Malaysia High Content Screening Products Market Value (US$ Mn), By Product Type 2012-2016
TABLE 195 Malaysia High Content Screening Products Market Value (US$ Mn), By Product Type 2017-2022
TABLE 196 Malaysia High Content Screening Products Market Value (US$ Mn), By Industry 2012-2016
TABLE 197 Malaysia High Content Screening Products Market Value (US$ Mn), By Industry 2017-2022
TABLE 198 Malaysia High Content Screening Products Market Value (US$ Mn), By Application 2012-2016
TABLE 199 Malaysia High Content Screening Products Market Value (US$ Mn), By Application 2017-2022
TABLE 200 Thailand High Content Screening Products Market Value (US$ Mn), By Product Type 2012-2016
TABLE 201 Thailand High Content Screening Products Market Value (US$ Mn), By Product Type 2017-2022
TABLE 202 Thailand High Content Screening Products Market Value (US$ Mn), By Industry 2012-2016
TABLE 203 Thailand High Content Screening Products Market Value (US$ Mn), By Industry 2017-2022
TABLE 204 Thailand High Content Screening Products Market Value (US$ Mn), By Application 2012-2016
TABLE 205 Thailand High Content Screening Products Market Value (US$ Mn), By Application 2017-2022
TABLE 206 Singapore High Content Screening Products Market Value (US$ Mn), By Product Type 2012-2016
TABLE 207 Singapore High Content Screening Products Market Value (US$ Mn), By Product Type 2017-2022
TABLE 208 Singapore High Content Screening Products Market Value (US$ Mn), By Industry 2012-2016
TABLE 209 Singapore High Content Screening Products Market Value (US$ Mn), By Industry 2017-2022
TABLE 210 Singapore High Content Screening Products Market Value (US$ Mn), By Application 2012-2016
TABLE 211 Singapore High Content Screening Products Market Value (US$ Mn), By Application 2017-2022
TABLE 212 Australia High Content Screening Products Market Value (US$ Mn), By Product Type 2012-2016
TABLE 213 Australia High Content Screening Products Market Value (US$ Mn), By Product Type 2017-2022
TABLE 214 Australia High Content Screening Products Market Value (US$ Mn), By Industry 2012-2016
TABLE 215 Australia High Content Screening Products Market Value (US$ Mn), By Industry 2017-2022
TABLE 216 Australia High Content Screening Products Market Value (US$ Mn), By Application 2012-2016
TABLE 217 Australia High Content Screening Products Market Value (US$ Mn), By Application 2017-2022
TABLE 218 GCC Countries High Content Screening Products Market Value (US$ Mn), By Product Type 2012-2016
TABLE 219 GCC Countries High Content Screening Products Market Value (US$ Mn), By Product Type 2017-2022
TABLE 220 GCC Countries High Content Screening Products Market Value (US$ Mn), By Industry 2012-2016
TABLE 221 GCC Countries High Content Screening Products Market Value (US$ Mn), By Industry 2017-2022
TABLE 222 GCC Countries High Content Screening Products Market Value (US$ Mn), By Application 2012-2016
TABLE 223 GCC Countries High Content Screening Products Market Value (US$ Mn), By Application 2017-2022
TABLE 224 South Africa High Content Screening Products Market Value (US$ Mn), By Product Type 2012-2016
TABLE 225 South Africa High Content Screening Products Market Value (US$ Mn), By Product Type 2017-2022
TABLE 226 South Africa High Content Screening Products Market Value (US$ Mn), By Industry 2012-2016
TABLE 227 South Africa High Content Screening Products Market Value (US$ Mn), By Industry 2017-2022
TABLE 228 South Africa High Content Screening Products Market Value (US$ Mn), By Application 2012-2016
TABLE 229 South Africa High Content Screening Products Market Value (US$ Mn), By Application 2017-2022
TABLE 230 Nigeria High Content Screening Products Market Value (US$ Mn), By Product Type 2012-2016
TABLE 231 Nigeria High Content Screening Products Market Value (US$ Mn), By Product Type 2017-2022
TABLE 232 Nigeria High Content Screening Products Market Value (US$ Mn), By Industry 2012-2016
TABLE 233 Nigeria High Content Screening Products Market Value (US$ Mn), By Industry 2017-2022
TABLE 234 Nigeria High Content Screening Products Market Value (US$ Mn), By Application 2012-2016
TABLE 235 Nigeria High Content Screening Products Market Value (US$ Mn), By Application 2017-2022
TABLE 236 Israel High Content Screening Products Market Value (US$ Mn), By Product Type 2012-2016
TABLE 237 Israel High Content Screening Products Market Value (US$ Mn), By Product Type 2017-2022
TABLE 238 Israel High Content Screening Products Market Value (US$ Mn), By Industry 2012-2016
TABLE 239 Israel High Content Screening Products Market Value (US$ Mn), By Industry 2017-2022
TABLE 240 Israel High Content Screening Products Market Value (US$ Mn), By Application 2012-2016
TABLE 241 Israel High Content Screening Products Market Value (US$ Mn), By Application 2017-2022
List of Figure
FIG. 1 Global High Content Screening Products Market Value (US$ Mn), 2012-2016
FIG. 2 Global High Content Screening Products Market Value (US$ Mn) Forecast, 2017-2022
FIG. 3 Global High Content Screening Products Market Value (US$ Mn) and Y-o-Y, 2015-2022
FIG. 4 Global Flow Cytometers Segment Market Value (US$ Mn) By Region, 2012-2016
FIG. 5 Global Flow Cytometers Segment Market Value (US$ Mn) By Region, 2017-2022
FIG. 6 Global Flow Cytometers Segment Y-o-Y Growth Rate, By Region, 2015-2022
FIG. 7 Global HCS Instruments Segment Market Value (US$ Mn) By Region, 2012-2016
FIG. 8 Global HCS Instruments Segment Market Value (US$ Mn) By Region, 2017-2022
FIG. 9 Global HCS Instruments Segment Y-o-Y Growth Rate, By Region, 2015-2022
FIG. 10 Global Consumables Segment Market Value (US$ Mn) By Region, 2012-2016
FIG. 11 Global Consumables Segment Market Value (US$ Mn) By Region, 2017-2022
FIG. 12 Global Consumables Segment Y-o-Y Growth Rate, By Region, 2015-2022
FIG. 13 Global Biotechnology Segment Market Value (US$ Mn) By Region, 2012-2016
FIG. 14 Global Biotechnology Segment Market Value (US$ Mn) By Region, 2017-2022
FIG. 15 Global Biotechnology Segment Y-o-Y Growth Rate, By Region, 2015-2022
FIG. 16 Global Educational Institutions Segment Market Value (US$ Mn) By Region, 2012-2016
FIG. 17 Global Educational Institutions Segment Market Value (US$ Mn) By Region, 2017-2022
FIG. 18 Global Educational Institutions Segment Y-o-Y Growth Rate, By Region, 2015-2022
FIG. 19 Global Government Organizations Segment Market Value (US$ Mn) By Region, 2012-2016
FIG. 20 Global Government Organizations Segment Market Value (US$ Mn) By Region, 2017-2022
FIG. 21 Global Government Organizations Segment Y-o-Y Growth Rate, By Region, 2015-2022
FIG. 22 Global Independent Contract Research Organizations Segment Market Value (US$ Mn) By Region, 2012-2016
FIG. 23 Global Independent Contract Research Organizations Segment Market Value (US$ Mn) By Region, 2017-2022
FIG. 24 Global Independent Contract Research Organizations Segment Y-o-Y Growth Rate, By Region, 2015-2022
FIG. 25 Global Pharmaceutical and Healthcare Segment Market Value (US$ Mn) By Region, 2012-2016
FIG. 26 Global Pharmaceutical and Healthcare Segment Market Value (US$ Mn) By Region, 2017-2022
FIG. 27 Global Pharmaceutical and Healthcare Segment Y-o-Y Growth Rate, By Region, 2015-2022
FIG. 28 Global Other Industries Segment Market Value (US$ Mn) By Region, 2012-2016
FIG. 29 Global Other Industries Segment Market Value (US$ Mn) By Region, 2017-2022
FIG. 30 Global Other Industries Segment Y-o-Y Growth Rate, By Region, 2015-2022
FIG. 31 Global Compound Profiling Segment Market Value (US$ Mn) By Region, 2012-2016
FIG. 32 Global Compound Profiling Segment Market Value (US$ Mn) By Region, 2017-2022
FIG. 33 Global Compound Profiling Segment Y-o-Y Growth Rate, By Region, 2015-2022
FIG. 34 Global Primary & Secondary Screening Segment Market Value (US$ Mn) By Region, 2012-2016
FIG. 35 Global Primary & Secondary Screening Segment Market Value (US$ Mn) By Region, 2017-2022
FIG. 36 Global Primary & Secondary Screening Segment Y-o-Y Growth Rate, By Region, 2015-2022
FIG. 37 Global Target Identification and Validation Segment Market Value (US$ Mn) By Region, 2012-2016
FIG. 38 Global Target Identification and Validation Segment Market Value (US$ Mn) By Region, 2017-2022
FIG. 39 Global Target Identification and Validation Segment Y-o-Y Growth Rate, By Region, 2015-2022
FIG. 40 Global Toxicity Studies Segment Market Value (US$ Mn) By Region, 2012-2016
FIG. 41 Global Toxicity Studies Segment Market Value (US$ Mn) By Region, 2017-2022
FIG. 42 Global Toxicity Studies Segment Y-o-Y Growth Rate, By Region, 2015-2022
FIG. 43 Global Others Segment Market Value (US$ Mn) By Region, 2012-2016
FIG. 44 Global Others Segment Market Value (US$ Mn) By Region, 2017-2022
FIG. 45 Global Others Segment Y-o-Y Growth Rate, By Region, 2015-2022
FIG. 46 North America High Content Screening Products Market Value (US$ Mn), By Product Type 2012-2016
FIG. 47 North America High Content Screening Products Market Value (US$ Mn), By Product Type 2017-2022
FIG. 48 North America High Content Screening Products Market Value (US$ Mn), By Industry 2012-2016
FIG. 49 North America High Content Screening Products Market Value (US$ Mn), By Industry 2017-2022
FIG. 50 North America High Content Screening Products Market Value (US$ Mn), By Application 2012-2016
FIG. 51 North America High Content Screening Products Market Value (US$ Mn), By Application 2017-2022
FIG. 52 Latin America High Content Screening Products Market Value (US$ Mn), By Product Type 2012-2016
FIG. 53 Latin America High Content Screening Products Market Value (US$ Mn), By Product Type 2017-2022
FIG. 54 Latin America High Content Screening Products Market Value (US$ Mn), By Industry 2012-2016
FIG. 55 Latin America High Content Screening Products Market Value (US$ Mn), By Industry 2017-2022
FIG. 56 Latin America High Content Screening Products Market Value (US$ Mn), By Application 2012-2016
FIG. 57 Latin America High Content Screening Products Market Value (US$ Mn), By Application 2017-2022
FIG. 58 Europe High Content Screening Products Market Value (US$ Mn), By Product Type 2012-2016
FIG. 59 Europe High Content Screening Products Market Value (US$ Mn), By Product Type 2017-2022
FIG. 60 Europe High Content Screening Products Market Value (US$ Mn), By Industry 2012-2016
FIG. 61 Europe High Content Screening Products Market Value (US$ Mn), By Industry 2017-2022
FIG. 62 Europe High Content Screening Products Market Value (US$ Mn), By Application 2012-2016
FIG. 63 Europe High Content Screening Products Market Value (US$ Mn), By Application 2017-2022
FIG. 64 Japan High Content Screening Products Market Value (US$ Mn), By Product Type 2012-2016
FIG. 65 Japan High Content Screening Products Market Value (US$ Mn), By Product Type 2017-2022
FIG. 66 Japan High Content Screening Products Market Value (US$ Mn), By Industry 2012-2016
FIG. 67 Japan High Content Screening Products Market Value (US$ Mn), By Industry 2017-2022
FIG. 68 Japan High Content Screening Products Market Value (US$ Mn), By Application 2012-2016
FIG. 69 Japan High Content Screening Products Market Value (US$ Mn), By Application 2017-2022
FIG. 70 APEJ High Content Screening Products Market Value (US$ Mn), By Product Type 2012-2016
FIG. 71 APEJ High Content Screening Products Market Value (US$ Mn), By Product Type 2017-2022
FIG. 72 APEJ High Content Screening Products Market Value (US$ Mn), By Industry 2012-2016
FIG. 73 APEJ High Content Screening Products Market Value (US$ Mn), By Industry 2017-2022
FIG. 74 APEJ High Content Screening Products Market Value (US$ Mn), By Application 2012-2016
FIG. 75 APEJ High Content Screening Products Market Value (US$ Mn), By Application 2017-2022
FIG. 76 MEA High Content Screening Products Market Value (US$ Mn), By Product Type 2012-2016
FIG. 77 MEA High Content Screening Products Market Value (US$ Mn), By Product Type 2017-2022
FIG. 78 MEA High Content Screening Products Market Value (US$ Mn), By Industry 2012-2016
FIG. 79 MEA High Content Screening Products Market Value (US$ Mn), By Industry 2017-2022
FIG. 80 MEA High Content Screening Products Market Value (US$ Mn), By Application 2012-2016
FIG. 81 MEA High Content Screening Products Market Value (US$ Mn), By Application 2017-2022
Copyright © Transparency Market Research, Inc. All Rights reserved
Trust Online

High Content Screening Products Market