
Reports
Reports
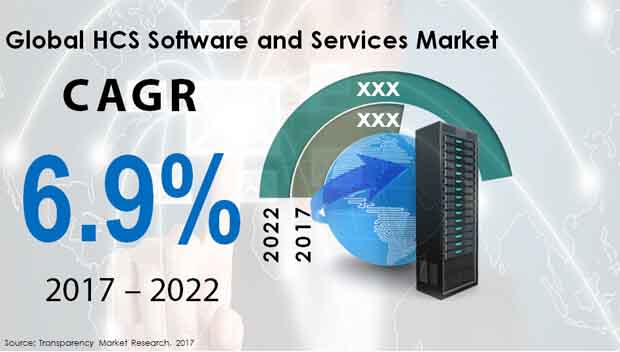
Global HCS Software and Services Market: Snapshot
The global high content screening (HCS) software and services market is foreseen to invite a host of promising opportunities while riding on technological developments in HCS solutions, cost containment in pharma research and development, and cellular research funding. Developed regions such as North America could propel the demand for HCS software and services with high government support, swelling presence of large life sciences companies, and rising research and development expenditure. HCS software and services could find application in lead specificity, the assessment of bioavailability, and qualitative assays to omit compounds with unintended modes of action.
The global HCS software and services market is foretold to expand at a CAGR of 6.9% during the forecast timeframe 2017–2022. By the end of 2022, the market could be valued at a US$1,164.8 mn. In 2017, it held a valuation of US$832.7 mn.
HCS Services as Top Product Amassing Vast Share by 2022
As stated by the authors of the report, the world HCS software and services market is envisaged to be classified according to product, industry, and application. In terms of product, the market could see a classification into two segments, viz. HCS services and HCS software. Amongst these, HCS services are prophesied to secure a larger share of 71.6% in the market by 2022 end. The absolute growth achieved by HCS services could surpass that of any other segment of the market under the same classification.
According to industry, the world HCS software and services market is forecasted to be segmented into bio, educational institutions, government organizations, independent contract research organizations (CROs), and pharmaceutical and healthcare.
By application, toxicity studies, target identification and validation, primary and secondary screening, and compound profiling could be important segments of the world HCS software and services market.
North America’s Dominance that Rests on Loftier Revenue Growth
On the geographical front, the international HCS software and services market is envisioned to be divided into different regions such as North America, the Middle East and Africa (MEA), Latin America, Europe, and Asia Pacific except Japan (APEJ) and Japan. The analysts are of the opinion that North America could possibly lead the market with a revenue of US$426 mn expected to be achieved by the end of the forecast period.
Europe followed by Japan could be another market for HCS software and services with a strong revenue growth anticipated to be garnered by 2022. Europe is projected to reach a valuation of US$301.2 mn by the final forecast year. However, the MEA is envisaged to be on the slower side of growth throughout the course of the forecast period. Between 2017 and 2022, APEJ could create an absolute revenue prospect of US$66.3 mn.
The worldwide HCS software and services market could witness the presence of crucial and prominent industry players such as Thermo Fisher Scientific, Inc., General Electric Company, Becton, Dickinson & Company, PerkinElmer, Inc., Yokogawa Electric Corporation, Olympus Corporation, Merck & Co., Inc., Thorlabs, Inc., Sysmex Corporation, and Danaher Corporation.
HCS Software and Services Market to Gain Momentum Owing to Improving Healthcare Infrastructure
The global HCS software and services market is expected to witness significant growth opportunities form the technological advancement in HCS advancement and cellular funding in research and development, coupled with the rising development of the medical and pharmaceutical industry. Ascend in number of new illnesses and predominance of old ones is making the interest for HCS programming and administrations to find drugs. Along these lines ascend in mindfulness among the buyers is visualized to cause a positive effect available. Be that as it may, significant expense is probably going to cut down the development of the market. Different factors, for example, hardly any quantities of usage of HCS instruments all through the world because of need talented and monetary help is said to discourage the development of the market. Ascend in development of viable filtration conventions are required to hamper the development of the market during the gauge time frame.
The worldwide market for HCS programming and administrations market is driven by the way that in future there will innovative extensions in HCS progression, cell research financing, went with requirement cost in innovative work of drug industry. HCS programming and administrations are foreseen to discover its application in evaluation of bioavailability, subjective tests, and lead explicitness, consequently drawing in more buyers.
The growing interest for cell investigation is foreseen to push the worldwide market for HCS programming and administrations. Enormous extension in revelation of medications and improved poisonousness studies will prosper the development of the market. Ascend in number of new infections and pervasiveness of old ones is making the interest for HCS programming and administrations to find drugs. Accordingly ascend in mindfulness among the buyers is guessed to cause a positive effect available. Nonetheless, significant expense is probably going to cut down the development of the market.
1. Global HCS Software & Services Market - Executive Summary
2. Global HCS Software & Services Market Overview
2.1. Introduction
2.1.1. Global HCS Software & Services Market Taxonomy
2.1.2. Global HCS Software & Services Market Definition
2.2. Global HCS Software & Services Market Size (US$ Mn) and Forecast, 2012-2022
2.2.1. Global HCS Software & Services Market Y-o-Y Growth
2.3. Global HCS Software & Services Market Dynamics
2.4. Supply Chain
2.5. Cost Structure
2.6. Pricing Analysis
2.7. Raw Material Sourcing Strategy and Analysis
2.8. Supplier List
2.9. Key Participants Market Presence (Intensity Map) By Region
3. Global HCS Software & Services Market Analysis and Forecast By Product Type
3.1. Global HCS Software & Services Market Size and Forecast By Product Type, 2012-2022
3.1.1. HCS Services HCS Software & Services Market Size and Forecast, 2012-2022
3.1.1.1. Revenue (US$ Mn) Comparison, By Region
3.1.1.2. Market Share Comparison, By Region
3.1.1.3. Y-o-Y growth Comparison, By Region
3.1.2. HCS Software HCS Software & Services Market Size and Forecast, 2012-2022
3.1.2.1. Revenue (US$ Mn) Comparison, By Region
3.1.2.2. Market Share Comparison, By Region
3.1.2.3. Y-o-Y growth Comparison, By Region
4. Global HCS Software & Services Market Analysis and Forecast By Industry
4.1. Global HCS Software & Services Market Size and Forecast By Industry, 2012-2022
4.1.1. BioHCS Software & Services Market Size and Forecast, 2012-2022
4.1.1.1. Revenue (US$ Mn) Comparison, By Region
4.1.1.2. Market Share Comparison, By Region
4.1.1.3. Y-o-Y growth Comparison, By Region
4.1.2. Educational Institutions HCS Software & Services Market Size and Forecast, 2012-2022
4.1.2.1. Revenue (US$ Mn) Comparison, By Region
4.1.2.2. Market Share Comparison, By Region
4.1.2.3. Y-o-Y growth Comparison, By Region
4.1.3. Government Organizations HCS Software & Services Market Size and Forecast, 2012-2022
4.1.3.1. Revenue (US$ Mn) Comparison, By Region
4.1.3.2. Market Share Comparison, By Region
4.1.3.3. Y-o-Y growth Comparison, By Region
4.1.4. Independent Contract Research Organizations HCS Software & Services Market Size and Forecast, 2012-2022
4.1.4.1. Revenue (US$ Mn) Comparison, By Region
4.1.4.2. Market Share Comparison, By Region
4.1.4.3. Y-o-Y growth Comparison, By Region
4.1.5. Pharmaceutical and Healthcare HCS Software & Services Market Size and Forecast, 2012-2022
4.1.5.1. Revenue (US$ Mn) Comparison, By Region
4.1.5.2. Market Share Comparison, By Region
4.1.5.3. Y-o-Y growth Comparison, By Region
4.1.6. Other Industries HCS Software & Services Market Size and Forecast, 2012-2022
4.1.6.1. Revenue (US$ Mn) Comparison, By Region
4.1.6.2. Market Share Comparison, By Region
4.1.6.3. Y-o-Y growth Comparison, By Region
5. Global HCS Software & Services Market Analysis and Forecast By Application
5.1. Global HCS Software & Services Market Size and Forecast By Application, 2012-2022
5.1.1. Compound Profiling HCS Software & Services Market Size and Forecast, 2012-2022
5.1.1.1. Revenue (US$ Mn) Comparison, By Region
5.1.1.2. Market Share Comparison, By Region
5.1.1.3. Y-o-Y growth Comparison, By Region
5.1.2. Primary & Secondary Screening HCS Software & Services Market Size and Forecast, 2012-2022
5.1.2.1. Revenue (US$ Mn) Comparison, By Region
5.1.2.2. Market Share Comparison, By Region
5.1.2.3. Y-o-Y growth Comparison, By Region
5.1.3. Target Identification and Validation HCS Software & Services Market Size and Forecast, 2012-2022
5.1.3.1. Revenue (US$ Mn) Comparison, By Region
5.1.3.2. Market Share Comparison, By Region
5.1.3.3. Y-o-Y growth Comparison, By Region
5.1.4. Toxicity Studies HCS Software & Services Market Size and Forecast, 2012-2022
5.1.4.1. Revenue (US$ Mn) Comparison, By Region
5.1.4.2. Market Share Comparison, By Region
5.1.4.3. Y-o-Y growth Comparison, By Region
5.1.5. Others HCS Software & Services Market Size and Forecast, 2012-2022
5.1.5.1. Revenue (US$ Mn) Comparison, By Region
5.1.5.2. Market Share Comparison, By Region
5.1.5.3. Y-o-Y growth Comparison, By Region
6. Global HCS Software & Services Market Analysis and Forecast By Region
6.1. Global HCS Software & Services Market Size and Forecast, 2012-2022
6.1.1. North America HCS Software & Services Market Size and Forecast, 2012-2022
6.1.1.1. Revenue (US$ Mn) Comparison, By Product Type
6.1.1.2. Revenue (US$ Mn) Comparison, By Industry
6.1.1.3. Revenue (US$ Mn) Comparison, By Application
6.1.2. Latin America HCS Software & Services Market Size and Forecast, 2012-2022
6.1.2.1. Revenue (US$ Mn) Comparison, By Product Type
6.1.2.2. Revenue (US$ Mn) Comparison, By Industry
6.1.2.3. Revenue (US$ Mn) Comparison, By Application
6.1.3. Europe HCS Software & Services Market Size and Forecast, 2012-2022
6.1.3.1. Revenue (US$ Mn) Comparison, By Product Type
6.1.3.2. Revenue (US$ Mn) Comparison, By Industry
6.1.3.3. Revenue (US$ Mn) Comparison, By Application
6.1.4. Japan HCS Software & Services Market Size and Forecast, 2012-2022
6.1.4.1. Revenue (US$ Mn) Comparison, By Product Type
6.1.4.2. Revenue (US$ Mn) Comparison, By Industry
6.1.4.3. Revenue (US$ Mn) Comparison, By Application
6.1.5. APEJ HCS Software & Services Market Size and Forecast, 2012-2022
6.1.5.1. Revenue (US$ Mn) Comparison, By Product Type
6.1.5.2. Revenue (US$ Mn) Comparison, By Industry
6.1.5.3. Revenue (US$ Mn) Comparison, By Application
6.1.6. MEA HCS Software & Services Market Size and Forecast, 2012-2022
6.1.6.1. Revenue (US$ Mn) Comparison, By Product Type
6.1.6.2. Revenue (US$ Mn) Comparison, By Industry
6.1.6.3. Revenue (US$ Mn) Comparison, By Application
7. North America HCS Software & Services Market Analysis and Forecast, By Country, 2012-2022
7.1. US HCS Software & Services Market Size and Forecast, 2012-2022
7.1.1. Revenue (US$ Mn) Comparison, By Product Type
7.1.2. Revenue (US$ Mn) Comparison, By Industry
7.1.3. Revenue (US$ Mn) Comparison, By Application
7.2. Canada HCS Software & Services Market Size and Forecast, 2012-2022
7.2.1. Revenue (US$ Mn) Comparison, By Product Type
7.2.2. Revenue (US$ Mn) Comparison, By Industry
7.2.3. Revenue (US$ Mn) Comparison, By Application
8. Latin America HCS Software & Services Market Analysis and Forecast, By Country, 2012-2022
8.1. Brazil HCS Software & Services Market Size and Forecast, 2012-2022
8.1.1. Revenue (US$ Mn) Comparison, By Product Type
8.1.2. Revenue (US$ Mn) Comparison, By Industry
8.1.3. Revenue (US$ Mn) Comparison, By Application
8.2. Mexico HCS Software & Services Market Size and Forecast, 2012-2022
8.2.1. Revenue (US$ Mn) Comparison, By Product Type
8.2.2. Revenue (US$ Mn) Comparison, By Industry
8.2.3. Revenue (US$ Mn) Comparison, By Application
8.3. Argentina HCS Software & Services Market Size and Forecast, 2012-2022
8.3.1. Revenue (US$ Mn) Comparison, By Product Type
8.3.2. Revenue (US$ Mn) Comparison, By Industry
8.3.3. Revenue (US$ Mn) Comparison, By Application
9. Europe HCS Software & Services Market Analysis and Forecast, By Country, 2012-2022
9.1. Germany HCS Software & Services Market Size and Forecast, 2012-2022
9.1.1. Revenue (US$ Mn) Comparison, By Product Type
9.1.2. Revenue (US$ Mn) Comparison, By Industry
9.1.3. Revenue (US$ Mn) Comparison, By Application
9.2. UK HCS Software & Services Market Size and Forecast, 2012-2022
9.2.1. Revenue (US$ Mn) Comparison, By Product Type
9.2.2. Revenue (US$ Mn) Comparison, By Industry
9.2.3. Revenue (US$ Mn) Comparison, By Application
9.3. France HCS Software & Services Market Size and Forecast, 2012-2022
9.3.1. Revenue (US$ Mn) Comparison, By Product Type
9.3.2. Revenue (US$ Mn) Comparison, By Industry
9.3.3. Revenue (US$ Mn) Comparison, By Application
9.4. Spain HCS Software & Services Market Size and Forecast, 2012-2022
9.4.1. Revenue (US$ Mn) Comparison, By Product Type
9.4.2. Revenue (US$ Mn) Comparison, By Industry
9.4.3. Revenue (US$ Mn) Comparison, By Application
9.5. Italy HCS Software & Services Market Size and Forecast, 2012-2022
9.5.1. Revenue (US$ Mn) Comparison, By Product Type
9.5.2. Revenue (US$ Mn) Comparison, By Industry
9.5.3. Revenue (US$ Mn) Comparison, By Application
9.6. Nordic HCS Software & Services Market Size and Forecast, 2012-2022
9.6.1. Revenue (US$ Mn) Comparison, By Product Type
9.6.2. Revenue (US$ Mn) Comparison, By Industry
9.6.3. Revenue (US$ Mn) Comparison, By Application
10. Japan HCS Software & Services Market Analysis and Forecast, By Country, 2012-2022
10.1. Japan HCS Software & Services Market Size and Forecast, 2012-2022
10.1.1. Revenue (US$ Mn) Comparison, By Product Type
10.1.2. Revenue (US$ Mn) Comparison, By Industry
10.1.3. Revenue (US$ Mn) Comparison, By Application
11. APEJ HCS Software & Services Market Analysis and Forecast, By Country, 2012-2022
11.1. China HCS Software & Services Market Size and Forecast, 2012-2022
11.1.1. Revenue (US$ Mn) Comparison, By Product Type
11.1.2. Revenue (US$ Mn) Comparison, By Industry
11.1.3. Revenue (US$ Mn) Comparison, By Application
11.2. India HCS Software & Services Market Size and Forecast, 2012-2022
11.2.1. Revenue (US$ Mn) Comparison, By Product Type
11.2.2. Revenue (US$ Mn) Comparison, By Industry
11.2.3. Revenue (US$ Mn) Comparison, By Application
11.3. Malaysia HCS Software & Services Market Size and Forecast, 2012-2022
11.3.1. Revenue (US$ Mn) Comparison, By Product Type
11.3.2. Revenue (US$ Mn) Comparison, By Industry
11.3.3. Revenue (US$ Mn) Comparison, By Application
11.4. Thailand HCS Software & Services Market Size and Forecast, 2012-2022
11.4.1. Revenue (US$ Mn) Comparison, By Product Type
11.4.2. Revenue (US$ Mn) Comparison, By Industry
11.4.3. Revenue (US$ Mn) Comparison, By Application
11.5. Singapore HCS Software & Services Market Size and Forecast, 2012-2022
11.5.1. Revenue (US$ Mn) Comparison, By Product Type
11.5.2. Revenue (US$ Mn) Comparison, By Industry
11.5.3. Revenue (US$ Mn) Comparison, By Application
11.6. Australia HCS Software & Services Market Size and Forecast, 2012-2022
11.6.1. Revenue (US$ Mn) Comparison, By Product Type
11.6.2. Revenue (US$ Mn) Comparison, By Industry
11.6.3. Revenue (US$ Mn) Comparison, By Application
12. MEA HCS Software & Services Market Analysis and Forecast, By Country, 2012-2022
12.1. GCC Countries HCS Software & Services Market Size and Forecast, 2012-2022
12.1.1. Revenue (US$ Mn) Comparison, By Product Type
12.1.2. Revenue (US$ Mn) Comparison, By Industry
12.1.3. Revenue (US$ Mn) Comparison, By Application
12.2. South Africa HCS Software & Services Market Size and Forecast, 2012-2022
12.2.1. Revenue (US$ Mn) Comparison, By Product Type
12.2.2. Revenue (US$ Mn) Comparison, By Industry
12.2.3. Revenue (US$ Mn) Comparison, By Application
12.3. Nigeria HCS Software & Services Market Size and Forecast, 2012-2022
12.3.1. Revenue (US$ Mn) Comparison, By Product Type
12.3.2. Revenue (US$ Mn) Comparison, By Industry
12.3.3. Revenue (US$ Mn) Comparison, By Application
12.4. Israel HCS Software & Services Market Size and Forecast, 2012-2022
12.4.1. Revenue (US$ Mn) Comparison, By Product Type
12.4.2. Revenue (US$ Mn) Comparison, By Industry
12.4.3. Revenue (US$ Mn) Comparison, By Application
13. Global HCS Software & Services Market Company Share, Competition Landscape and Company Profiles
13.1. Company Share Analysis
13.2. Competition Landscape
13.3. Company Profiles
13.3.1. Thermo Fisher Scientific Inc.
13.3.2. General Electric Company
13.3.3. Becton, Dickinson & Company
13.3.4. PerkinElmer Inc.
13.3.5. Olympus Corporation
13.3.6. Merck & Co. Inc
13.3.7. Danaher Corporation
13.3.8. Yokogawa Electric Corporation
13.3.9. Sysmex Corporation
13.3.10. Thorlabs, Inc.
14. Research Methodology
15. Secondary and Primary Sources
16. Assumptions and Acronyms
17. Disclaimer
List of Table
TABLE 1 Global HCS Software & Services Market Value (US$ Mn), 2012-2016
TABLE 2 Global HCS Software & Services Market Value (US$ Mn), 2017-2022
TABLE 3 Global HCS Software & Services Market Value (US$ Mn) and Y-o-Y, 2015-2022
TABLE 4 Global HCS Services Segment Value (US$ Mn), By Region 2012-2016
TABLE 5 Global HCS Services Segment Value (US$ Mn), By Region 2017-2022
TABLE 6 Global HCS Services Segment Market Share, By Region 2012-2016
TABLE 7 Global HCS Services Segment Market Share, By Region 2017-2022
TABLE 8 Global HCS Services Segment Y-o-Y, By Region 2015-2022
TABLE 9 Global HCS Software Segment Value (US$ Mn), By Region 2012-2016
TABLE 10 Global HCS Software Segment Value (US$ Mn), By Region 2017-2022
TABLE 11 Global HCS Software Segment Market Share, By Region 2012-2016
TABLE 12 Global HCS Software Segment Market Share, By Region 2017-2022
TABLE 13 Global HCS Software Segment Y-o-Y, By Region 2015-2022
TABLE 14 Global Biotechnology Segment Value (US$ Mn), By Region 2012-2016
TABLE 15 Global Biotechnology Segment Value (US$ Mn), By Region 2017-2022
TABLE 16 Global Biotechnology Segment Market Share, By Region 2012-2016
TABLE 17 Global Biotechnology Segment Market Share, By Region 2017-2022
TABLE 18 Global Biotechnology Segment Y-o-Y, By Region 2015-2022
TABLE 19 Global Educational Institutions Segment Value (US$ Mn), By Region 2012-2016
TABLE 20 Global Educational Institutions Segment Value (US$ Mn), By Region 2017-2022
TABLE 21 Global Educational Institutions Segment Market Share, By Region 2012-2016
TABLE 22 Global Educational Institutions Segment Market Share, By Region 2017-2022
TABLE 23 Global Educational Institutions Segment Y-o-Y, By Region 2015-2022
TABLE 24 Global Government Organizations Segment Value (US$ Mn), By Region 2012-2016
TABLE 25 Global Government Organizations Segment Value (US$ Mn), By Region 2017-2022
TABLE 26 Global Government Organizations Segment Market Share, By Region 2012-2016
TABLE 27 Global Government Organizations Segment Market Share, By Region 2017-2022
TABLE 28 Global Government Organizations Segment Y-o-Y, By Region 2015-2022
TABLE 29 Global Independent Contract Research Organizations Segment Value (US$ Mn), By Region 2012-2016
TABLE 30 Global Independent Contract Research Organizations Segment Value (US$ Mn), By Region 2017-2022
TABLE 31 Global Independent Contract Research Organizations Segment Market Share, By Region 2012-2016
TABLE 32 Global Independent Contract Research Organizations Segment Market Share, By Region 2017-2022
TABLE 33 Global Independent Contract Research Organizations Segment Y-o-Y, By Region 2015-2022
TABLE 34 Global Pharmaceutical and Healthcare Segment Value (US$ Mn), By Region 2012-2016
TABLE 35 Global Pharmaceutical and Healthcare Segment Value (US$ Mn), By Region 2017-2022
TABLE 36 Global Pharmaceutical and Healthcare Segment Market Share, By Region 2012-2016
TABLE 37 Global Pharmaceutical and Healthcare Segment Market Share, By Region 2017-2022
TABLE 38 Global Pharmaceutical and Healthcare Segment Y-o-Y, By Region 2015-2022
TABLE 39 Global Other Industries Segment Value (US$ Mn), By Region 2012-2016
TABLE 40 Global Other Industries Segment Value (US$ Mn), By Region 2017-2022
TABLE 41 Global Other Industries Segment Market Share, By Region 2012-2016
TABLE 42 Global Other Industries Segment Market Share, By Region 2017-2022
TABLE 43 Global Other Industries Segment Y-o-Y, By Region 2015-2022
TABLE 44 Global Compound Profiling Segment Value (US$ Mn), By Region 2012-2016
TABLE 45 Global Compound Profiling Segment Value (US$ Mn), By Region 2017-2022
TABLE 46 Global Compound Profiling Segment Market Share, By Region 2012-2016
TABLE 47 Global Compound Profiling Segment Market Share, By Region 2017-2022
TABLE 48 Global Compound Profiling Segment Y-o-Y, By Region 2015-2022
TABLE 49 Global Primary & Secondary Screening Segment Value (US$ Mn), By Region 2012-2016
TABLE 50 Global Primary & Secondary Screening Segment Value (US$ Mn), By Region 2017-2022
TABLE 51 Global Primary & Secondary Screening Segment Market Share, By Region 2012-2016
TABLE 52 Global Primary & Secondary Screening Segment Market Share, By Region 2017-2022
TABLE 53 Global Primary & Secondary Screening Segment Y-o-Y, By Region 2015-2022
TABLE 54 Global Target Identification and Validation Segment Value (US$ Mn), By Region 2012-2016
TABLE 55 Global Target Identification and Validation Segment Value (US$ Mn), By Region 2017-2022
TABLE 56 Global Target Identification and Validation Segment Market Share, By Region 2012-2016
TABLE 57 Global Target Identification and Validation Segment Market Share, By Region 2017-2022
TABLE 58 Global Target Identification and Validation Segment Y-o-Y, By Region 2015-2022
TABLE 59 Global Toxicity Studies Segment Value (US$ Mn), By Region 2012-2016
TABLE 60 Global Toxicity Studies Segment Value (US$ Mn), By Region 2017-2022
TABLE 61 Global Toxicity Studies Segment Market Share, By Region 2012-2016
TABLE 62 Global Toxicity Studies Segment Market Share, By Region 2017-2022
TABLE 63 Global Toxicity Studies Segment Y-o-Y, By Region 2015-2022
TABLE 64 Global Others Segment Value (US$ Mn), By Region 2012-2016
TABLE 65 Global Others Segment Value (US$ Mn), By Region 2017-2022
TABLE 66 Global Others Segment Market Share, By Region 2012-2016
TABLE 67 Global Others Segment Market Share, By Region 2017-2022
TABLE 68 Global Others Segment Y-o-Y, By Region 2015-2022
TABLE 69 North America HCS Software & Services Market Value (US$ Mn), By Product Type 2012-2016
TABLE 70 North America HCS Software & Services Market Value (US$ Mn), By Product Type 2017-2022
TABLE 71 North America HCS Software & Services Market Value (US$ Mn), By Industry 2012-2016
TABLE 72 North America HCS Software & Services Market Value (US$ Mn), By Industry 2017-2022
TABLE 73 North America HCS Software & Services Market Value (US$ Mn), By Application 2012-2016
TABLE 74 North America HCS Software & Services Market Value (US$ Mn), By Application 2017-2022
TABLE 75 Latin America HCS Software & Services Market Value (US$ Mn), By Product Type 2012-2016
TABLE 76 Latin America HCS Software & Services Market Value (US$ Mn), By Product Type 2017-2022
TABLE 77 Latin America HCS Software & Services Market Value (US$ Mn), By Industry 2012-2016
TABLE 78 Latin America HCS Software & Services Market Value (US$ Mn), By Industry 2017-2022
TABLE 79 Latin America HCS Software & Services Market Value (US$ Mn), By Application 2012-2016
TABLE 80 Latin America HCS Software & Services Market Value (US$ Mn), By Application 2017-2022
TABLE 81 Europe HCS Software & Services Market Value (US$ Mn), By Product Type 2012-2016
TABLE 82 Europe HCS Software & Services Market Value (US$ Mn), By Product Type 2017-2022
TABLE 83 Europe HCS Software & Services Market Value (US$ Mn), By Industry 2012-2016
TABLE 84 Europe HCS Software & Services Market Value (US$ Mn), By Industry 2017-2022
TABLE 85 Europe HCS Software & Services Market Value (US$ Mn), By Application 2012-2016
TABLE 86 Europe HCS Software & Services Market Value (US$ Mn), By Application 2017-2022
TABLE 87 Japan HCS Software & Services Market Value (US$ Mn), By Product Type 2012-2016
TABLE 88 Japan HCS Software & Services Market Value (US$ Mn), By Product Type 2017-2022
TABLE 89 Japan HCS Software & Services Market Value (US$ Mn), By Industry 2012-2016
TABLE 90 Japan HCS Software & Services Market Value (US$ Mn), By Industry 2017-2022
TABLE 91 Japan HCS Software & Services Market Value (US$ Mn), By Application 2012-2016
TABLE 92 Japan HCS Software & Services Market Value (US$ Mn), By Application 2017-2022
TABLE 93 APEJ HCS Software & Services Market Value (US$ Mn), By Product Type 2012-2016
TABLE 94 APEJ HCS Software & Services Market Value (US$ Mn), By Product Type 2017-2022
TABLE 95 APEJ HCS Software & Services Market Value (US$ Mn), By Industry 2012-2016
TABLE 96 APEJ HCS Software & Services Market Value (US$ Mn), By Industry 2017-2022
TABLE 97 APEJ HCS Software & Services Market Value (US$ Mn), By Application 2012-2016
TABLE 98 APEJ HCS Software & Services Market Value (US$ Mn), By Application 2017-2022
TABLE 99 MEA HCS Software & Services Market Value (US$ Mn), By Product Type 2012-2016
TABLE 100 MEA HCS Software & Services Market Value (US$ Mn), By Product Type 2017-2022
TABLE 101 MEA HCS Software & Services Market Value (US$ Mn), By Industry 2012-2016
TABLE 102 MEA HCS Software & Services Market Value (US$ Mn), By Industry 2017-2022
TABLE 103 MEA HCS Software & Services Market Value (US$ Mn), By Application 2012-2016
TABLE 104 MEA HCS Software & Services Market Value (US$ Mn), By Application 2017-2022
TABLE 105 US HCS Software & Services Market Value (US$ Mn), By Product Type 2012-2016
TABLE 106 US HCS Software & Services Market Value (US$ Mn), By Product Type 2017-2022
TABLE 107 US HCS Software & Services Market Value (US$ Mn), By Industry 2012-2016
TABLE 108 US HCS Software & Services Market Value (US$ Mn), By Industry 2017-2022
TABLE 109 US HCS Software & Services Market Value (US$ Mn), By Application 2012-2016
TABLE 110 US HCS Software & Services Market Value (US$ Mn), By Application 2017-2022
TABLE 111 Canada HCS Software & Services Market Value (US$ Mn), By Product Type 2012-2016
TABLE 112 Canada HCS Software & Services Market Value (US$ Mn), By Product Type 2017-2022
TABLE 113 Canada HCS Software & Services Market Value (US$ Mn), By Industry 2012-2016
TABLE 114 Canada HCS Software & Services Market Value (US$ Mn), By Industry 2017-2022
TABLE 115 Canada HCS Software & Services Market Value (US$ Mn), By Application 2012-2016
TABLE 116 Canada HCS Software & Services Market Value (US$ Mn), By Application 2017-2022
TABLE 117 Brazil HCS Software & Services Market Value (US$ Mn), By Product Type 2012-2016
TABLE 118 Brazil HCS Software & Services Market Value (US$ Mn), By Product Type 2017-2022
TABLE 119 Brazil HCS Software & Services Market Value (US$ Mn), By Industry 2012-2016
TABLE 120 Brazil HCS Software & Services Market Value (US$ Mn), By Industry 2017-2022
TABLE 121 Brazil HCS Software & Services Market Value (US$ Mn), By Application 2012-2016
TABLE 122 Brazil HCS Software & Services Market Value (US$ Mn), By Application 2017-2022
TABLE 123 Mexico HCS Software & Services Market Value (US$ Mn), By Product Type 2012-2016
TABLE 124 Mexico HCS Software & Services Market Value (US$ Mn), By Product Type 2017-2022
TABLE 125 Mexico HCS Software & Services Market Value (US$ Mn), By Industry 2012-2016
TABLE 126 Mexico HCS Software & Services Market Value (US$ Mn), By Industry 2017-2022
TABLE 127 Mexico HCS Software & Services Market Value (US$ Mn), By Application 2012-2016
TABLE 128 Mexico HCS Software & Services Market Value (US$ Mn), By Application 2017-2022
TABLE 129 Argentina HCS Software & Services Market Value (US$ Mn), By Product Type 2012-2016
TABLE 130 Argentina HCS Software & Services Market Value (US$ Mn), By Product Type 2017-2022
TABLE 131 Argentina HCS Software & Services Market Value (US$ Mn), By Industry 2012-2016
TABLE 132 Argentina HCS Software & Services Market Value (US$ Mn), By Industry 2017-2022
TABLE 133 Argentina HCS Software & Services Market Value (US$ Mn), By Application 2012-2016
TABLE 134 Argentina HCS Software & Services Market Value (US$ Mn), By Application 2017-2022
TABLE 135 Germany HCS Software & Services Market Value (US$ Mn), By Product Type 2012-2016
TABLE 136 Germany HCS Software & Services Market Value (US$ Mn), By Product Type 2017-2022
TABLE 137 Germany HCS Software & Services Market Value (US$ Mn), By Industry 2012-2016
TABLE 138 Germany HCS Software & Services Market Value (US$ Mn), By Industry 2017-2022
TABLE 139 Germany HCS Software & Services Market Value (US$ Mn), By Application 2012-2016
TABLE 140 Germany HCS Software & Services Market Value (US$ Mn), By Application 2017-2022
TABLE 141 UK HCS Software & Services Market Value (US$ Mn), By Product Type 2012-2016
TABLE 142 UK HCS Software & Services Market Value (US$ Mn), By Product Type 2017-2022
TABLE 143 UK HCS Software & Services Market Value (US$ Mn), By Industry 2012-2016
TABLE 144 UK HCS Software & Services Market Value (US$ Mn), By Industry 2017-2022
TABLE 145 UK HCS Software & Services Market Value (US$ Mn), By Application 2012-2016
TABLE 146 UK HCS Software & Services Market Value (US$ Mn), By Application 2017-2022
TABLE 147 France HCS Software & Services Market Value (US$ Mn), By Product Type 2012-2016
TABLE 148 France HCS Software & Services Market Value (US$ Mn), By Product Type 2017-2022
TABLE 149 France HCS Software & Services Market Value (US$ Mn), By Industry 2012-2016
TABLE 150 France HCS Software & Services Market Value (US$ Mn), By Industry 2017-2022
TABLE 151 France HCS Software & Services Market Value (US$ Mn), By Application 2012-2016
TABLE 152 France HCS Software & Services Market Value (US$ Mn), By Application 2017-2022
TABLE 153 Spain HCS Software & Services Market Value (US$ Mn), By Product Type 2012-2016
TABLE 154 Spain HCS Software & Services Market Value (US$ Mn), By Product Type 2017-2022
TABLE 155 Spain HCS Software & Services Market Value (US$ Mn), By Industry 2012-2016
TABLE 156 Spain HCS Software & Services Market Value (US$ Mn), By Industry 2017-2022
TABLE 157 Spain HCS Software & Services Market Value (US$ Mn), By Application 2012-2016
TABLE 158 Spain HCS Software & Services Market Value (US$ Mn), By Application 2017-2022
TABLE 159 Italy HCS Software & Services Market Value (US$ Mn), By Product Type 2012-2016
TABLE 160 Italy HCS Software & Services Market Value (US$ Mn), By Product Type 2017-2022
TABLE 161 Italy HCS Software & Services Market Value (US$ Mn), By Industry 2012-2016
TABLE 162 Italy HCS Software & Services Market Value (US$ Mn), By Industry 2017-2022
TABLE 163 Italy HCS Software & Services Market Value (US$ Mn), By Application 2012-2016
TABLE 164 Italy HCS Software & Services Market Value (US$ Mn), By Application 2017-2022
TABLE 165 Nordic HCS Software & Services Market Value (US$ Mn), By Product Type 2012-2016
TABLE 166 Nordic HCS Software & Services Market Value (US$ Mn), By Product Type 2017-2022
TABLE 167 Nordic HCS Software & Services Market Value (US$ Mn), By Industry 2012-2016
TABLE 168 Nordic HCS Software & Services Market Value (US$ Mn), By Industry 2017-2022
TABLE 169 Nordic HCS Software & Services Market Value (US$ Mn), By Application 2012-2016
TABLE 170 Nordic HCS Software & Services Market Value (US$ Mn), By Application 2017-2022
TABLE 171 Japan HCS Software & Services Market Value (US$ Mn), By Product Type 2012-2016
TABLE 172 Japan HCS Software & Services Market Value (US$ Mn), By Product Type 2017-2022
TABLE 173 Japan HCS Software & Services Market Value (US$ Mn), By Industry 2012-2016
TABLE 174 Japan HCS Software & Services Market Value (US$ Mn), By Industry 2017-2022
TABLE 175 Japan HCS Software & Services Market Value (US$ Mn), By Application 2012-2016
TABLE 176 Japan HCS Software & Services Market Value (US$ Mn), By Application 2017-2022
TABLE 177 China HCS Software & Services Market Value (US$ Mn), By Product Type 2012-2016
TABLE 178 China HCS Software & Services Market Value (US$ Mn), By Product Type 2017-2022
TABLE 179 China HCS Software & Services Market Value (US$ Mn), By Industry 2012-2016
TABLE 180 China HCS Software & Services Market Value (US$ Mn), By Industry 2017-2022
TABLE 181 China HCS Software & Services Market Value (US$ Mn), By Application 2012-2016
TABLE 182 China HCS Software & Services Market Value (US$ Mn), By Application 2017-2022
TABLE 183 India HCS Software & Services Market Value (US$ Mn), By Product Type 2012-2016
TABLE 184 India HCS Software & Services Market Value (US$ Mn), By Product Type 2017-2022
TABLE 185 India HCS Software & Services Market Value (US$ Mn), By Industry 2012-2016
TABLE 186 India HCS Software & Services Market Value (US$ Mn), By Industry 2017-2022
TABLE 187 India HCS Software & Services Market Value (US$ Mn), By Application 2012-2016
TABLE 188 India HCS Software & Services Market Value (US$ Mn), By Application 2017-2022
TABLE 189 Malaysia HCS Software & Services Market Value (US$ Mn), By Product Type 2012-2016
TABLE 190 Malaysia HCS Software & Services Market Value (US$ Mn), By Product Type 2017-2022
TABLE 191 Malaysia HCS Software & Services Market Value (US$ Mn), By Industry 2012-2016
TABLE 192 Malaysia HCS Software & Services Market Value (US$ Mn), By Industry 2017-2022
TABLE 193 Malaysia HCS Software & Services Market Value (US$ Mn), By Application 2012-2016
TABLE 194 Malaysia HCS Software & Services Market Value (US$ Mn), By Application 2017-2022
TABLE 195 Thailand HCS Software & Services Market Value (US$ Mn), By Product Type 2012-2016
TABLE 196 Thailand HCS Software & Services Market Value (US$ Mn), By Product Type 2017-2022
TABLE 197 Thailand HCS Software & Services Market Value (US$ Mn), By Industry 2012-2016
TABLE 198 Thailand HCS Software & Services Market Value (US$ Mn), By Industry 2017-2022
TABLE 199 Thailand HCS Software & Services Market Value (US$ Mn), By Application 2012-2016
TABLE 200 Thailand HCS Software & Services Market Value (US$ Mn), By Application 2017-2022
TABLE 201 Singapore HCS Software & Services Market Value (US$ Mn), By Product Type 2012-2016
TABLE 202 Singapore HCS Software & Services Market Value (US$ Mn), By Product Type 2017-2022
TABLE 203 Singapore HCS Software & Services Market Value (US$ Mn), By Industry 2012-2016
TABLE 204 Singapore HCS Software & Services Market Value (US$ Mn), By Industry 2017-2022
TABLE 205 Singapore HCS Software & Services Market Value (US$ Mn), By Application 2012-2016
TABLE 206 Singapore HCS Software & Services Market Value (US$ Mn), By Application 2017-2022
TABLE 207 Australia HCS Software & Services Market Value (US$ Mn), By Product Type 2012-2016
TABLE 208 Australia HCS Software & Services Market Value (US$ Mn), By Product Type 2017-2022
TABLE 209 Australia HCS Software & Services Market Value (US$ Mn), By Industry 2012-2016
TABLE 210 Australia HCS Software & Services Market Value (US$ Mn), By Industry 2017-2022
TABLE 211 Australia HCS Software & Services Market Value (US$ Mn), By Application 2012-2016
TABLE 212 Australia HCS Software & Services Market Value (US$ Mn), By Application 2017-2022
TABLE 213 GCC Countries HCS Software & Services Market Value (US$ Mn), By Product Type 2012-2016
TABLE 214 GCC Countries HCS Software & Services Market Value (US$ Mn), By Product Type 2017-2022
TABLE 215 GCC Countries HCS Software & Services Market Value (US$ Mn), By Industry 2012-2016
TABLE 216 GCC Countries HCS Software & Services Market Value (US$ Mn), By Industry 2017-2022
TABLE 217 GCC Countries HCS Software & Services Market Value (US$ Mn), By Application 2012-2016
TABLE 218 GCC Countries HCS Software & Services Market Value (US$ Mn), By Application 2017-2022
TABLE 219 South Africa HCS Software & Services Market Value (US$ Mn), By Product Type 2012-2016
TABLE 220 South Africa HCS Software & Services Market Value (US$ Mn), By Product Type 2017-2022
TABLE 221 South Africa HCS Software & Services Market Value (US$ Mn), By Industry 2012-2016
TABLE 222 South Africa HCS Software & Services Market Value (US$ Mn), By Industry 2017-2022
TABLE 223 South Africa HCS Software & Services Market Value (US$ Mn), By Application 2012-2016
TABLE 224 South Africa HCS Software & Services Market Value (US$ Mn), By Application 2017-2022
TABLE 225 Nigeria HCS Software & Services Market Value (US$ Mn), By Product Type 2012-2016
TABLE 226 Nigeria HCS Software & Services Market Value (US$ Mn), By Product Type 2017-2022
TABLE 227 Nigeria HCS Software & Services Market Value (US$ Mn), By Industry 2012-2016
TABLE 228 Nigeria HCS Software & Services Market Value (US$ Mn), By Industry 2017-2022
TABLE 229 Nigeria HCS Software & Services Market Value (US$ Mn), By Application 2012-2016
TABLE 230 Nigeria HCS Software & Services Market Value (US$ Mn), By Application 2017-2022
TABLE 231 Israel HCS Software & Services Market Value (US$ Mn), By Product Type 2012-2016
TABLE 232 Israel HCS Software & Services Market Value (US$ Mn), By Product Type 2017-2022
TABLE 233 Israel HCS Software & Services Market Value (US$ Mn), By Industry 2012-2016
TABLE 234 Israel HCS Software & Services Market Value (US$ Mn), By Industry 2017-2022
TABLE 235 Israel HCS Software & Services Market Value (US$ Mn), By Application 2012-2016
TABLE 236 Israel HCS Software & Services Market Value (US$ Mn), By Application 2017-2022
List of Figure
FIG. 1 Global HCS Software & Services Market Value (US$ Mn), 2012-2016
FIG. 2 Global HCS Software & Services Market Value (US$ Mn) Forecast, 2017-2022
FIG. 3 Global HCS Software & Services Market Value (US$ Mn) and Y-o-Y, 2015-2022
FIG. 4 Global HCS Services Segment Market Value (US$ Mn) By Region, 2012-2016
FIG. 5 Global HCS Services Segment Market Value (US$ Mn) By Region, 2017-2022
FIG. 6 Global HCS Services Segment Y-o-Y Growth Rate, By Region, 2015-2022
FIG. 7 Global HCS Software Segment Market Value (US$ Mn) By Region, 2012-2016
FIG. 8 Global HCS Software Segment Market Value (US$ Mn) By Region, 2017-2022
FIG. 9 Global HCS Software Segment Y-o-Y Growth Rate, By Region, 2015-2022
FIG. 10 Global Biotechnology Segment Market Value (US$ Mn) By Region, 2012-2016
FIG. 11 Global Biotechnology Segment Market Value (US$ Mn) By Region, 2017-2022
FIG. 12 Global Biotechnology Segment Y-o-Y Growth Rate, By Region, 2015-2022
FIG. 13 Global Educational Institutions Segment Market Value (US$ Mn) By Region, 2012-2016
FIG. 14 Global Educational Institutions Segment Market Value (US$ Mn) By Region, 2017-2022
FIG. 15 Global Educational Institutions Segment Y-o-Y Growth Rate, By Region, 2015-2022
FIG. 16 Global Government Organizations Segment Market Value (US$ Mn) By Region, 2012-2016
FIG. 17 Global Government Organizations Segment Market Value (US$ Mn) By Region, 2017-2022
FIG. 18 Global Government Organizations Segment Y-o-Y Growth Rate, By Region, 2015-2022
FIG. 19 Global Independent Contract Research Organizations Segment Market Value (US$ Mn) By Region, 2012-2016
FIG. 20 Global Independent Contract Research Organizations Segment Market Value (US$ Mn) By Region, 2017-2022
FIG. 21 Global Independent Contract Research Organizations Segment Y-o-Y Growth Rate, By Region, 2015-2022
FIG. 22 Global Pharmaceutical and Healthcare Segment Market Value (US$ Mn) By Region, 2012-2016
FIG. 23 Global Pharmaceutical and Healthcare Segment Market Value (US$ Mn) By Region, 2017-2022
FIG. 24 Global Pharmaceutical and Healthcare Segment Y-o-Y Growth Rate, By Region, 2015-2022
FIG. 25 Global Other Industries Segment Market Value (US$ Mn) By Region, 2012-2016
FIG. 26 Global Other Industries Segment Market Value (US$ Mn) By Region, 2017-2022
FIG. 27 Global Other Industries Segment Y-o-Y Growth Rate, By Region, 2015-2022
FIG. 28 Global Compound Profiling Segment Market Value (US$ Mn) By Region, 2012-2016
FIG. 29 Global Compound Profiling Segment Market Value (US$ Mn) By Region, 2017-2022
FIG. 30 Global Compound Profiling Segment Y-o-Y Growth Rate, By Region, 2015-2022
FIG. 31 Global Primary & Secondary Screening Segment Market Value (US$ Mn) By Region, 2012-2016
FIG. 32 Global Primary & Secondary Screening Segment Market Value (US$ Mn) By Region, 2017-2022
FIG. 33 Global Primary & Secondary Screening Segment Y-o-Y Growth Rate, By Region, 2015-2022
FIG. 34 Global Target Identification and Validation Segment Market Value (US$ Mn) By Region, 2012-2016
FIG. 35 Global Target Identification and Validation Segment Market Value (US$ Mn) By Region, 2017-2022
FIG. 36 Global Target Identification and Validation Segment Y-o-Y Growth Rate, By Region, 2015-2022
FIG. 37 Global Toxicity Studies Segment Market Value (US$ Mn) By Region, 2012-2016
FIG. 38 Global Toxicity Studies Segment Market Value (US$ Mn) By Region, 2017-2022
FIG. 39 Global Toxicity Studies Segment Y-o-Y Growth Rate, By Region, 2015-2022
FIG. 40 Global Others Segment Market Value (US$ Mn) By Region, 2012-2016
FIG. 41 Global Others Segment Market Value (US$ Mn) By Region, 2017-2022
FIG. 42 Global Others Segment Y-o-Y Growth Rate, By Region, 2015-2022
FIG. 43 North America HCS Software & Services Market Value (US$ Mn), By Product Type 2012-2016
FIG. 44 North America HCS Software & Services Market Value (US$ Mn), By Product Type 2017-2022
FIG. 45 North America HCS Software & Services Market Value (US$ Mn), By Industry 2012-2016
FIG. 46 North America HCS Software & Services Market Value (US$ Mn), By Industry 2017-2022
FIG. 47 North America HCS Software & Services Market Value (US$ Mn), By Application 2012-2016
FIG. 48 North America HCS Software & Services Market Value (US$ Mn), By Application 2017-2022
FIG. 49 Latin America HCS Software & Services Market Value (US$ Mn), By Product Type 2012-2016
FIG. 50 Latin America HCS Software & Services Market Value (US$ Mn), By Product Type 2017-2022
FIG. 51 Latin America HCS Software & Services Market Value (US$ Mn), By Industry 2012-2016
FIG. 52 Latin America HCS Software & Services Market Value (US$ Mn), By Industry 2017-2022
FIG. 53 Latin America HCS Software & Services Market Value (US$ Mn), By Application 2012-2016
FIG. 54 Latin America HCS Software & Services Market Value (US$ Mn), By Application 2017-2022
FIG. 55 Europe HCS Software & Services Market Value (US$ Mn), By Product Type 2012-2016
FIG. 56 Europe HCS Software & Services Market Value (US$ Mn), By Product Type 2017-2022
FIG. 57 Europe HCS Software & Services Market Value (US$ Mn), By Industry 2012-2016
FIG. 58 Europe HCS Software & Services Market Value (US$ Mn), By Industry 2017-2022
FIG. 59 Europe HCS Software & Services Market Value (US$ Mn), By Application 2012-2016
FIG. 60 Europe HCS Software & Services Market Value (US$ Mn), By Application 2017-2022
FIG. 61 Japan HCS Software & Services Market Value (US$ Mn), By Product Type 2012-2016
FIG. 62 Japan HCS Software & Services Market Value (US$ Mn), By Product Type 2017-2022
FIG. 63 Japan HCS Software & Services Market Value (US$ Mn), By Industry 2012-2016
FIG. 64 Japan HCS Software & Services Market Value (US$ Mn), By Industry 2017-2022
FIG. 65 Japan HCS Software & Services Market Value (US$ Mn), By Application 2012-2016
FIG. 66 Japan HCS Software & Services Market Value (US$ Mn), By Application 2017-2022
FIG. 67 APEJ HCS Software & Services Market Value (US$ Mn), By Product Type 2012-2016
FIG. 68 APEJ HCS Software & Services Market Value (US$ Mn), By Product Type 2017-2022
FIG. 69 APEJ HCS Software & Services Market Value (US$ Mn), By Industry 2012-2016
FIG. 70 APEJ HCS Software & Services Market Value (US$ Mn), By Industry 2017-2022
FIG. 71 APEJ HCS Software & Services Market Value (US$ Mn), By Application 2012-2016
FIG. 72 APEJ HCS Software & Services Market Value (US$ Mn), By Application 2017-2022
FIG. 73 MEA HCS Software & Services Market Value (US$ Mn), By Product Type 2012-2016
FIG. 74 MEA HCS Software & Services Market Value (US$ Mn), By Product Type 2017-2022
FIG. 75 MEA HCS Software & Services Market Value (US$ Mn), By Industry 2012-2016
FIG. 76 MEA HCS Software & Services Market Value (US$ Mn), By Industry 2017-2022
FIG. 77 MEA HCS Software & Services Market Value (US$ Mn), By Application 2012-2016
FIG. 78 MEA HCS Software & Services Market Value (US$ Mn), By Application 2017-2022
Copyright © Transparency Market Research, Inc. All Rights reserved
Trust Online

HCS Software and Services Market