

Reports
Reports
The global hazelnut market size was valued at USD 10.2 Billion in 2025 and is projected to reach USD 26.1 Billion by 2036, expanding at a CAGR of 8.9% from 2026 to 2036. Market growth is attributed to the surging global demand for hazelnuts in confectionery and chocolate products, heightened consumption of hazelnut spreads, augmented utilization of hazelnut ingredients in bakery, snacks, dairy, and foodservice applications.
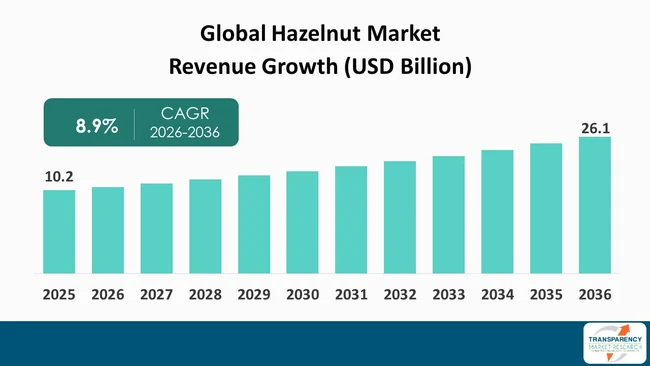
The global hazelnut market is moving toward a more diversified and quality-driven structure, supported by steady demand across confectionery, bakery, snacks, spreads, and premium food products. The market also benefits from growing interest in plant-based foods and nutrient-dense ingredients, while processors increasingly seek consistent kernel quality, flavor, and functionality. Earlier estimates by the International Nut and Dried Fruit Council in May 2026 had suggested that hazelnut output could rise by 39% in the next season.
The Hazelnut Market is highly associated with international trade because of the production and consumption concentration in different countries. European processors and confectionery makers continue to be important demand centers. The global market is supplied by Türkiye, Italy, the United States, Chile, Azerbaijan and Georgia. This geography is conducive to sourcing diversification, quality differentiation, inventory planning and supplier relationships.
The market is also placing greater emphasis on crop resilience. Weather variability, pest and disease pressure and changes in production economics are driving growers and breeders to improve orchard management, cultivar selection and disease resistance. Such efforts may improve the reliability of supply and allow for greater plantings where climate conditions are suitable and modern orchard systems exist. USDA research confirms breeding efforts for disease resistant cultivars and commercial performance.
The Hazelnut Market covers the production, harvesting, processing, trading and consumption of hazelnuts and products derived from hazelnut kernels. Hazelnuts are eaten whole and processed into ingredients such as paste, cream, pieces, flour, oil and other forms for use by food manufacturers. The market serves confectionery, bakery, snacks, cereals, dairy products, desserts, spreads and foodservice applications.
The hazelnut market connects growers with processors, exporters, ingredient manufacturers, food producers, retailers, and foodservice companies. Cultivation depends on appropriate climate, orchard management, cultivar performance, pollination, pest control, disease management and harvesting practices. Typical processing includes drying, cleaning, sorting, cracking, grading, shelling, roasting, blanching, grinding and further processing into ingredients depending on end-use requirements.
| Attribute | Detail |
|---|---|
| Market Drivers |
|
Growth in the Hazelnut Market is driven by consumer interest in balanced diets, plant based nutrition and minimally processed foods. Hazelnuts are a convenient nut form that can be eaten as is or added to foods where texture, flavor and nutritional value are important. Therefore, the market can respond to demand from consumers seeking alternatives to heavily processed snack foods and manufacturers creating foods around familiar ingredients. The World Health Organization has said that people over the age of ten should eat at least 25 grams of naturally occurring dietary fiber a day by 2026 and lists nuts among healthy foods in its guidance.
This health orientation helps the Hazelnut Market in a variety of applications. Whole roasted hazelnuts are suitable for snacking, while chopped kernels can be processed into meal, flour, paste, and other ingredients for breakfast products, bakery items, spreads, and desserts. The market also benefits from brands that communicate more clearly about plant based ingredients, nutrient density and ingredient quality, especially across premium and better-for-your product categories.
Demand for a wider range of plant-based food options further supports the hazelnut market. Hazelnuts can be used by food manufacturers to provide flavor and texture to products that are developed in response to the wider interest in plant derived ingredients. This allows processors to deliver standardized kernel specifications and controlled roasting profiles, particle sizes and ingredient formats to suit various manufacturing requirements.
As health-oriented positioning continues to grow, there is opportunity for increased visibility across retail and foodservice channels in the market. Companies can increase acceptance by combining reliable sourcing with clear labeling, traceability, consistent quality and convenient formats. The Hazelnut Market is thus well-positioned to capitalize on nutrition driven product development without depending entirely on traditional confectionery applications.
The hazelnut market is strongly linked to confectionery demand due to the nut’s distinctive flavor, texture, aroma, and processing versatility. They are used in chocolates, spreads, pralines, cookies, cakes, desserts and other sweet products. Food manufacturers are expanding premium confectionery portfolios with new textures or reformulating established products with differentiated nut ingredients. These trends are supporting demand for hazelnut ingredients across confectionery applications. The International Cocoa Organization reported global cocoa grindings at 4.628 million tons for the 2024/25 cocoa year, highlighting the large processing base related to chocolate and cocoa products.
The Hazelnut Market is further supported by the wide range of formats offered to confectionery manufacturers. Kernels can be roasted, chopped, ground, made into a paste or blended with other ingredients. This flexibility enables the market to serve both mass market products and premium products where sensory quality and ingredient identity are key to positioning. Thus, hazelnuts remain versatile for several formulation and processing needs.
Demand also extends beyond finished chocolate bars to spreads, fillings, wafers, biscuits, ice cream, bakery products, and dessert preparations. Ingredient suppliers can compete on kernel size, roast intensity, paste smoothness, flavor consistency and functional performance. These specifications allow manufacturers to create products with consistent sensory characteristics while enabling efficient and repeatable production on global manufacturing lines.
Continuous innovation in confectionery offers the market opportunities to grow with new formats and product concepts. Manufacturers are able to blend hazelnuts with cocoa, dairy, plant-based ingredients, cereals, fruit and sweeteners to provide consumers with a differentiated experience. The Hazelnut Market can therefore benefit from premiumization, texture innovation and wider use of ingredients in chocolate-adjacent categories, especially where processors can provide reliable quality and supply continuity.
As growers and researchers breed cultivars and develop production systems adapted to a range of environments, the hazelnut market has the opportunity to expand its geographic supply base. This diversification can lessen reliance on a few established sources and give processors more choices for sourcing. The Chilean hazelnut crop was predicted to be around 80,000 metric tons by 2025 according to the International Nut and Dried Fruit Council, which is evidence of the rise of a significant production base outside of the traditional origins.
Breeding programs focused on disease resistance, yield, kernel quality, and environmental adaptation can also support market development. The USDA research emphasizes the ongoing work in breeding cultivars resistant to Eastern Filbert Blight, but also with commercially desirable traits. These efforts can help support more reliable orchard establishment, and allow the Hazelnut Market to develop in areas where disease pressure previously limited commercial production.
Climate resilience offers another market opportunity. The USDA Climate Hubs describe hazelnuts as a perennial crop that is drought-resilient, beneficial for carbon storage and reduced soil erosion, and has potential to expand production under the right conditions. These characteristics can support greater use of diversified perennial cropping systems while improving soil, water, and orchard management.
The hazelnut market can capitalize on this opportunity through long-term relationships with growers, improved genetics, traceable sourcing, precision orchard practices, and efficient processing. Buyers can broaden their supplier portfolios and processors can create origin-specific products and sustainability-driven propositions. The market will therefore gain from geographic diversification if the new production is commercially viable, of good quality and has an outlet in existing trade and processing networks.
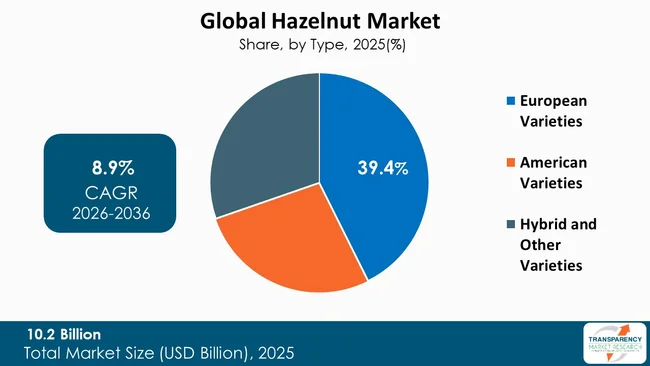
The European Varieties segment dominated the global hazelnut market in 2025 and holds 58.2%, supported by the widespread commercial cultivation of European hazelnut varieties and their established role in processing and ingredient applications. European Varieties are valued for kernel quality, commercial performance and established cultivar development. The market is therefore strongly dependent on European genetic material in important areas of cultivation and processing industries.
American Varieties, a distinct segment within the Hazelnut Market, encompass native species such as Corylus Americana and other North American hazelnuts. USDA resources indicate that American hazelnuts are tolerant of a variety of soils and climates and are widespread throughout North America. However, native American species are not normally grown as major crops for the market and their role is therefore limited in comparison with European Varieties. Their importance relates to genetic resources, breeding, disease resistance and future diversification.
Hybrid and Other Varieties represent an emerging segment of the market. These materials are a blend of European and American characteristics with breeding programs directed toward disease resistance, hardiness, productivity and kernel quality. “Hybrids are a combination of traits from different species,” says USDA research. European Varieties continue to dominate the market, while hybrid varieties may gain importance through breeding programs focused on disease resistance, hardiness, productivity, and kernel quality.
| Attribute | Detail |
|---|---|
| Leading Region |
|
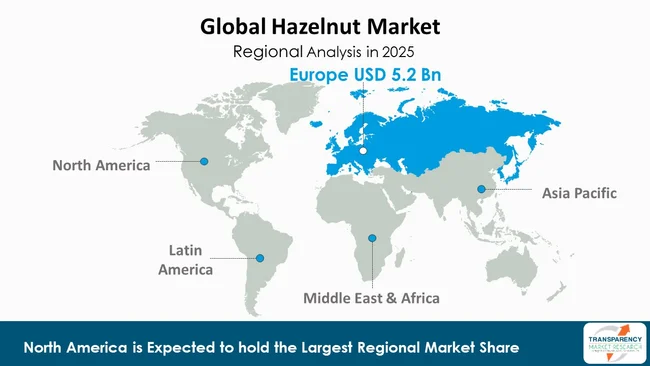
The leading region in the Hazelnut Market is Europe, owing to its significance as a major consumption, processing, trading, and confectionery hub. According to the International Nut and Dried Fruit Council, Europe continues to be the main market for hazelnuts, and European countries are key destinations for supplies from top producing origins. This position allows European processors and buyers to influence quality requirements, product specifications, procurement practices, and processing demand.
The European hazelnut market is tightly linked to Turkiye and Italy, established production hubs supplying regional processors and international buyers. Turkiye made up 62% of the world’s hazelnut output in 2023/24, the International Nut and Dried Fruit Council said. The concentration of supply in addition to Europe’s existing food manufacturing base further substantiates the importance of the region along the market value chain. European processing activity is also supported by demand for kernels, roasted products, pastes, and other hazelnut ingredients.
Europe remains the leading regional market with other regions contributing through production growth, imports, processing and consumption. Other regions are also contributing through production growth, imports, processing, and consumption. Established cultivation in the Americas, expanding production in Chile and other origins, and growing consumption across Asia are supporting greater geographic diversification of the global market. Nevertheless, Europe remains central to the global hazelnut market due to its integrated trade network, strong confectionery industry, processing capabilities, and established links with major producing countries.
Arslanturk, Balsu Gıda, Besana Group, Cascade Foods, Durak Fındık, ELKA Group, Ferrero Hazelnut Company, Georgian Nuts Factory, Gursoy, Holmquist Hazelnut Orchards, Karimex, Karin Gıda, Northwest Hazelnut Company, NUTSGE LLC, Poyraz Poyraz Hazelnut Integrated are some of the leading manufacturers operating in the hazelnut market.
Each of these companies has been profiled in the hazelnut market report based on parameters such as company overview, business strategies, financial overview, business segments, product portfolio, and recent developments.
| Attribute | Detail |
|---|---|
| Market Size Value in 2025 (Base Year) | USD 10.2 Billion |
| Market Forecast Value in 2036 | USD 26.1 Billion |
| Growth Rate (CAGR 2026 to 2036) | 8.9% |
| Forecast Period | 2026-2036 |
| Historical data Available for | 2021-2025 |
| Quantitative Units | USD Billion for Value and Tons for Volume |
| Market Analysis | Global qualitative analysis includes drivers, restraints, opportunities, key trends, key market indicators, Porter’s Five Forces analysis, value chain analysis, SWOT analysis, etc. Furthermore, at the regional level, qualitative analysis includes key trends, price trends, and key supplier analysis. |
| Competition Landscape |
|
| Format | Electronic (PDF) + Excel |
| Market Segmentation | Type
|
| Regions Covered |
|
| Countries Covered |
|
| Companies Profiled |
|
| Customization Scope | Available upon request |
| Pricing | Available upon request |
The hazelnut market was valued at USD 10.2 Billion in 2025.
The hazelnut industry is projected to reach USD 26.1 Billion by 2036.
Key drivers include growing health oriented food preferences supporting hazelnut demand and increasing confectionery and chocolate applications expanding hazelnut consumption .
The hazelnut market is anticipated to expand at a CAGR of 8.9% from 2026 to 2036.
Europe dominated the hazelnut market in 2025.
Arslanturk, Balsu Gıda, Besana Group, Cascade Foods, Durak Fındık, ELKA Group, Ferrero Hazelnut Company, Georgian Nuts Factory, Gursoy, Holmquist Hazelnut Orchards, Karimex, Karin Gıda, Northwest Hazelnut Company, NUTSGE LLC, and Poyraz Poyraz Hazelnut Integrated are among the prominent players operating in the global hazelnut market.
Table 01: Region Hazelnut Market Value (USD Billion) Projection, By Type 2021 to 2036
Table 02: Region Hazelnut Market Volume (Tons) Projection, By Type 2021 to 2036
Table 03: Region Hazelnut Market Value (USD Billion) Projection, By Product Form 2021 to 2036
Table 04: Region Hazelnut Market Volume (Tons) Projection, By Product Form 2021 to 2036
Table 05: Region Hazelnut Market Value (USD Billion) Projection, By Nature 2021 to 2036
Table 06: Region Hazelnut Market Volume (Tons) Projection, By Nature 2021 to 2036
Table 07: Region Hazelnut Market Value (USD Billion) Projection, By End-use 2021 to 2036
Table 08: Region Hazelnut Market Volume (Tons) Projection, By End-use 2021 to 2036
Table 09: Region Hazelnut Market Value (USD Billion) Projection, By Distribution Channel 2021 to 2036
Table 10: Region Hazelnut Market Volume (Tons) Projection, By Distribution Channel 2021 to 2036
Table 11: Region Hazelnut Market Value (USD Billion) Projection, By Region 2021 to 2036
Table 12: Region Hazelnut Market Volume (Tons) Projection, By Region 2021 to 2036
Table 13: North America Hazelnut Market Value (USD Billion) Projection, By Type 2021 to 2036
Table 14: North America Hazelnut Market Volume (Tons) Projection, By Type 2021 to 2036
Table 15: North America Hazelnut Market Value (USD Billion) Projection, By Product Form 2021 to 2036
Table 16: North America Hazelnut Market Volume (Tons) Projection, By Product Form 2021 to 2036
Table 17: North America Hazelnut Market Value (USD Billion) Projection, By Nature 2021 to 2036
Table 18: North America Hazelnut Market Volume (Tons) Projection, By Nature 2021 to 2036
Table 19: North America Hazelnut Market Value (USD Billion) Projection, By End-use 2021 to 2036
Table 20: North America Hazelnut Market Volume (Tons) Projection, By End-use 2021 to 2036
Table 21: North America Hazelnut Market Value (USD Billion) Projection, By Distribution Channel 2021 to 2036
Table 22: North America Hazelnut Market Volume (Tons) Projection, By Distribution Channel 2021 to 2036
Table 23: North America Hazelnut Market Value (USD Billion) Projection, By Country 2021 to 2036
Table 24: North America Hazelnut Market Volume (Tons) Projection, By Country 2021 to 2036
Table 25: U.S. Hazelnut Market Value (USD Billion) Projection, By Type 2021 to 2036
Table 26: U.S. Hazelnut Market Volume (Tons) Projection, By Type 2021 to 2036
Table 27: U.S. Hazelnut Market Value (USD Billion) Projection, By Product Form 2021 to 2036
Table 28: U.S. Hazelnut Market Volume (Tons) Projection, By Product Form 2021 to 2036
Table 29: U.S. Hazelnut Market Value (USD Billion) Projection, By Nature 2021 to 2036
Table 30: U.S. Hazelnut Market Volume (Tons) Projection, By Nature 2021 to 2036
Table 31: U.S. Hazelnut Market Value (USD Billion) Projection, By End-use 2021 to 2036
Table 32: U.S. Hazelnut Market Volume (Tons) Projection, By End-use 2021 to 2036
Table 33: U.S. Hazelnut Market Value (USD Billion) Projection, By Distribution Channel 2021 to 2036
Table 34: U.S. Hazelnut Market Volume (Tons) Projection, By Distribution Channel 2021 to 2036
Table 35: Canada Hazelnut Market Value (USD Billion) Projection, By Type 2021 to 2036
Table 36: Canada Hazelnut Market Volume (Tons) Projection, By Type 2021 to 2036
Table 37: Canada Hazelnut Market Value (USD Billion) Projection, By Product Form 2021 to 2036
Table 38: Canada Hazelnut Market Volume (Tons) Projection, By Product Form 2021 to 2036
Table 39: Canada Hazelnut Market Value (USD Billion) Projection, By Nature 2021 to 2036
Table 40: Canada Hazelnut Market Volume (Tons) Projection, By Nature 2021 to 2036
Table 41: Canada Hazelnut Market Value (USD Billion) Projection, By End-use 2021 to 2036
Table 42: Canada Hazelnut Market Volume (Tons) Projection, By End-use 2021 to 2036
Table 43: Canada Hazelnut Market Value (USD Billion) Projection, By Distribution Channel 2021 to 2036
Table 44: Canada Hazelnut Market Volume (Tons) Projection, By Distribution Channel 2021 to 2036
Table 45: Europe Hazelnut Market Value (USD Billion) Projection, By Type 2021 to 2036
Table 46: Europe Hazelnut Market Volume (Tons) Projection, By Type 2021 to 2036
Table 47: Europe Hazelnut Market Value (USD Billion) Projection, By Product Form 2021 to 2036
Table 48: Europe Hazelnut Market Volume (Tons) Projection, By Product Form 2021 to 2036
Table 49: Europe Hazelnut Market Value (USD Billion) Projection, By Nature 2021 to 2036
Table 50: Europe Hazelnut Market Volume (Tons) Projection, By Nature 2021 to 2036
Table 51: Europe Hazelnut Market Value (USD Billion) Projection, By End-use 2021 to 2036
Table 52: Europe Hazelnut Market Volume (Tons) Projection, By End-use 2021 to 2036
Table 53: Europe Hazelnut Market Value (USD Billion) Projection, By Distribution Channel 2021 to 2036
Table 54: Europe Hazelnut Market Volume (Tons) Projection, By Distribution Channel 2021 to 2036
Table 55: Europe Hazelnut Market Value (USD Billion) Projection, By Country 2021 to 2036
Table 56: Europe Hazelnut Market Volume (Tons) Projection, By Country 2021 to 2036
Table 57: U.K. Hazelnut Market Value (USD Billion) Projection, By Type 2021 to 2036
Table 58: U.K. Hazelnut Market Volume (Tons) Projection, By Type 2021 to 2036
Table 59: U.K. Hazelnut Market Value (USD Billion) Projection, By Product Form 2021 to 2036
Table 60: U.K. Hazelnut Market Volume (Tons) Projection, By Product Form 2021 to 2036
Table 61: U.K. Hazelnut Market Value (USD Billion) Projection, By Nature 2021 to 2036
Table 62: U.K. Hazelnut Market Volume (Tons) Projection, By Nature 2021 to 2036
Table 63: U.K. Hazelnut Market Value (USD Billion) Projection, By End-use 2021 to 2036
Table 64: U.K. Hazelnut Market Volume (Tons) Projection, By End-use 2021 to 2036
Table 65: U.K. Hazelnut Market Value (USD Billion) Projection, By Distribution Channel 2021 to 2036
Table 66: U.K. Hazelnut Market Volume (Tons) Projection, By Distribution Channel 2021 to 2036
Table 67: Germany Hazelnut Market Value (USD Billion) Projection, By Type 2021 to 2036
Table 68: Germany Hazelnut Market Volume (Tons) Projection, By Type 2021 to 2036
Table 69: Germany Hazelnut Market Value (USD Billion) Projection, By Product Form 2021 to 2036
Table 70: Germany Hazelnut Market Volume (Tons) Projection, By Product Form 2021 to 2036
Table 71: Germany Hazelnut Market Value (USD Billion) Projection, By Nature 2021 to 2036
Table 72: Germany Hazelnut Market Volume (Tons) Projection, By Nature 2021 to 2036
Table 73: Germany Hazelnut Market Value (USD Billion) Projection, By End-use 2021 to 2036
Table 74: Germany Hazelnut Market Volume (Tons) Projection, By End-use 2021 to 2036
Table 75: Germany Hazelnut Market Value (USD Billion) Projection, By Distribution Channel 2021 to 2036
Table 76: Germany Hazelnut Market Volume (Tons) Projection, By Distribution Channel 2021 to 2036
Table 77: France Hazelnut Market Value (USD Billion) Projection, By Type 2021 to 2036
Table 78: France Hazelnut Market Volume (Tons) Projection, By Type 2021 to 2036
Table 79: France Hazelnut Market Value (USD Billion) Projection, By Product Form 2021 to 2036
Table 80: France Hazelnut Market Volume (Tons) Projection, By Product Form 2021 to 2036
Table 81: France Hazelnut Market Value (USD Billion) Projection, By Nature 2021 to 2036
Table 82: France Hazelnut Market Volume (Tons) Projection, By Nature 2021 to 2036
Table 83: France Hazelnut Market Value (USD Billion) Projection, By End-use 2021 to 2036
Table 84: France Hazelnut Market Volume (Tons) Projection, By End-use 2021 to 2036
Table 85: France Hazelnut Market Value (USD Billion) Projection, By Distribution Channel 2021 to 2036
Table 86: France Hazelnut Market Volume (Tons) Projection, By Distribution Channel 2021 to 2036
Table 87: Italy Hazelnut Market Value (USD Billion) Projection, By Type 2021 to 2036
Table 88: Italy Hazelnut Market Volume (Tons) Projection, By Type 2021 to 2036
Table 89: Italy Hazelnut Market Value (USD Billion) Projection, By Product Form 2021 to 2036
Table 90: Italy Hazelnut Market Volume (Tons) Projection, By Product Form 2021 to 2036
Table 91: Italy Hazelnut Market Value (USD Billion) Projection, By Nature 2021 to 2036
Table 92: Italy Hazelnut Market Volume (Tons) Projection, By Nature 2021 to 2036
Table 93: Italy Hazelnut Market Value (USD Billion) Projection, By End-use 2021 to 2036
Table 94: Italy Hazelnut Market Volume (Tons) Projection, By End-use 2021 to 2036
Table 95: Italy Hazelnut Market Value (USD Billion) Projection, By Distribution Channel 2021 to 2036
Table 96: Italy Hazelnut Market Volume (Tons) Projection, By Distribution Channel 2021 to 2036
Table 97: Spain Hazelnut Market Value (USD Billion) Projection, By Type 2021 to 2036
Table 98: Spain Hazelnut Market Volume (Tons) Projection, By Type 2021 to 2036
Table 99: Spain Hazelnut Market Value (USD Billion) Projection, By Product Form 2021 to 2036
Table 100: Spain Hazelnut Market Volume (Tons) Projection, By Product Form 2021 to 2036
Table 101: Spain Hazelnut Market Value (USD Billion) Projection, By Nature 2021 to 2036
Table 102: Spain Hazelnut Market Volume (Tons) Projection, By Nature 2021 to 2036
Table 103: Spain Hazelnut Market Value (USD Billion) Projection, By End-use 2021 to 2036
Table 104: Spain Hazelnut Market Volume (Tons) Projection, By End-use 2021 to 2036
Table 105: Spain Hazelnut Market Value (USD Billion) Projection, By Distribution Channel 2021 to 2036
Table 106: Spain Hazelnut Market Volume (Tons) Projection, By Distribution Channel 2021 to 2036
Table 107: The Netherlands Hazelnut Market Value (USD Billion) Projection, By Type 2021 to 2036
Table 108: The Netherlands Hazelnut Market Volume (Tons) Projection, By Type 2021 to 2036
Table 109: The Netherlands Hazelnut Market Value (USD Billion) Projection, By Product Form 2021 to 2036
Table 110: The Netherlands Hazelnut Market Volume (Tons) Projection, By Product Form 2021 to 2036
Table 111: The Netherlands Hazelnut Market Value (USD Billion) Projection, By Nature 2021 to 2036
Table 112: The Netherlands Hazelnut Market Volume (Tons) Projection, By Nature 2021 to 2036
Table 113: The Netherlands Hazelnut Market Value (USD Billion) Projection, By End-use 2021 to 2036
Table 114: The Netherlands Hazelnut Market Volume (Tons) Projection, By End-use 2021 to 2036
Table 115: The Netherlands Hazelnut Market Value (USD Billion) Projection, By Distribution Channel 2021 to 2036
Table 116: The Netherlands Hazelnut Market Volume (Tons) Projection, By Distribution Channel 2021 to 2036
Table 117: Asia Pacific Hazelnut Market Value (USD Billion) Projection, By Type 2021 to 2036
Table 118: Asia Pacific Hazelnut Market Volume (Tons) Projection, By Type 2021 to 2036
Table 119: Asia Pacific Hazelnut Market Value (USD Billion) Projection, By Product Form 2021 to 2036
Table 120: Asia Pacific Hazelnut Market Volume (Tons) Projection, By Product Form 2021 to 2036
Table 121: Asia Pacific Hazelnut Market Value (USD Billion) Projection, By Nature 2021 to 2036
Table 122: Asia Pacific Hazelnut Market Volume (Tons) Projection, By Nature 2021 to 2036
Table 123: Asia Pacific Hazelnut Market Value (USD Billion) Projection, By End-use 2021 to 2036
Table 124: Asia Pacific Hazelnut Market Volume (Tons) Projection, By End-use 2021 to 2036
Table 125: Asia Pacific Hazelnut Market Value (USD Billion) Projection, By Distribution Channel 2021 to 2036
Table 126: Asia Pacific Hazelnut Market Volume (Tons) Projection, By Distribution Channel 2021 to 2036
Table 127: Asia Pacific Hazelnut Market Value (USD Billion) Projection, By Country 2021 to 2036
Table 128: Asia Pacific Hazelnut Market Volume (Tons) Projection, By Country 2021 to 2036
Table 129: China Hazelnut Market Value (USD Billion) Projection, By Type 2021 to 2036
Table 130: China Hazelnut Market Volume (Tons) Projection, By Type 2021 to 2036
Table 131: China Hazelnut Market Value (USD Billion) Projection, By Product Form 2021 to 2036
Table 132: China Hazelnut Market Volume (Tons) Projection, By Product Form 2021 to 2036
Table 133: China Hazelnut Market Value (USD Billion) Projection, By Nature 2021 to 2036
Table 134: China Hazelnut Market Volume (Tons) Projection, By Nature 2021 to 2036
Table 135: China Hazelnut Market Value (USD Billion) Projection, By End-use 2021 to 2036
Table 136: China Hazelnut Market Volume (Tons) Projection, By End-use 2021 to 2036
Table 137: China Hazelnut Market Value (USD Billion) Projection, By Distribution Channel 2021 to 2036
Table 138: China Hazelnut Market Volume (Tons) Projection, By Distribution Channel 2021 to 2036
Table 139: India Hazelnut Market Value (USD Billion) Projection, By Type 2021 to 2036
Table 140: India Hazelnut Market Volume (Tons) Projection, By Type 2021 to 2036
Table 141: India Hazelnut Market Value (USD Billion) Projection, By Product Form 2021 to 2036
Table 142: India Hazelnut Market Volume (Tons) Projection, By Product Form 2021 to 2036
Table 143: India Hazelnut Market Value (USD Billion) Projection, By Nature 2021 to 2036
Table 144: India Hazelnut Market Volume (Tons) Projection, By Nature 2021 to 2036
Table 145: India Hazelnut Market Value (USD Billion) Projection, By End-use 2021 to 2036
Table 146: India Hazelnut Market Volume (Tons) Projection, By End-use 2021 to 2036
Table 147: India Hazelnut Market Value (USD Billion) Projection, By Distribution Channel 2021 to 2036
Table 148: India Hazelnut Market Volume (Tons) Projection, By Distribution Channel 2021 to 2036
Table 149: Japan Hazelnut Market Value (USD Billion) Projection, By Type 2021 to 2036
Table 150: Japan Hazelnut Market Volume (Tons) Projection, By Type 2021 to 2036
Table 151: Japan Hazelnut Market Value (USD Billion) Projection, By Product Form 2021 to 2036
Table 152: Japan Hazelnut Market Volume (Tons) Projection, By Product Form 2021 to 2036
Table 153: Japan Hazelnut Market Value (USD Billion) Projection, By Nature 2021 to 2036
Table 154: Japan Hazelnut Market Volume (Tons) Projection, By Nature 2021 to 2036
Table 155: Japan Hazelnut Market Value (USD Billion) Projection, By End-use 2021 to 2036
Table 156: Japan Hazelnut Market Volume (Tons) Projection, By End-use 2021 to 2036
Table 157: Japan Hazelnut Market Value (USD Billion) Projection, By Distribution Channel 2021 to 2036
Table 158: Japan Hazelnut Market Volume (Tons) Projection, By Distribution Channel 2021 to 2036
Table 159: Australia Hazelnut Market Value (USD Billion) Projection, By Type 2021 to 2036
Table 160: Australia Hazelnut Market Volume (Tons) Projection, By Type 2021 to 2036
Table 161: Australia Hazelnut Market Value (USD Billion) Projection, By Product Form 2021 to 2036
Table 162: Australia Hazelnut Market Volume (Tons) Projection, By Product Form 2021 to 2036
Table 163: Australia Hazelnut Market Value (USD Billion) Projection, By Nature 2021 to 2036
Table 164: Australia Hazelnut Market Volume (Tons) Projection, By Nature 2021 to 2036
Table 165: Australia Hazelnut Market Value (USD Billion) Projection, By End-use 2021 to 2036
Table 166: Australia Hazelnut Market Volume (Tons) Projection, By End-use 2021 to 2036
Table 167: Australia Hazelnut Market Value (USD Billion) Projection, By Distribution Channel 2021 to 2036
Table 168: Australia Hazelnut Market Volume (Tons) Projection, By Distribution Channel 2021 to 2036
Table 169: South Korea Hazelnut Market Value (USD Billion) Projection, By Type 2021 to 2036
Table 170: South Korea Hazelnut Market Volume (Tons) Projection, By Type 2021 to 2036
Table 171: South Korea Hazelnut Market Value (USD Billion) Projection, By Product Form 2021 to 2036
Table 172: South Korea Hazelnut Market Volume (Tons) Projection, By Product Form 2021 to 2036
Table 173: South Korea Hazelnut Market Value (USD Billion) Projection, By Nature 2021 to 2036
Table 174: South Korea Hazelnut Market Volume (Tons) Projection, By Nature 2021 to 2036
Table 175: South Korea Hazelnut Market Value (USD Billion) Projection, By End-use 2021 to 2036
Table 176: South Korea Hazelnut Market Volume (Tons) Projection, By End-use 2021 to 2036
Table 177: South Korea Hazelnut Market Value (USD Billion) Projection, By Distribution Channel 2021 to 2036
Table 178: South Korea Hazelnut Market Volume (Tons) Projection, By Distribution Channel 2021 to 2036
Table 179: ASEAN Hazelnut Market Value (USD Billion) Projection, By Type 2021 to 2036
Table 180: ASEAN Hazelnut Market Volume (Tons) Projection, By Type 2021 to 2036
Table 181: ASEAN Hazelnut Market Value (USD Billion) Projection, By Product Form 2021 to 2036
Table 182: ASEAN Hazelnut Market Volume (Tons) Projection, By Product Form 2021 to 2036
Table 183: ASEAN Hazelnut Market Value (USD Billion) Projection, By Nature 2021 to 2036
Table 184: ASEAN Hazelnut Market Volume (Tons) Projection, By Nature 2021 to 2036
Table 185: ASEAN Hazelnut Market Value (USD Billion) Projection, By End-use 2021 to 2036
Table 186: ASEAN Hazelnut Market Volume (Tons) Projection, By End-use 2021 to 2036
Table 187: ASEAN Hazelnut Market Value (USD Billion) Projection, By Distribution Channel 2021 to 2036
Table 188: ASEAN Hazelnut Market Volume (Tons) Projection, By Distribution Channel 2021 to 2036
Table 189: Middle East & Africa Hazelnut Market Value (USD Billion) Projection, By Type 2021 to 2036
Table 190: Middle East & Africa Hazelnut Market Volume (Tons) Projection, By Type 2021 to 2036
Table 191: Middle East & Africa Hazelnut Market Value (USD Billion) Projection, By Product Form 2021 to 2036
Table 192: Middle East & Africa Hazelnut Market Volume (Tons) Projection, By Product Form 2021 to 2036
Table 193: Middle East & Africa Hazelnut Market Value (USD Billion) Projection, By Nature 2021 to 2036
Table 194: Middle East & Africa Hazelnut Market Volume (Tons) Projection, By Nature 2021 to 2036
Table 195: Middle East & Africa Hazelnut Market Value (USD Billion) Projection, By End-use 2021 to 2036
Table 196: Middle East & Africa Hazelnut Market Volume (Tons) Projection, By End-use 2021 to 2036
Table 197: Middle East & Africa Hazelnut Market Value (USD Billion) Projection, By Distribution Channel 2021 to 2036
Table 198: Middle East & Africa Hazelnut Market Volume (Tons) Projection, By Distribution Channel 2021 to 2036
Table 199: Middle East & Africa Hazelnut Market Value (USD Billion) Projection, By Country 2021 to 2036
Table 200: Middle East & Africa Hazelnut Market Volume (Tons) Projection, By Country 2021 to 2036
Table 201: GCC Countries Hazelnut Market Value (USD Billion) Projection, By Type 2021 to 2036
Table 202: GCC Countries Hazelnut Market Volume (Tons) Projection, By Type 2021 to 2036
Table 203: GCC Countries Hazelnut Market Value (USD Billion) Projection, By Product Form 2021 to 2036
Table 204: GCC Countries Hazelnut Market Volume (Tons) Projection, By Product Form 2021 to 2036
Table 205: GCC Countries Hazelnut Market Value (USD Billion) Projection, By Nature 2021 to 2036
Table 206: GCC Countries Hazelnut Market Volume (Tons) Projection, By Nature 2021 to 2036
Table 207: GCC Countries Hazelnut Market Value (USD Billion) Projection, By End-use 2021 to 2036
Table 208: GCC Countries Hazelnut Market Volume (Tons) Projection, By End-use 2021 to 2036
Table 209: GCC Countries Hazelnut Market Value (USD Billion) Projection, By Distribution Channel 2021 to 2036
Table 210: GCC Countries Hazelnut Market Volume (Tons) Projection, By Distribution Channel 2021 to 2036
Table 211: South Africa Hazelnut Market Value (USD Billion) Projection, By Type 2021 to 2036
Table 212: South Africa Hazelnut Market Volume (Tons) Projection, By Type 2021 to 2036
Table 213: South Africa Hazelnut Market Value (USD Billion) Projection, By Product Form 2021 to 2036
Table 214: South Africa Hazelnut Market Volume (Tons) Projection, By Product Form 2021 to 2036
Table 215: South Africa Hazelnut Market Value (USD Billion) Projection, By Nature 2021 to 2036
Table 216: South Africa Hazelnut Market Volume (Tons) Projection, By Nature 2021 to 2036
Table 217: South Africa Hazelnut Market Value (USD Billion) Projection, By End-use 2021 to 2036
Table 218: South Africa Hazelnut Market Volume (Tons) Projection, By End-use 2021 to 2036
Table 219: South Africa Hazelnut Market Value (USD Billion) Projection, By Distribution Channel 2021 to 2036
Table 220: South Africa Hazelnut Market Volume (Tons) Projection, By Distribution Channel 2021 to 2036
Table 221: Latin America Hazelnut Market Value (USD Billion) Projection, By Type 2021 to 2036
Table 222: Latin America Hazelnut Market Volume (Tons) Projection, By Type 2021 to 2036
Table 223: Latin America Hazelnut Market Value (USD Billion) Projection, By Product Form 2021 to 2036
Table 224: Latin America Hazelnut Market Volume (Tons) Projection, By Product Form 2021 to 2036
Table 225: Latin America Hazelnut Market Value (USD Billion) Projection, By Nature 2021 to 2036
Table 226: Latin America Hazelnut Market Volume (Tons) Projection, By Nature 2021 to 2036
Table 227: Latin America Hazelnut Market Value (USD Billion) Projection, By End-use 2021 to 2036
Table 228: Latin America Hazelnut Market Volume (Tons) Projection, By End-use 2021 to 2036
Table 229: Latin America Hazelnut Market Value (USD Billion) Projection, By Distribution Channel 2021 to 2036
Table 230: Latin America Hazelnut Market Volume (Tons) Projection, By Distribution Channel 2021 to 2036
Table 231: Latin America Hazelnut Market Value (USD Billion) Projection, By Country 2021 to 2036
Table 232: Latin America Hazelnut Market Volume (Tons) Projection, By Country 2021 to 2036
Table 233: Brazil Hazelnut Market Value (USD Billion) Projection, By Type 2021 to 2036
Table 234: Brazil Hazelnut Market Volume (Tons) Projection, By Type 2021 to 2036
Table 235: Brazil Hazelnut Market Value (USD Billion) Projection, By Product Form 2021 to 2036
Table 236: Brazil Hazelnut Market Volume (Tons) Projection, By Product Form 2021 to 2036
Table 237: Brazil Hazelnut Market Value (USD Billion) Projection, By Nature 2021 to 2036
Table 238: Brazil Hazelnut Market Volume (Tons) Projection, By Nature 2021 to 2036
Table 239: Brazil Hazelnut Market Value (USD Billion) Projection, By End-use 2021 to 2036
Table 240: Brazil Hazelnut Market Volume (Tons) Projection, By End-use 2021 to 2036
Table 241: Brazil Hazelnut Market Value (USD Billion) Projection, By Distribution Channel 2021 to 2036
Table 242: Brazil Hazelnut Market Volume (Tons) Projection, By Distribution Channel 2021 to 2036
Table 243: Mexico Hazelnut Market Value (USD Billion) Projection, By Type 2021 to 2036
Table 244: Mexico Hazelnut Market Volume (Tons) Projection, By Type 2021 to 2036
Table 245: Mexico Hazelnut Market Value (USD Billion) Projection, By Product Form 2021 to 2036
Table 246: Mexico Hazelnut Market Volume (Tons) Projection, By Product Form 2021 to 2036
Table 247: Mexico Hazelnut Market Value (USD Billion) Projection, By Nature 2021 to 2036
Table 248: Mexico Hazelnut Market Volume (Tons) Projection, By Nature 2021 to 2036
Table 249: Mexico Hazelnut Market Value (USD Billion) Projection, By End-use 2021 to 2036
Table 250: Mexico Hazelnut Market Volume (Tons) Projection, By End-use 2021 to 2036
Table 251: Mexico Hazelnut Market Value (USD Billion) Projection, By Distribution Channel 2021 to 2036
Table 252: Mexico Hazelnut Market Volume (Tons) Projection, By Distribution Channel 2021 to 2036
Table 253: Argentina Hazelnut Market Value (USD Billion) Projection, By Type 2021 to 2036
Table 254: Argentina Hazelnut Market Volume (Tons) Projection, By Type 2021 to 2036
Table 255: Argentina Hazelnut Market Value (USD Billion) Projection, By Product Form 2021 to 2036
Table 256: Argentina Hazelnut Market Volume (Tons) Projection, By Product Form 2021 to 2036
Table 257: Argentina Hazelnut Market Value (USD Billion) Projection, By Nature 2021 to 2036
Table 258: Argentina Hazelnut Market Volume (Tons) Projection, By Nature 2021 to 2036
Table 259: Argentina Hazelnut Market Value (USD Billion) Projection, By End-use 2021 to 2036
Table 260: Argentina Hazelnut Market Volume (Tons) Projection, By End-use 2021 to 2036
Table 261: Argentina Hazelnut Market Value (USD Billion) Projection, By Distribution Channel 2021 to 2036
Table 262: Argentina Hazelnut Market Volume (Tons) Projection, By Distribution Channel 2021 to 2036
Figure 01: Region Hazelnut Market Value (USD Billion) Projection, By Type 2021 to 2036
Figure 02: Region Hazelnut Market Volume (Tons) Projection, By Type 2021 to 2036
Figure 03: Region Hazelnut Market Incremental Opportunities (USD Billion) Forecast, By Type 2026 to 2036
Figure 04: Region Hazelnut Market Value (USD Billion) Projection, By Product Form 2021 to 2036
Figure 05: Region Hazelnut Market Volume (Tons) Projection, By Product Form 2021 to 2036
Figure 06: Region Hazelnut Market Incremental Opportunities (USD Billion) Forecast, By Product Form 2026 to 2036
Figure 07: Region Hazelnut Market Value (USD Billion) Projection, By Nature 2021 to 2036
Figure 08: Region Hazelnut Market Volume (Tons) Projection, By Nature 2021 to 2036
Figure 09: Region Hazelnut Market Incremental Opportunities (USD Billion) Forecast, By Nature 2026 to 2036
Figure 10: Region Hazelnut Market Value (USD Billion) Projection, By End-use 2021 to 2036
Figure 11: Region Hazelnut Market Volume (Tons) Projection, By End-use 2021 to 2036
Figure 12: Region Hazelnut Market Incremental Opportunities (USD Billion) Forecast, By End-use 2026 to 2036
Figure 13: Region Hazelnut Market Value (USD Billion) Projection, By Distribution Channel 2021 to 2036
Figure 14: Region Hazelnut Market Volume (Tons) Projection, By Distribution Channel 2021 to 2036
Figure 15: Region Hazelnut Market Incremental Opportunities (USD Billion) Forecast, By Distribution Channel 2026 to 2036
Figure 16: Region Hazelnut Market Value (USD Billion) Projection, By Region 2021 to 2036
Figure 17: Region Hazelnut Market Volume (Tons) Projection, By Region 2021 to 2036
Figure 18: Region Hazelnut Market Incremental Opportunities (USD Billion) Forecast, By Region 2026 to 2036
Figure 19: North America Hazelnut Market Value (USD Billion) Projection, By Type 2021 to 2036
Figure 20: North America Hazelnut Market Volume (Tons) Projection, By Type 2021 to 2036
Figure 21: North America Hazelnut Market Incremental Opportunities (USD Billion) Forecast, By Type 2026 to 2036
Figure 22: North America Hazelnut Market Value (USD Billion) Projection, By Product Form 2021 to 2036
Figure 23: North America Hazelnut Market Volume (Tons) Projection, By Product Form 2021 to 2036
Figure 24: North America Hazelnut Market Incremental Opportunities (USD Billion) Forecast, By Product Form 2026 to 2036
Figure 25: North America Hazelnut Market Value (USD Billion) Projection, By Nature 2021 to 2036
Figure 26: North America Hazelnut Market Volume (Tons) Projection, By Nature 2021 to 2036
Figure 27: North America Hazelnut Market Incremental Opportunities (USD Billion) Forecast, By Nature 2026 to 2036
Figure 28: North America Hazelnut Market Value (USD Billion) Projection, By End-use 2021 to 2036
Figure 29: North America Hazelnut Market Volume (Tons) Projection, By End-use 2021 to 2036
Figure 30: North America Hazelnut Market Incremental Opportunities (USD Billion) Forecast, By End-use 2026 to 2036
Figure 31: North America Hazelnut Market Value (USD Billion) Projection, By Distribution Channel 2021 to 2036
Figure 32: North America Hazelnut Market Volume (Tons) Projection, By Distribution Channel 2021 to 2036
Figure 33: North America Hazelnut Market Incremental Opportunities (USD Billion) Forecast, By Distribution Channel 2026 to 2036
Figure 34: North America Hazelnut Market Value (USD Billion) Projection, By Country 2021 to 2036
Figure 35: North America Hazelnut Market Volume (Tons) Projection, By Country 2021 to 2036
Figure 36: North America Hazelnut Market Incremental Opportunities (USD Billion) Forecast, By Country 2026 to 2036
Figure 37: U.S. Hazelnut Market Value (USD Billion) Projection, By Type 2021 to 2036
Figure 38: U.S. Hazelnut Market Volume (Tons) Projection, By Type 2021 to 2036
Figure 39: U.S. Hazelnut Market Incremental Opportunities (USD Billion) Forecast, By Type 2026 to 2036
Figure 40: U.S. Hazelnut Market Value (USD Billion) Projection, By Product Form 2021 to 2036
Figure 41: U.S. Hazelnut Market Volume (Tons) Projection, By Product Form 2021 to 2036
Figure 42: U.S. Hazelnut Market Incremental Opportunities (USD Billion) Forecast, By Product Form 2026 to 2036
Figure 43: U.S. Hazelnut Market Value (USD Billion) Projection, By Nature 2021 to 2036
Figure 44: U.S. Hazelnut Market Volume (Tons) Projection, By Nature 2021 to 2036
Figure 45: U.S. Hazelnut Market Incremental Opportunities (USD Billion) Forecast, By Nature 2026 to 2036
Figure 46: U.S. Hazelnut Market Value (USD Billion) Projection, By End-use 2021 to 2036
Figure 47: U.S. Hazelnut Market Volume (Tons) Projection, By End-use 2021 to 2036
Figure 48: U.S. Hazelnut Market Incremental Opportunities (USD Billion) Forecast, By End-use 2026 to 2036
Figure 49: U.S. Hazelnut Market Value (USD Billion) Projection, By Distribution Channel 2021 to 2036
Figure 50: U.S. Hazelnut Market Volume (Tons) Projection, By Distribution Channel 2021 to 2036
Figure 51: U.S. Hazelnut Market Incremental Opportunities (USD Billion) Forecast, By Distribution Channel 2026 to 2036
Figure 52: Canada Hazelnut Market Value (USD Billion) Projection, By Type 2021 to 2036
Figure 53: Canada Hazelnut Market Volume (Tons) Projection, By Type 2021 to 2036
Figure 54: Canada Hazelnut Market Incremental Opportunities (USD Billion) Forecast, By Type 2026 to 2036
Figure 55: Canada Hazelnut Market Value (USD Billion) Projection, By Product Form 2021 to 2036
Figure 56: Canada Hazelnut Market Volume (Tons) Projection, By Product Form 2021 to 2036
Figure 57: Canada Hazelnut Market Incremental Opportunities (USD Billion) Forecast, By Product Form 2026 to 2036
Figure 58: Canada Hazelnut Market Value (USD Billion) Projection, By Nature 2021 to 2036
Figure 59: Canada Hazelnut Market Volume (Tons) Projection, By Nature 2021 to 2036
Figure 60: Canada Hazelnut Market Incremental Opportunities (USD Billion) Forecast, By Nature 2026 to 2036
Figure 61: Canada Hazelnut Market Value (USD Billion) Projection, By End-use 2021 to 2036
Figure 62: Canada Hazelnut Market Volume (Tons) Projection, By End-use 2021 to 2036
Figure 63: Canada Hazelnut Market Incremental Opportunities (USD Billion) Forecast, By End-use 2026 to 2036
Figure 64: Canada Hazelnut Market Value (USD Billion) Projection, By Distribution Channel 2021 to 2036
Figure 65: Canada Hazelnut Market Volume (Tons) Projection, By Distribution Channel 2021 to 2036
Figure 66: Canada Hazelnut Market Incremental Opportunities (USD Billion) Forecast, By Distribution Channel 2026 to 2036
Figure 67: Europe Hazelnut Market Value (USD Billion) Projection, By Type 2021 to 2036
Figure 68: Europe Hazelnut Market Volume (Tons) Projection, By Type 2021 to 2036
Figure 69: Europe Hazelnut Market Incremental Opportunities (USD Billion) Forecast, By Type 2026 to 2036
Figure 70: Europe Hazelnut Market Value (USD Billion) Projection, By Product Form 2021 to 2036
Figure 71: Europe Hazelnut Market Volume (Tons) Projection, By Product Form 2021 to 2036
Figure 72: Europe Hazelnut Market Incremental Opportunities (USD Billion) Forecast, By Product Form 2026 to 2036
Figure 73: Europe Hazelnut Market Value (USD Billion) Projection, By Nature 2021 to 2036
Figure 74: Europe Hazelnut Market Volume (Tons) Projection, By Nature 2021 to 2036
Figure 75: Europe Hazelnut Market Incremental Opportunities (USD Billion) Forecast, By Nature 2026 to 2036
Figure 76: Europe Hazelnut Market Value (USD Billion) Projection, By End-use 2021 to 2036
Figure 77: Europe Hazelnut Market Volume (Tons) Projection, By End-use 2021 to 2036
Figure 78: Europe Hazelnut Market Incremental Opportunities (USD Billion) Forecast, By End-use 2026 to 2036
Figure 79: Europe Hazelnut Market Value (USD Billion) Projection, By Distribution Channel 2021 to 2036
Figure 80: Europe Hazelnut Market Volume (Tons) Projection, By Distribution Channel 2021 to 2036
Figure 81: Europe Hazelnut Market Incremental Opportunities (USD Billion) Forecast, By Distribution Channel 2026 to 2036
Figure 82: Europe Hazelnut Market Value (USD Billion) Projection, By Country 2021 to 2036
Figure 83: Europe Hazelnut Market Volume (Tons) Projection, By Country 2021 to 2036
Figure 84: Europe Hazelnut Market Incremental Opportunities (USD Billion) Forecast, By Country 2026 to 2036
Figure 85: U.K. Hazelnut Market Value (USD Billion) Projection, By Type 2021 to 2036
Figure 86: U.K. Hazelnut Market Volume (Tons) Projection, By Type 2021 to 2036
Figure 87: U.K. Hazelnut Market Incremental Opportunities (USD Billion) Forecast, By Type 2026 to 2036
Figure 88: U.K. Hazelnut Market Value (USD Billion) Projection, By Product Form 2021 to 2036
Figure 89: U.K. Hazelnut Market Volume (Tons) Projection, By Product Form 2021 to 2036
Figure 90: U.K. Hazelnut Market Incremental Opportunities (USD Billion) Forecast, By Product Form 2026 to 2036
Figure 91: U.K. Hazelnut Market Value (USD Billion) Projection, By Nature 2021 to 2036
Figure 92: U.K. Hazelnut Market Volume (Tons) Projection, By Nature 2021 to 2036
Figure 93: U.K. Hazelnut Market Incremental Opportunities (USD Billion) Forecast, By Nature 2026 to 2036
Figure 94: U.K. Hazelnut Market Value (USD Billion) Projection, By End-use 2021 to 2036
Figure 95: U.K. Hazelnut Market Volume (Tons) Projection, By End-use 2021 to 2036
Figure 96: U.K. Hazelnut Market Incremental Opportunities (USD Billion) Forecast, By End-use 2026 to 2036
Figure 97: U.K. Hazelnut Market Value (USD Billion) Projection, By Distribution Channel 2021 to 2036
Figure 98: U.K. Hazelnut Market Volume (Tons) Projection, By Distribution Channel 2021 to 2036
Figure 99: U.K. Hazelnut Market Incremental Opportunities (USD Billion) Forecast, By Distribution Channel 2026 to 2036
Figure 100: Germany Hazelnut Market Value (USD Billion) Projection, By Type 2021 to 2036
Figure 101: Germany Hazelnut Market Volume (Tons) Projection, By Type 2021 to 2036
Figure 102: Germany Hazelnut Market Incremental Opportunities (USD Billion) Forecast, By Type 2026 to 2036
Figure 103: Germany Hazelnut Market Value (USD Billion) Projection, By Product Form 2021 to 2036
Figure 104: Germany Hazelnut Market Volume (Tons) Projection, By Product Form 2021 to 2036
Figure 105: Germany Hazelnut Market Incremental Opportunities (USD Billion) Forecast, By Product Form 2026 to 2036
Figure 106: Germany Hazelnut Market Value (USD Billion) Projection, By Nature 2021 to 2036
Figure 107: Germany Hazelnut Market Volume (Tons) Projection, By Nature 2021 to 2036
Figure 108: Germany Hazelnut Market Incremental Opportunities (USD Billion) Forecast, By Nature 2026 to 2036
Figure 109: Germany Hazelnut Market Value (USD Billion) Projection, By End-use 2021 to 2036
Figure 110: Germany Hazelnut Market Volume (Tons) Projection, By End-use 2021 to 2036
Figure 111: Germany Hazelnut Market Incremental Opportunities (USD Billion) Forecast, By End-use 2026 to 2036
Figure 112: Germany Hazelnut Market Value (USD Billion) Projection, By Distribution Channel 2021 to 2036
Figure 113: Germany Hazelnut Market Volume (Tons) Projection, By Distribution Channel 2021 to 2036
Figure 114: Germany Hazelnut Market Incremental Opportunities (USD Billion) Forecast, By Distribution Channel 2026 to 2036
Figure 115: France Hazelnut Market Value (USD Billion) Projection, By Type 2021 to 2036
Figure 116: France Hazelnut Market Volume (Tons) Projection, By Type 2021 to 2036
Figure 117: France Hazelnut Market Incremental Opportunities (USD Billion) Forecast, By Type 2026 to 2036
Figure 118: France Hazelnut Market Value (USD Billion) Projection, By Product Form 2021 to 2036
Figure 119: France Hazelnut Market Volume (Tons) Projection, By Product Form 2021 to 2036
Figure 120: France Hazelnut Market Incremental Opportunities (USD Billion) Forecast, By Product Form 2026 to 2036
Figure 121: France Hazelnut Market Value (USD Billion) Projection, By Nature 2021 to 2036
Figure 122: France Hazelnut Market Volume (Tons) Projection, By Nature 2021 to 2036
Figure 123: France Hazelnut Market Incremental Opportunities (USD Billion) Forecast, By Nature 2026 to 2036
Figure 124: France Hazelnut Market Value (USD Billion) Projection, By End-use 2021 to 2036
Figure 125: France Hazelnut Market Volume (Tons) Projection, By End-use 2021 to 2036
Figure 126: France Hazelnut Market Incremental Opportunities (USD Billion) Forecast, By End-use 2026 to 2036
Figure 127: France Hazelnut Market Value (USD Billion) Projection, By Distribution Channel 2021 to 2036
Figure 128: France Hazelnut Market Volume (Tons) Projection, By Distribution Channel 2021 to 2036
Figure 129: France Hazelnut Market Incremental Opportunities (USD Billion) Forecast, By Distribution Channel 2026 to 2036
Figure 130: Italy Hazelnut Market Value (USD Billion) Projection, By Type 2021 to 2036
Figure 131: Italy Hazelnut Market Volume (Tons) Projection, By Type 2021 to 2036
Figure 132: Italy Hazelnut Market Incremental Opportunities (USD Billion) Forecast, By Type 2026 to 2036
Figure 133: Italy Hazelnut Market Value (USD Billion) Projection, By Product Form 2021 to 2036
Figure 134: Italy Hazelnut Market Volume (Tons) Projection, By Product Form 2021 to 2036
Figure 135: Italy Hazelnut Market Incremental Opportunities (USD Billion) Forecast, By Product Form 2026 to 2036
Figure 136: Italy Hazelnut Market Value (USD Billion) Projection, By Nature 2021 to 2036
Figure 137: Italy Hazelnut Market Volume (Tons) Projection, By Nature 2021 to 2036
Figure 138: Italy Hazelnut Market Incremental Opportunities (USD Billion) Forecast, By Nature 2026 to 2036
Figure 139: Italy Hazelnut Market Value (USD Billion) Projection, By End-use 2021 to 2036
Figure 140: Italy Hazelnut Market Volume (Tons) Projection, By End-use 2021 to 2036
Figure 141: Italy Hazelnut Market Incremental Opportunities (USD Billion) Forecast, By End-use 2026 to 2036
Figure 142: Italy Hazelnut Market Value (USD Billion) Projection, By Distribution Channel 2021 to 2036
Figure 143: Italy Hazelnut Market Volume (Tons) Projection, By Distribution Channel 2021 to 2036
Figure 144: Italy Hazelnut Market Incremental Opportunities (USD Billion) Forecast, By Distribution Channel 2026 to 2036
Figure 145: Spain Hazelnut Market Value (USD Billion) Projection, By Type 2021 to 2036
Figure 146: Spain Hazelnut Market Volume (Tons) Projection, By Type 2021 to 2036
Figure 147: Spain Hazelnut Market Incremental Opportunities (USD Billion) Forecast, By Type 2026 to 2036
Figure 148: Spain Hazelnut Market Value (USD Billion) Projection, By Product Form 2021 to 2036
Figure 149: Spain Hazelnut Market Volume (Tons) Projection, By Product Form 2021 to 2036
Figure 150: Spain Hazelnut Market Incremental Opportunities (USD Billion) Forecast, By Product Form 2026 to 2036
Figure 151: Spain Hazelnut Market Value (USD Billion) Projection, By Nature 2021 to 2036
Figure 152: Spain Hazelnut Market Volume (Tons) Projection, By Nature 2021 to 2036
Figure 153: Spain Hazelnut Market Incremental Opportunities (USD Billion) Forecast, By Nature 2026 to 2036
Figure 154: Spain Hazelnut Market Value (USD Billion) Projection, By End-use 2021 to 2036
Figure 155: Spain Hazelnut Market Volume (Tons) Projection, By End-use 2021 to 2036
Figure 156: Spain Hazelnut Market Incremental Opportunities (USD Billion) Forecast, By End-use 2026 to 2036
Figure 157: Spain Hazelnut Market Value (USD Billion) Projection, By Distribution Channel 2021 to 2036
Figure 158: Spain Hazelnut Market Volume (Tons) Projection, By Distribution Channel 2021 to 2036
Figure 159: Spain Hazelnut Market Incremental Opportunities (USD Billion) Forecast, By Distribution Channel 2026 to 2036
Figure 160: The Netherlands Hazelnut Market Value (USD Billion) Projection, By Type 2021 to 2036
Figure 161: The Netherlands Hazelnut Market Volume (Tons) Projection, By Type 2021 to 2036
Figure 162: The Netherlands Hazelnut Market Incremental Opportunities (USD Billion) Forecast, By Type 2026 to 2036
Figure 163: The Netherlands Hazelnut Market Value (USD Billion) Projection, By Product Form 2021 to 2036
Figure 164: The Netherlands Hazelnut Market Volume (Tons) Projection, By Product Form 2021 to 2036
Figure 165: The Netherlands Hazelnut Market Incremental Opportunities (USD Billion) Forecast, By Product Form 2026 to 2036
Figure 166: The Netherlands Hazelnut Market Value (USD Billion) Projection, By Nature 2021 to 2036
Figure 167: The Netherlands Hazelnut Market Volume (Tons) Projection, By Nature 2021 to 2036
Figure 168: The Netherlands Hazelnut Market Incremental Opportunities (USD Billion) Forecast, By Nature 2026 to 2036
Figure 169: The Netherlands Hazelnut Market Value (USD Billion) Projection, By End-use 2021 to 2036
Figure 170: The Netherlands Hazelnut Market Volume (Tons) Projection, By End-use 2021 to 2036
Figure 171: The Netherlands Hazelnut Market Incremental Opportunities (USD Billion) Forecast, By End-use 2026 to 2036
Figure 172: The Netherlands Hazelnut Market Value (USD Billion) Projection, By Distribution Channel 2021 to 2036
Figure 173: The Netherlands Hazelnut Market Volume (Tons) Projection, By Distribution Channel 2021 to 2036
Figure 174: The Netherlands Hazelnut Market Incremental Opportunities (USD Billion) Forecast, By Distribution Channel 2026 to 2036
Figure 175: Asia Pacific Hazelnut Market Value (USD Billion) Projection, By Type 2021 to 2036
Figure 176: Asia Pacific Hazelnut Market Volume (Tons) Projection, By Type 2021 to 2036
Figure 177: Asia Pacific Hazelnut Market Incremental Opportunities (USD Billion) Forecast, By Type 2026 to 2036
Figure 178: Asia Pacific Hazelnut Market Value (USD Billion) Projection, By Product Form 2021 to 2036
Figure 179: Asia Pacific Hazelnut Market Volume (Tons) Projection, By Product Form 2021 to 2036
Figure 180: Asia Pacific Hazelnut Market Incremental Opportunities (USD Billion) Forecast, By Product Form 2026 to 2036
Figure 181: Asia Pacific Hazelnut Market Value (USD Billion) Projection, By Nature 2021 to 2036
Figure 182: Asia Pacific Hazelnut Market Volume (Tons) Projection, By Nature 2021 to 2036
Figure 183: Asia Pacific Hazelnut Market Incremental Opportunities (USD Billion) Forecast, By Nature 2026 to 2036
Figure 184: Asia Pacific Hazelnut Market Value (USD Billion) Projection, By End-use 2021 to 2036
Figure 185: Asia Pacific Hazelnut Market Volume (Tons) Projection, By End-use 2021 to 2036
Figure 186: Asia Pacific Hazelnut Market Incremental Opportunities (USD Billion) Forecast, By End-use 2026 to 2036
Figure 187: Asia Pacific Hazelnut Market Value (USD Billion) Projection, By Distribution Channel 2021 to 2036
Figure 188: Asia Pacific Hazelnut Market Volume (Tons) Projection, By Distribution Channel 2021 to 2036
Figure 189: Asia Pacific Hazelnut Market Incremental Opportunities (USD Billion) Forecast, By Distribution Channel 2026 to 2036
Figure 190: Asia Pacific Hazelnut Market Value (USD Billion) Projection, By Country 2021 to 2036
Figure 191: Asia Pacific Hazelnut Market Volume (Tons) Projection, By Country 2021 to 2036
Figure 192: Asia Pacific Hazelnut Market Incremental Opportunities (USD Billion) Forecast, By Country 2026 to 2036
Figure 193: China Hazelnut Market Value (USD Billion) Projection, By Type 2021 to 2036
Figure 194: China Hazelnut Market Volume (Tons) Projection, By Type 2021 to 2036
Figure 195: China Hazelnut Market Incremental Opportunities (USD Billion) Forecast, By Type 2026 to 2036
Figure 196: China Hazelnut Market Value (USD Billion) Projection, By Product Form 2021 to 2036
Figure 197: China Hazelnut Market Volume (Tons) Projection, By Product Form 2021 to 2036
Figure 198: China Hazelnut Market Incremental Opportunities (USD Billion) Forecast, By Product Form 2026 to 2036
Figure 199: China Hazelnut Market Value (USD Billion) Projection, By Nature 2021 to 2036
Figure 200: China Hazelnut Market Volume (Tons) Projection, By Nature 2021 to 2036
Figure 201: China Hazelnut Market Incremental Opportunities (USD Billion) Forecast, By Nature 2026 to 2036
Figure 202: China Hazelnut Market Value (USD Billion) Projection, By End-use 2021 to 2036
Figure 203: China Hazelnut Market Volume (Tons) Projection, By End-use 2021 to 2036
Figure 204: China Hazelnut Market Incremental Opportunities (USD Billion) Forecast, By End-use 2026 to 2036
Figure 205: China Hazelnut Market Value (USD Billion) Projection, By Distribution Channel 2021 to 2036
Figure 206: China Hazelnut Market Volume (Tons) Projection, By Distribution Channel 2021 to 2036
Figure 207: China Hazelnut Market Incremental Opportunities (USD Billion) Forecast, By Distribution Channel 2026 to 2036
Figure 208: India Hazelnut Market Value (USD Billion) Projection, By Type 2021 to 2036
Figure 209: India Hazelnut Market Volume (Tons) Projection, By Type 2021 to 2036
Figure 210: India Hazelnut Market Incremental Opportunities (USD Billion) Forecast, By Type 2026 to 2036
Figure 211: India Hazelnut Market Value (USD Billion) Projection, By Product Form 2021 to 2036
Figure 212: India Hazelnut Market Volume (Tons) Projection, By Product Form 2021 to 2036
Figure 213: India Hazelnut Market Incremental Opportunities (USD Billion) Forecast, By Product Form 2026 to 2036
Figure 214: India Hazelnut Market Value (USD Billion) Projection, By Nature 2021 to 2036
Figure 215: India Hazelnut Market Volume (Tons) Projection, By Nature 2021 to 2036
Figure 216: India Hazelnut Market Incremental Opportunities (USD Billion) Forecast, By Nature 2026 to 2036
Figure 217: India Hazelnut Market Value (USD Billion) Projection, By End-use 2021 to 2036
Figure 218: India Hazelnut Market Volume (Tons) Projection, By End-use 2021 to 2036
Figure 219: India Hazelnut Market Incremental Opportunities (USD Billion) Forecast, By End-use 2026 to 2036
Figure 220: India Hazelnut Market Value (USD Billion) Projection, By Distribution Channel 2021 to 2036
Figure 221: India Hazelnut Market Volume (Tons) Projection, By Distribution Channel 2021 to 2036
Figure 222: India Hazelnut Market Incremental Opportunities (USD Billion) Forecast, By Distribution Channel 2026 to 2036
Figure 223: Japan Hazelnut Market Value (USD Billion) Projection, By Type 2021 to 2036
Figure 224: Japan Hazelnut Market Volume (Tons) Projection, By Type 2021 to 2036
Figure 225: Japan Hazelnut Market Incremental Opportunities (USD Billion) Forecast, By Type 2026 to 2036
Figure 226: Japan Hazelnut Market Value (USD Billion) Projection, By Product Form 2021 to 2036
Figure 227: Japan Hazelnut Market Volume (Tons) Projection, By Product Form 2021 to 2036
Figure 228: Japan Hazelnut Market Incremental Opportunities (USD Billion) Forecast, By Product Form 2026 to 2036
Figure 229: Japan Hazelnut Market Value (USD Billion) Projection, By Nature 2021 to 2036
Figure 230: Japan Hazelnut Market Volume (Tons) Projection, By Nature 2021 to 2036
Figure 231: Japan Hazelnut Market Incremental Opportunities (USD Billion) Forecast, By Nature 2026 to 2036
Figure 232: Japan Hazelnut Market Value (USD Billion) Projection, By End-use 2021 to 2036
Figure 233: Japan Hazelnut Market Volume (Tons) Projection, By End-use 2021 to 2036
Figure 234: Japan Hazelnut Market Incremental Opportunities (USD Billion) Forecast, By End-use 2026 to 2036
Figure 235: Japan Hazelnut Market Value (USD Billion) Projection, By Distribution Channel 2021 to 2036
Figure 236: Japan Hazelnut Market Volume (Tons) Projection, By Distribution Channel 2021 to 2036
Figure 237: Japan Hazelnut Market Incremental Opportunities (USD Billion) Forecast, By Distribution Channel 2026 to 2036
Figure 238: Australia Hazelnut Market Value (USD Billion) Projection, By Type 2021 to 2036
Figure 239: Australia Hazelnut Market Volume (Tons) Projection, By Type 2021 to 2036
Figure 240: Australia Hazelnut Market Incremental Opportunities (USD Billion) Forecast, By Type 2026 to 2036
Figure 241: Australia Hazelnut Market Value (USD Billion) Projection, By Product Form 2021 to 2036
Figure 242: Australia Hazelnut Market Volume (Tons) Projection, By Product Form 2021 to 2036
Figure 243: Australia Hazelnut Market Incremental Opportunities (USD Billion) Forecast, By Product Form 2026 to 2036
Figure 244: Australia Hazelnut Market Value (USD Billion) Projection, By Nature 2021 to 2036
Figure 245: Australia Hazelnut Market Volume (Tons) Projection, By Nature 2021 to 2036
Figure 246: Australia Hazelnut Market Incremental Opportunities (USD Billion) Forecast, By Nature 2026 to 2036
Figure 247: Australia Hazelnut Market Value (USD Billion) Projection, By End-use 2021 to 2036
Figure 248: Australia Hazelnut Market Volume (Tons) Projection, By End-use 2021 to 2036
Figure 249: Australia Hazelnut Market Incremental Opportunities (USD Billion) Forecast, By End-use 2026 to 2036
Figure 250: Australia Hazelnut Market Value (USD Billion) Projection, By Distribution Channel 2021 to 2036
Figure 251: Australia Hazelnut Market Volume (Tons) Projection, By Distribution Channel 2021 to 2036
Figure 252: Australia Hazelnut Market Incremental Opportunities (USD Billion) Forecast, By Distribution Channel 2026 to 2036
Figure 253: South Korea Hazelnut Market Value (USD Billion) Projection, By Type 2021 to 2036
Figure 254: South Korea Hazelnut Market Volume (Tons) Projection, By Type 2021 to 2036
Figure 255: South Korea Hazelnut Market Incremental Opportunities (USD Billion) Forecast, By Type 2026 to 2036
Figure 256: South Korea Hazelnut Market Value (USD Billion) Projection, By Product Form 2021 to 2036
Figure 257: South Korea Hazelnut Market Volume (Tons) Projection, By Product Form 2021 to 2036
Figure 258: South Korea Hazelnut Market Incremental Opportunities (USD Billion) Forecast, By Product Form 2026 to 2036
Figure 259: South Korea Hazelnut Market Value (USD Billion) Projection, By Nature 2021 to 2036
Figure 260: South Korea Hazelnut Market Volume (Tons) Projection, By Nature 2021 to 2036
Figure 261: South Korea Hazelnut Market Incremental Opportunities (USD Billion) Forecast, By Nature 2026 to 2036
Figure 262: South Korea Hazelnut Market Value (USD Billion) Projection, By End-use 2021 to 2036
Figure 263: South Korea Hazelnut Market Volume (Tons) Projection, By End-use 2021 to 2036
Figure 264: South Korea Hazelnut Market Incremental Opportunities (USD Billion) Forecast, By End-use 2026 to 2036
Figure 265: South Korea Hazelnut Market Value (USD Billion) Projection, By Distribution Channel 2021 to 2036
Figure 266: South Korea Hazelnut Market Volume (Tons) Projection, By Distribution Channel 2021 to 2036
Figure 267: South Korea Hazelnut Market Incremental Opportunities (USD Billion) Forecast, By Distribution Channel 2026 to 2036
Figure 268: ASEAN Hazelnut Market Value (USD Billion) Projection, By Type 2021 to 2036
Figure 269: ASEAN Hazelnut Market Volume (Tons) Projection, By Type 2021 to 2036
Figure 270: ASEAN Hazelnut Market Incremental Opportunities (USD Billion) Forecast, By Type 2026 to 2036
Figure 271: ASEAN Hazelnut Market Value (USD Billion) Projection, By Product Form 2021 to 2036
Figure 272: ASEAN Hazelnut Market Volume (Tons) Projection, By Product Form 2021 to 2036
Figure 273: ASEAN Hazelnut Market Incremental Opportunities (USD Billion) Forecast, By Product Form 2026 to 2036
Figure 274: ASEAN Hazelnut Market Value (USD Billion) Projection, By Nature 2021 to 2036
Figure 275: ASEAN Hazelnut Market Volume (Tons) Projection, By Nature 2021 to 2036
Figure 276: ASEAN Hazelnut Market Incremental Opportunities (USD Billion) Forecast, By Nature 2026 to 2036
Figure 277: ASEAN Hazelnut Market Value (USD Billion) Projection, By End-use 2021 to 2036
Figure 278: ASEAN Hazelnut Market Volume (Tons) Projection, By End-use 2021 to 2036
Figure 279: ASEAN Hazelnut Market Incremental Opportunities (USD Billion) Forecast, By End-use 2026 to 2036
Figure 280: ASEAN Hazelnut Market Value (USD Billion) Projection, By Distribution Channel 2021 to 2036
Figure 281: ASEAN Hazelnut Market Volume (Tons) Projection, By Distribution Channel 2021 to 2036
Figure 282: ASEAN Hazelnut Market Incremental Opportunities (USD Billion) Forecast, By Distribution Channel 2026 to 2036
Figure 283: Middle East & Africa Hazelnut Market Value (USD Billion) Projection, By Type 2021 to 2036
Figure 284: Middle East & Africa Hazelnut Market Volume (Tons) Projection, By Type 2021 to 2036
Figure 285: Middle East & Africa Hazelnut Market Incremental Opportunities (USD Billion) Forecast, By Type 2026 to 2036
Figure 286: Middle East & Africa Hazelnut Market Value (USD Billion) Projection, By Product Form 2021 to 2036
Figure 287: Middle East & Africa Hazelnut Market Volume (Tons) Projection, By Product Form 2021 to 2036
Figure 288: Middle East & Africa Hazelnut Market Incremental Opportunities (USD Billion) Forecast, By Product Form 2026 to 2036
Figure 289: Middle East & Africa Hazelnut Market Value (USD Billion) Projection, By Nature 2021 to 2036
Figure 290: Middle East & Africa Hazelnut Market Volume (Tons) Projection, By Nature 2021 to 2036
Figure 291: Middle East & Africa Hazelnut Market Incremental Opportunities (USD Billion) Forecast, By Nature 2026 to 2036
Figure 292: Middle East & Africa Hazelnut Market Value (USD Billion) Projection, By End-use 2021 to 2036
Figure 293: Middle East & Africa Hazelnut Market Volume (Tons) Projection, By End-use 2021 to 2036
Figure 294: Middle East & Africa Hazelnut Market Incremental Opportunities (USD Billion) Forecast, By End-use 2026 to 2036
Figure 295: Middle East & Africa Hazelnut Market Value (USD Billion) Projection, By Distribution Channel 2021 to 2036
Figure 296: Middle East & Africa Hazelnut Market Volume (Tons) Projection, By Distribution Channel 2021 to 2036
Figure 297: Middle East & Africa Hazelnut Market Incremental Opportunities (USD Billion) Forecast, By Distribution Channel 2026 to 2036
Figure 298: Middle East & Africa Hazelnut Market Value (USD Billion) Projection, By Country 2021 to 2036
Figure 299: Middle East & Africa Hazelnut Market Volume (Tons) Projection, By Country 2021 to 2036
Figure 300: Middle East & Africa Hazelnut Market Incremental Opportunities (USD Billion) Forecast, By Country 2026 to 2036
Figure 301: GCC Countries Hazelnut Market Value (USD Billion) Projection, By Type 2021 to 2036
Figure 302: GCC Countries Hazelnut Market Volume (Tons) Projection, By Type 2021 to 2036
Figure 303: GCC Countries Hazelnut Market Incremental Opportunities (USD Billion) Forecast, By Type 2026 to 2036
Figure 304: GCC Countries Hazelnut Market Value (USD Billion) Projection, By Product Form 2021 to 2036
Figure 305: GCC Countries Hazelnut Market Volume (Tons) Projection, By Product Form 2021 to 2036
Figure 306: GCC Countries Hazelnut Market Incremental Opportunities (USD Billion) Forecast, By Product Form 2026 to 2036
Figure 307: GCC Countries Hazelnut Market Value (USD Billion) Projection, By Nature 2021 to 2036
Figure 308: GCC Countries Hazelnut Market Volume (Tons) Projection, By Nature 2021 to 2036
Figure 309: GCC Countries Hazelnut Market Incremental Opportunities (USD Billion) Forecast, By Nature 2026 to 2036
Figure 310: GCC Countries Hazelnut Market Value (USD Billion) Projection, By End-use 2021 to 2036
Figure 311: GCC Countries Hazelnut Market Volume (Tons) Projection, By End-use 2021 to 2036
Figure 312: GCC Countries Hazelnut Market Incremental Opportunities (USD Billion) Forecast, By End-use 2026 to 2036
Figure 313: GCC Countries Hazelnut Market Value (USD Billion) Projection, By Distribution Channel 2021 to 2036
Figure 314: GCC Countries Hazelnut Market Volume (Tons) Projection, By Distribution Channel 2021 to 2036
Figure 315: GCC Countries Hazelnut Market Incremental Opportunities (USD Billion) Forecast, By Distribution Channel 2026 to 2036
Figure 316: South Africa Hazelnut Market Value (USD Billion) Projection, By Type 2021 to 2036
Figure 317: South Africa Hazelnut Market Volume (Tons) Projection, By Type 2021 to 2036
Figure 318: South Africa Hazelnut Market Incremental Opportunities (USD Billion) Forecast, By Type 2026 to 2036
Figure 319: South Africa Hazelnut Market Value (USD Billion) Projection, By Product Form 2021 to 2036
Figure 320: South Africa Hazelnut Market Volume (Tons) Projection, By Product Form 2021 to 2036
Figure 321: South Africa Hazelnut Market Incremental Opportunities (USD Billion) Forecast, By Product Form 2026 to 2036
Figure 322: South Africa Hazelnut Market Value (USD Billion) Projection, By Nature 2021 to 2036
Figure 323: South Africa Hazelnut Market Volume (Tons) Projection, By Nature 2021 to 2036
Figure 324: South Africa Hazelnut Market Incremental Opportunities (USD Billion) Forecast, By Nature 2026 to 2036
Figure 325: South Africa Hazelnut Market Value (USD Billion) Projection, By End-use 2021 to 2036
Figure 326: South Africa Hazelnut Market Volume (Tons) Projection, By End-use 2021 to 2036
Figure 327: South Africa Hazelnut Market Incremental Opportunities (USD Billion) Forecast, By End-use 2026 to 2036
Figure 328: South Africa Hazelnut Market Value (USD Billion) Projection, By Distribution Channel 2021 to 2036
Figure 329: South Africa Hazelnut Market Volume (Tons) Projection, By Distribution Channel 2021 to 2036
Figure 330: South Africa Hazelnut Market Incremental Opportunities (USD Billion) Forecast, By Distribution Channel 2026 to 2036
Figure 331: Latin America Hazelnut Market Value (USD Billion) Projection, By Type 2021 to 2036
Figure 332: Latin America Hazelnut Market Volume (Tons) Projection, By Type 2021 to 2036
Figure 333: Latin America Hazelnut Market Incremental Opportunities (USD Billion) Forecast, By Type 2026 to 2036
Figure 334: Latin America Hazelnut Market Value (USD Billion) Projection, By Product Form 2021 to 2036
Figure 335: Latin America Hazelnut Market Volume (Tons) Projection, By Product Form 2021 to 2036
Figure 336: Latin America Hazelnut Market Incremental Opportunities (USD Billion) Forecast, By Product Form 2026 to 2036
Figure 337: Latin America Hazelnut Market Value (USD Billion) Projection, By Nature 2021 to 2036
Figure 338: Latin America Hazelnut Market Volume (Tons) Projection, By Nature 2021 to 2036
Figure 339: Latin America Hazelnut Market Incremental Opportunities (USD Billion) Forecast, By Nature 2026 to 2036
Figure 340: Latin America Hazelnut Market Value (USD Billion) Projection, By End-use 2021 to 2036
Figure 341: Latin America Hazelnut Market Volume (Tons) Projection, By End-use 2021 to 2036
Figure 342: Latin America Hazelnut Market Incremental Opportunities (USD Billion) Forecast, By End-use 2026 to 2036
Figure 343: Latin America Hazelnut Market Value (USD Billion) Projection, By Distribution Channel 2021 to 2036
Figure 344: Latin America Hazelnut Market Volume (Tons) Projection, By Distribution Channel 2021 to 2036
Figure 345: Latin America Hazelnut Market Incremental Opportunities (USD Billion) Forecast, By Distribution Channel 2026 to 2036
Figure 346: Latin America Hazelnut Market Value (USD Billion) Projection, By Country 2021 to 2036
Figure 347: Latin America Hazelnut Market Volume (Tons) Projection, By Country 2021 to 2036
Figure 348: Latin America Hazelnut Market Incremental Opportunities (USD Billion) Forecast, By Country 2026 to 2036
Figure 349: Brazil Hazelnut Market Value (USD Billion) Projection, By Type 2021 to 2036
Figure 350: Brazil Hazelnut Market Volume (Tons) Projection, By Type 2021 to 2036
Figure 351: Brazil Hazelnut Market Incremental Opportunities (USD Billion) Forecast, By Type 2026 to 2036
Figure 352: Brazil Hazelnut Market Value (USD Billion) Projection, By Product Form 2021 to 2036
Figure 353: Brazil Hazelnut Market Volume (Tons) Projection, By Product Form 2021 to 2036
Figure 354: Brazil Hazelnut Market Incremental Opportunities (USD Billion) Forecast, By Product Form 2026 to 2036
Figure 355: Brazil Hazelnut Market Value (USD Billion) Projection, By Nature 2021 to 2036
Figure 356: Brazil Hazelnut Market Volume (Tons) Projection, By Nature 2021 to 2036
Figure 357: Brazil Hazelnut Market Incremental Opportunities (USD Billion) Forecast, By Nature 2026 to 2036
Figure 358: Brazil Hazelnut Market Value (USD Billion) Projection, By End-use 2021 to 2036
Figure 359: Brazil Hazelnut Market Volume (Tons) Projection, By End-use 2021 to 2036
Figure 360: Brazil Hazelnut Market Incremental Opportunities (USD Billion) Forecast, By End-use 2026 to 2036
Figure 361: Brazil Hazelnut Market Value (USD Billion) Projection, By Distribution Channel 2021 to 2036
Figure 362: Brazil Hazelnut Market Volume (Tons) Projection, By Distribution Channel 2021 to 2036
Figure 363: Brazil Hazelnut Market Incremental Opportunities (USD Billion) Forecast, By Distribution Channel 2026 to 2036
Figure 364: Mexico Hazelnut Market Value (USD Billion) Projection, By Type 2021 to 2036
Figure 365: Mexico Hazelnut Market Volume (Tons) Projection, By Type 2021 to 2036
Figure 366: Mexico Hazelnut Market Incremental Opportunities (USD Billion) Forecast, By Type 2026 to 2036
Figure 367: Mexico Hazelnut Market Value (USD Billion) Projection, By Product Form 2021 to 2036
Figure 368: Mexico Hazelnut Market Volume (Tons) Projection, By Product Form 2021 to 2036
Figure 369: Mexico Hazelnut Market Incremental Opportunities (USD Billion) Forecast, By Product Form 2026 to 2036
Figure 370: Mexico Hazelnut Market Value (USD Billion) Projection, By Nature 2021 to 2036
Figure 371: Mexico Hazelnut Market Volume (Tons) Projection, By Nature 2021 to 2036
Figure 372: Mexico Hazelnut Market Incremental Opportunities (USD Billion) Forecast, By Nature 2026 to 2036
Figure 373: Mexico Hazelnut Market Value (USD Billion) Projection, By End-use 2021 to 2036
Figure 374: Mexico Hazelnut Market Volume (Tons) Projection, By End-use 2021 to 2036
Figure 375: Mexico Hazelnut Market Incremental Opportunities (USD Billion) Forecast, By End-use 2026 to 2036
Figure 376: Mexico Hazelnut Market Value (USD Billion) Projection, By Distribution Channel 2021 to 2036
Figure 377: Mexico Hazelnut Market Volume (Tons) Projection, By Distribution Channel 2021 to 2036
Figure 378: Mexico Hazelnut Market Incremental Opportunities (USD Billion) Forecast, By Distribution Channel 2026 to 2036
Figure 379: Argentina Hazelnut Market Value (USD Billion) Projection, By Type 2021 to 2036
Figure 380: Argentina Hazelnut Market Volume (Tons) Projection, By Type 2021 to 2036
Figure 381: Argentina Hazelnut Market Incremental Opportunities (USD Billion) Forecast, By Type 2026 to 2036
Figure 382: Argentina Hazelnut Market Value (USD Billion) Projection, By Product Form 2021 to 2036
Figure 383: Argentina Hazelnut Market Volume (Tons) Projection, By Product Form 2021 to 2036
Figure 384: Argentina Hazelnut Market Incremental Opportunities (USD Billion) Forecast, By Product Form 2026 to 2036
Figure 385: Argentina Hazelnut Market Value (USD Billion) Projection, By Nature 2021 to 2036
Figure 386: Argentina Hazelnut Market Volume (Tons) Projection, By Nature 2021 to 2036
Figure 387: Argentina Hazelnut Market Incremental Opportunities (USD Billion) Forecast, By Nature 2026 to 2036
Figure 388: Argentina Hazelnut Market Value (USD Billion) Projection, By End-use 2021 to 2036
Figure 389: Argentina Hazelnut Market Volume (Tons) Projection, By End-use 2021 to 2036
Figure 390: Argentina Hazelnut Market Incremental Opportunities (USD Billion) Forecast, By End-use 2026 to 2036
Figure 391: Argentina Hazelnut Market Value (USD Billion) Projection, By Distribution Channel 2021 to 2036
Figure 392: Argentina Hazelnut Market Volume (Tons) Projection, By Distribution Channel 2021 to 2036
Figure 393: Argentina Hazelnut Market Incremental Opportunities (USD Billion) Forecast, By Distribution Channel 2026 to 2036
Copyright © Transparency Market Research, Inc. All Rights reserved
Trust Online


Hazelnut Market
