
Reports
Reports
Global Hard Luxury Goods Market: Snapshot
The strengthening of global economy is having a great impact on the worldwide market for hard luxury goods. The increasing preferences for front-line and sophisticated products among consumers has fueled the sales of hard luxury goods across the world. Over the forthcoming years, the increasing number of high net-worth individuals in developed countries and the rising disposable income of consumers in emerging nations are likely to reflect positively on this market.
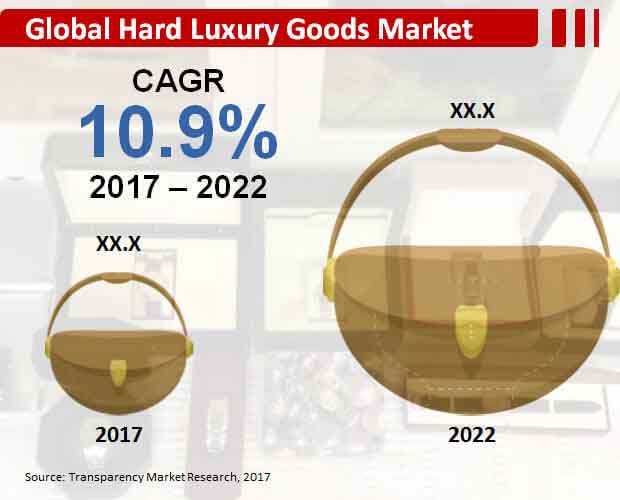
The overall opportunity in the global hard luxury goods market is expected to rise to a whopping sum of US$75.24 bn by 2017. Further, the market is predicted to report a high-paced progression at a CAGR of 10.90% between 2017 and 2022, reaching a massive value of US$126.11 bn by the end of 2022.
Watches to Remain Most Valued Hard Luxury Products
The worldwide market for hard luxury goods is broadly assessed on the basis of the type of the product, sales channel, and the gender of the consumer. Based on the type of the product, the market is segmented into watches and jewelries. Watches are the more prominent revenue contributors among the two. With the segment’s revenue rising at a CAGR of 8.30% between 2017 and 2022, watches are likely to remain the most valued product in the worldwide hard luxury goods market. However, jewelries are also expected to witness a steady increase in their demand over the forthcoming years.
On the basis of the gender, the market is classified into men and women. Women are supposed to be a more lucrative buyer segment for hard luxury goods in comparison to men. Researchers expect this scenario to remain like this over the next few years. By the sales channel, the market is categorized into monobrand stores, specialty stores, department stores, and online stores. Monobrand stores and specialty stores are reporting a higher sales of hard luxury goods than the other two segments and this trend is likely to continue in the years to come.
Europe to Continue Leading Global Hard Luxury Goods Market
Latin America, North America, the Middle East and Africa (MEA), Europe, Asia Pacific (APEJ), and Japan are the prime regional markets for hard luxury goods across the world. Among these, Europe has surfaced as the leading regional market for hard luxury goods, thanks to the presence of key hard luxury goods brands in European countries, such as Germany, France, Switzerland, and Italy. Analysts expect the Europe market for hard luxury goods to retain its position over the next few years with the rising count of duty-free stores. The extremely dense retail network in this region will also boost the Europe market for luxury goods in the near future.
Among others, the APEJ market for hard luxury goods is anticipated to experience a steady rise over the coming years due to the increasing number of newly listed high net-worth individuals and the augmenting disposable income of consumers in this region. This regional market is anticipated to gain 129 BPS in its market share by the end of 2022.
The increasing number of players in the global market for hard luxury goods market is anticipated to intensify the competition within the market over the next few years. Currently, Graff Diamonds Ltd., LVMH, Giorgio Armani, Swatch Group, Richemont, Bulgari, Chanel S.A., Ralph Lauren Corp., Tiffany & Co., and Harry Wintson are leading the market for hard luxury goods across the world.
1. Global Hard Luxury Goods Market - Executive Summary
2. Global Hard Luxury Goods Market Overview
2.1. Introduction
2.1.1. Global Hard Luxury Goods Market Taxonomy
2.1.2. Global Hard Luxury Goods Market Definition
2.2. Global Hard Luxury Goods Market Size (US$ Mn) and Forecast, 2012-2022
2.2.1. Global Hard Luxury Goods Market Y-o-Y Growth
2.3. Global Hard Luxury Goods Market Dynamics
2.4. Supply Chain
2.5. Cost Structure
2.6. Pricing Analysis
2.7. Raw Material Sourcing Strategy and Analysis
2.8. List of Distributors
2.9. Key Participants Market Presence (Intensity Map) By Region
3. Global Hard Luxury Goods Market Analysis and Forecast By Product Type
3.1. Global Hard Luxury Goods Market Size and Forecast By Product Type, 2012-2022
3.1.1. Watches Market Size and Forecast, 2012-2022
3.1.1.1. Revenue (US$ Mn) Comparison, By Region
3.1.1.2. Market Share Comparison, By Region
3.1.1.3. Y-o-Y growth Comparison, By Region
3.1.2. Jewelry Market Size and Forecast, 2012-2022
3.1.2.1. Revenue (US$ Mn) Comparison, By Region
3.1.2.2. Market Share Comparison, By Region
3.1.2.3. Y-o-Y growth Comparison, By Region
4. Global Hard Luxury Goods Market Analysis and Forecast By Gender
4.1. Global Hard Luxury Goods Market Size and Forecast By Gender, 2012-2022
4.1.1. Men Market Size and Forecast, 2012-2022
4.1.1.1. Revenue (US$ Mn) Comparison, By Region
4.1.1.2. Market Share Comparison, By Region
4.1.1.3. Y-o-Y growth Comparison, By Region
4.1.2. Women Market Size and Forecast, 2012-2022
4.1.2.1. Revenue (US$ Mn) Comparison, By Region
4.1.2.2. Market Share Comparison, By Region
4.1.2.3. Y-o-Y growth Comparison, By Region
5. Global Hard Luxury Goods Market Analysis and Forecast By Sales Channel
5.1. Global Hard Luxury Goods Market Size and Forecast By Sales Channel, 2012-2022
5.1.1. Monobrand Store Market Size and Forecast, 2012-2022
5.1.1.1. Revenue (US$ Mn) Comparison, By Region
5.1.1.2. Market Share Comparison, By Region
5.1.1.3. Y-o-Y growth Comparison, By Region
5.1.2. Department Store Market Size and Forecast, 2012-2022
5.1.2.1. Revenue (US$ Mn) Comparison, By Region
5.1.2.2. Market Share Comparison, By Region
5.1.2.3. Y-o-Y growth Comparison, By Region
5.1.3. Specialty Store Market Size and Forecast, 2012-2022
5.1.3.1. Revenue (US$ Mn) Comparison, By Region
5.1.3.2. Market Share Comparison, By Region
5.1.3.3. Y-o-Y growth Comparison, By Region
5.1.4. Online Store Market Size and Forecast, 2012-2022
5.1.4.1. Revenue (US$ Mn) Comparison, By Region
5.1.4.2. Market Share Comparison, By Region
5.1.4.3. Y-o-Y growth Comparison, By Region
5.1.5. Others Market Size and Forecast, 2012-2022
5.1.5.1. Revenue (US$ Mn) Comparison, By Region
5.1.5.2. Market Share Comparison, By Region
5.1.5.3. Y-o-Y growth Comparison, By Region
6. Global Hard Luxury Goods Market Analysis and Forecast By Region
6.1. Global Hard Luxury Goods Market Size and Forecast, 2012-2022
6.1.1. North America Hard Luxury Goods Market Size and Forecast, 2012-2022
6.1.1.1. Revenue (US$ Mn) Comparison, By Product Type
6.1.1.2. Revenue (US$ Mn) Comparison, By Gender
6.1.1.3. Revenue (US$ Mn) Comparison, By Sales Channel
6.1.2. Latin America Hard Luxury Goods Market Size and Forecast, 2012-2022
6.1.2.1. Revenue (US$ Mn) Comparison, By Product Type
6.1.2.2. Revenue (US$ Mn) Comparison, By Gender
6.1.2.3. Revenue (US$ Mn) Comparison, By Sales Channel
6.1.3. Europe Hard Luxury Goods Market Size and Forecast, 2012-2022
6.1.3.1. Revenue (US$ Mn) Comparison, By Product Type
6.1.3.2. Revenue (US$ Mn) Comparison, By Gender
6.1.3.3. Revenue (US$ Mn) Comparison, By Sales Channel
6.1.4. Japan Hard Luxury Goods Market Size and Forecast, 2012-2022
6.1.4.1. Revenue (US$ Mn) Comparison, By Product Type
6.1.4.2. Revenue (US$ Mn) Comparison, By Gender
6.1.4.3. Revenue (US$ Mn) Comparison, By Sales Channel
6.1.5. APEJ Hard Luxury Goods Market Size and Forecast, 2012-2022
6.1.5.1. Revenue (US$ Mn) Comparison, By Product Type
6.1.5.2. Revenue (US$ Mn) Comparison, By Gender
6.1.5.3. Revenue (US$ Mn) Comparison, By Sales Channel
6.1.6. MEA Hard Luxury Goods Market Size and Forecast, 2012-2022
6.1.6.1. Revenue (US$ Mn) Comparison, By Product Type
6.1.6.2. Revenue (US$ Mn) Comparison, By Gender
6.1.6.3. Revenue (US$ Mn) Comparison, By Sales Channel
7. North America Hard Luxury Goods Market Analysis and Forecast, By Country, 2012-2022
7.1. US Hard Luxury Goods Market Size and Forecast, 2012-2022
7.1.1. Revenue (US$ Mn) Comparison, By Product Type
7.1.2. Revenue (US$ Mn) Comparison, By Gender
7.1.3. Revenue (US$ Mn) Comparison, By Sales Channel
7.2. Canada Hard Luxury Goods Market Size and Forecast, 2012-2022
7.2.1. Revenue (US$ Mn) Comparison, By Product Type
7.2.2. Revenue (US$ Mn) Comparison, By Gender
7.2.3. Revenue (US$ Mn) Comparison, By Sales Channel
8. Latin America Hard Luxury Goods Market Analysis and Forecast, By Country, 2012-2022
8.1. Brazil Hard Luxury Goods Market Size and Forecast, 2012-2022
8.1.1. Revenue (US$ Mn) Comparison, By Product Type
8.1.2. Revenue (US$ Mn) Comparison, By Gender
8.1.3. Revenue (US$ Mn) Comparison, By Sales Channel
8.2. Mexico Hard Luxury Goods Market Size and Forecast, 2012-2022
8.2.1. Revenue (US$ Mn) Comparison, By Product Type
8.2.2. Revenue (US$ Mn) Comparison, By Gender
8.2.3. Revenue (US$ Mn) Comparison, By Sales Channel
8.3. Argentina Hard Luxury Goods Market Size and Forecast, 2012-2022
8.3.1. Revenue (US$ Mn) Comparison, By Product Type
8.3.2. Revenue (US$ Mn) Comparison, By Gender
8.3.3. Revenue (US$ Mn) Comparison, By Sales Channel
9. Europe Hard Luxury Goods Market Analysis and Forecast, By Country, 2012-2022
9.1. Germany Hard Luxury Goods Market Size and Forecast, 2012-2022
9.1.1. Revenue (US$ Mn) Comparison, By Product Type
9.1.2. Revenue (US$ Mn) Comparison, By Gender
9.1.3. Revenue (US$ Mn) Comparison, By Sales Channel
9.2. UK Hard Luxury Goods Market Size and Forecast, 2012-2022
9.2.1. Revenue (US$ Mn) Comparison, By Product Type
9.2.2. Revenue (US$ Mn) Comparison, By Gender
9.2.3. Revenue (US$ Mn) Comparison, By Sales Channel
9.3. France Hard Luxury Goods Market Size and Forecast, 2012-2022
9.3.1. Revenue (US$ Mn) Comparison, By Product Type
9.3.2. Revenue (US$ Mn) Comparison, By Gender
9.3.3. Revenue (US$ Mn) Comparison, By Sales Channel
9.4. Spain Hard Luxury Goods Market Size and Forecast, 2012-2022
9.4.1. Revenue (US$ Mn) Comparison, By Product Type
9.4.2. Revenue (US$ Mn) Comparison, By Gender
9.4.3. Revenue (US$ Mn) Comparison, By Sales Channel
9.5. Italy Hard Luxury Goods Market Size and Forecast, 2012-2022
9.5.1. Revenue (US$ Mn) Comparison, By Product Type
9.5.2. Revenue (US$ Mn) Comparison, By Gender
9.5.3. Revenue (US$ Mn) Comparison, By Sales Channel
9.6. Nordic Hard Luxury Goods Market Size and Forecast, 2012-2022
9.6.1. Revenue (US$ Mn) Comparison, By Product Type
9.6.2. Revenue (US$ Mn) Comparison, By Gender
9.6.3. Revenue (US$ Mn) Comparison, By Sales Channel
10. Japan Hard Luxury Goods Market Analysis and Forecast, By Country, 2012-2022
10.1. Japan Hard Luxury Goods Market Size and Forecast, 2012-2022
10.1.1. Revenue (US$ Mn) Comparison, By Product Type
10.1.2. Revenue (US$ Mn) Comparison, By Gender
10.1.3. Revenue (US$ Mn) Comparison, By Sales Channel
11. APEJ Hard Luxury Goods Market Analysis and Forecast, By Country, 2012-2022
11.1. China Hard Luxury Goods Market Size and Forecast, 2012-2022
11.1.1. Revenue (US$ Mn) Comparison, By Product Type
11.1.2. Revenue (US$ Mn) Comparison, By Gender
11.1.3. Revenue (US$ Mn) Comparison, By Sales Channel
11.2. India Hard Luxury Goods Market Size and Forecast, 2012-2022
11.2.1. Revenue (US$ Mn) Comparison, By Product Type
11.2.2. Revenue (US$ Mn) Comparison, By Gender
11.2.3. Revenue (US$ Mn) Comparison, By Sales Channel
11.3. Malaysia Hard Luxury Goods Market Size and Forecast, 2012-2022
11.3.1. Revenue (US$ Mn) Comparison, By Product Type
11.3.2. Revenue (US$ Mn) Comparison, By Gender
11.3.3. Revenue (US$ Mn) Comparison, By Sales Channel
11.4. Thailand Hard Luxury Goods Market Size and Forecast, 2012-2022
11.4.1. Revenue (US$ Mn) Comparison, By Product Type
11.4.2. Revenue (US$ Mn) Comparison, By Gender
11.4.3. Revenue (US$ Mn) Comparison, By Sales Channel
11.5. Singapore Hard Luxury Goods Market Size and Forecast, 2012-2022
11.5.1. Revenue (US$ Mn) Comparison, By Product Type
11.5.2. Revenue (US$ Mn) Comparison, By Gender
11.5.3. Revenue (US$ Mn) Comparison, By Sales Channel
11.6. Australia Hard Luxury Goods Market Size and Forecast, 2012-2022
11.6.1. Revenue (US$ Mn) Comparison, By Product Type
11.6.2. Revenue (US$ Mn) Comparison, By Gender
11.6.3. Revenue (US$ Mn) Comparison, By Sales Channel
12. MEA Hard Luxury Goods Market Analysis and Forecast, By Country, 2012-2022
12.1. GCC Countries Hard Luxury Goods Market Size and Forecast, 2012-2022
12.1.1. Revenue (US$ Mn) Comparison, By Product Type
12.1.2. Revenue (US$ Mn) Comparison, By Gender
12.1.3. Revenue (US$ Mn) Comparison, By Sales Channel
12.2. South Africa Hard Luxury Goods Market Size and Forecast, 2012-2022
12.2.1. Revenue (US$ Mn) Comparison, By Product Type
12.2.2. Revenue (US$ Mn) Comparison, By Gender
12.2.3. Revenue (US$ Mn) Comparison, By Sales Channel
12.3. Nigeria Hard Luxury Goods Market Size and Forecast, 2012-2022
12.3.1. Revenue (US$ Mn) Comparison, By Product Type
12.3.2. Revenue (US$ Mn) Comparison, By Gender
12.3.3. Revenue (US$ Mn) Comparison, By Sales Channel
12.4. Israel Hard Luxury Goods Market Size and Forecast, 2012-2022
12.4.1. Revenue (US$ Mn) Comparison, By Product Type
12.4.2. Revenue (US$ Mn) Comparison, By Gender
12.4.3. Revenue (US$ Mn) Comparison, By Sales Channel
13. Global Hard Luxury Goods Market Company Share, Competition Landscape and Company Profiles
13.1. Company Share Analysis
13.2. Competition Landscape
13.3. Company Profiles
13.3.1. Bulgari
13.3.2. LVMH
13.3.3. Richemont
13.3.4. Swatch Group
13.3.5. Chanel S.A.
13.3.6. Tiffany & Company
13.3.7. Harry Wintson
13.3.8. Ralph Lauren Corporation
13.3.9. Giorgio Armani
13.3.10. Graff Diamonds Ltd
14. Research Methodology
15. Secondary and Primary Sources
16. Assumptions and Acronyms
17. Disclaimer
List of Tables
TABLE 1 Global Hard Luxury Goods Market Value (US$ Mn), 2012-2016
TABLE 2 Global Hard Luxury Goods Market Value (US$ Mn), 2017-2022
TABLE 3 Global Hard Luxury Goods Market Value (US$ Mn) and Y-o-Y, 2015-2022
TABLE 4 Global Watches Segment Value (US$ Mn), By Region 2012-2016
TABLE 5 Global Watches Segment Value (US$ Mn), By Region 2017-2022
TABLE 6 Global Watches Segment Market Share, By Region 2012-2016
TABLE 7 Global Watches Segment Market Share, By Region 2017-2022
TABLE 8 Global Watches Segment Y-o-Y, By Region 2015-2022
TABLE 9 Global Jewelry Segment Value (US$ Mn), By Region 2012-2016
TABLE 10 Global Jewelry Segment Value (US$ Mn), By Region 2017-2022
TABLE 11 Global Jewelry Segment Market Share, By Region 2012-2016
TABLE 12 Global Jewelry Segment Market Share, By Region 2017-2022
TABLE 13 Global Jewelry Segment Y-o-Y, By Region 2015-2022
TABLE 14 Global Men Segment Value (US$ Mn), By Region 2012-2016
TABLE 15 Global Men Segment Value (US$ Mn), By Region 2017-2022
TABLE 16 Global Men Segment Market Share, By Region 2012-2016
TABLE 17 Global Men Segment Market Share, By Region 2017-2022
TABLE 18 Global Men Segment Y-o-Y, By Region 2015-2022
TABLE 19 Global Women Segment Value (US$ Mn), By Region 2012-2016
TABLE 20 Global Women Segment Value (US$ Mn), By Region 2017-2022
TABLE 21 Global Women Segment Market Share, By Region 2012-2016
TABLE 22 Global Women Segment Market Share, By Region 2017-2022
TABLE 23 Global Women Segment Y-o-Y, By Region 2015-2022
TABLE 24 Global Monobrand Store Segment Value (US$ Mn), By Region 2012-2016
TABLE 25 Global Monobrand Store Segment Value (US$ Mn), By Region 2017-2022
TABLE 26 Global Monobrand Store Segment Market Share, By Region 2012-2016
TABLE 27 Global Monobrand Store Segment Market Share, By Region 2017-2022
TABLE 28 Global Monobrand Store Segment Y-o-Y, By Region 2015-2022
TABLE 29 Global Department Store Segment Value (US$ Mn), By Region 2012-2016
TABLE 30 Global Department Store Segment Value (US$ Mn), By Region 2017-2022
TABLE 31 Global Department Store Segment Market Share, By Region 2012-2016
TABLE 32 Global Department Store Segment Market Share, By Region 2017-2022
TABLE 33 Global Department Store Segment Y-o-Y, By Region 2015-2022
TABLE 34 Global Specialty Store Segment Value (US$ Mn), By Region 2012-2016
TABLE 35 Global Specialty Store Segment Value (US$ Mn), By Region 2017-2022
TABLE 36 Global Specialty Store Segment Market Share, By Region 2012-2016
TABLE 37 Global Specialty Store Segment Market Share, By Region 2017-2022
TABLE 38 Global Specialty Store Segment Y-o-Y, By Region 2015-2022
TABLE 39 Global Online Store Segment Value (US$ Mn), By Region 2012-2016
TABLE 40 Global Online Store Segment Value (US$ Mn), By Region 2017-2022
TABLE 41 Global Online Store Segment Market Share, By Region 2012-2016
TABLE 42 Global Online Store Segment Market Share, By Region 2017-2022
TABLE 43 Global Online Store Segment Y-o-Y, By Region 2015-2022
TABLE 44 Global Others Segment Value (US$ Mn), By Region 2012-2016
TABLE 45 Global Others Segment Value (US$ Mn), By Region 2017-2022
TABLE 46 Global Others Segment Market Share, By Region 2012-2016
TABLE 47 Global Others Segment Market Share, By Region 2017-2022
TABLE 48 Global Others Segment Y-o-Y, By Region 2015-2022
TABLE 49 North America Hard Luxury Goods Market Value (US$ Mn), By Product Type 2012-2016
TABLE 50 North America Hard Luxury Goods Market Value (US$ Mn), By Product Type 2017-2022
TABLE 51 North America Hard Luxury Goods Market Value (US$ Mn), By Gender 2012-2016
TABLE 52 North America Hard Luxury Goods Market Value (US$ Mn), By Gender 2017-2022
TABLE 53 North America Hard Luxury Goods Market Value (US$ Mn), By Sales Channel 2012-2016
TABLE 54 North America Hard Luxury Goods Market Value (US$ Mn), By Sales Channel 2017-2022
TABLE 55 Latin America Hard Luxury Goods Market Value (US$ Mn), By Product Type 2012-2016
TABLE 56 Latin America Hard Luxury Goods Market Value (US$ Mn), By Product Type 2017-2022
TABLE 57 Latin America Hard Luxury Goods Market Value (US$ Mn), By Gender 2012-2016
TABLE 58 Latin America Hard Luxury Goods Market Value (US$ Mn), By Gender 2017-2022
TABLE 59 Latin America Hard Luxury Goods Market Value (US$ Mn), By Sales Channel 2012-2016
TABLE 60 Latin America Hard Luxury Goods Market Value (US$ Mn), By Sales Channel 2017-2022
TABLE 61 Europe Hard Luxury Goods Market Value (US$ Mn), By Product Type 2012-2016
TABLE 62 Europe Hard Luxury Goods Market Value (US$ Mn), By Product Type 2017-2022
TABLE 63 Europe Hard Luxury Goods Market Value (US$ Mn), By Gender 2012-2016
TABLE 64 Europe Hard Luxury Goods Market Value (US$ Mn), By Gender 2017-2022
TABLE 65 Europe Hard Luxury Goods Market Value (US$ Mn), By Sales Channel 2012-2016
TABLE 66 Europe Hard Luxury Goods Market Value (US$ Mn), By Sales Channel 2017-2022
TABLE 67 Japan Hard Luxury Goods Market Value (US$ Mn), By Product Type 2012-2016
TABLE 68 Japan Hard Luxury Goods Market Value (US$ Mn), By Product Type 2017-2022
TABLE 69 Japan Hard Luxury Goods Market Value (US$ Mn), By Gender 2012-2016
TABLE 70 Japan Hard Luxury Goods Market Value (US$ Mn), By Gender 2017-2022
TABLE 71 Japan Hard Luxury Goods Market Value (US$ Mn), By Sales Channel 2012-2016
TABLE 72 Japan Hard Luxury Goods Market Value (US$ Mn), By Sales Channel 2017-2022
TABLE 73 APEJ Hard Luxury Goods Market Value (US$ Mn), By Product Type 2012-2016
TABLE 74 APEJ Hard Luxury Goods Market Value (US$ Mn), By Product Type 2017-2022
TABLE 75 APEJ Hard Luxury Goods Market Value (US$ Mn), By Gender 2012-2016
TABLE 76 APEJ Hard Luxury Goods Market Value (US$ Mn), By Gender 2017-2022
TABLE 77 APEJ Hard Luxury Goods Market Value (US$ Mn), By Sales Channel 2012-2016
TABLE 78 APEJ Hard Luxury Goods Market Value (US$ Mn), By Sales Channel 2017-2022
TABLE 79 MEA Hard Luxury Goods Market Value (US$ Mn), By Product Type 2012-2016
TABLE 80 MEA Hard Luxury Goods Market Value (US$ Mn), By Product Type 2017-2022
TABLE 81 MEA Hard Luxury Goods Market Value (US$ Mn), By Gender 2012-2016
TABLE 82 MEA Hard Luxury Goods Market Value (US$ Mn), By Gender 2017-2022
TABLE 83 MEA Hard Luxury Goods Market Value (US$ Mn), By Sales Channel 2012-2016
TABLE 84 MEA Hard Luxury Goods Market Value (US$ Mn), By Sales Channel 2017-2022
TABLE 85 US Hard Luxury Goods Market Value (US$ Mn), By Product Type 2012-2016
TABLE 86 US Hard Luxury Goods Market Value (US$ Mn), By Product Type 2017-2022
TABLE 87 US Hard Luxury Goods Market Value (US$ Mn), By Gender 2012-2016
TABLE 88 US Hard Luxury Goods Market Value (US$ Mn), By Gender 2017-2022
TABLE 89 US Hard Luxury Goods Market Value (US$ Mn), By Sales Channel 2012-2016
TABLE 90 US Hard Luxury Goods Market Value (US$ Mn), By Sales Channel 2017-2022
TABLE 91 Canada Hard Luxury Goods Market Value (US$ Mn), By Product Type 2012-2016
TABLE 92 Canada Hard Luxury Goods Market Value (US$ Mn), By Product Type 2017-2022
TABLE 93 Canada Hard Luxury Goods Market Value (US$ Mn), By Gender 2012-2016
TABLE 94 Canada Hard Luxury Goods Market Value (US$ Mn), By Gender 2017-2022
TABLE 95 Canada Hard Luxury Goods Market Value (US$ Mn), By Sales Channel 2012-2016
TABLE 96 Canada Hard Luxury Goods Market Value (US$ Mn), By Sales Channel 2017-2022
TABLE 97 Brazil Hard Luxury Goods Market Value (US$ Mn), By Product Type 2012-2016
TABLE 98 Brazil Hard Luxury Goods Market Value (US$ Mn), By Product Type 2017-2022
TABLE 99 Brazil Hard Luxury Goods Market Value (US$ Mn), By Gender 2012-2016
TABLE 100 Brazil Hard Luxury Goods Market Value (US$ Mn), By Gender 2017-2022
TABLE 101 Brazil Hard Luxury Goods Market Value (US$ Mn), By Sales Channel 2012-2016
TABLE 102 Brazil Hard Luxury Goods Market Value (US$ Mn), By Sales Channel 2017-2022
TABLE 103 Mexico Hard Luxury Goods Market Value (US$ Mn), By Product Type 2012-2016
TABLE 104 Mexico Hard Luxury Goods Market Value (US$ Mn), By Product Type 2017-2022
TABLE 105 Mexico Hard Luxury Goods Market Value (US$ Mn), By Gender 2012-2016
TABLE 106 Mexico Hard Luxury Goods Market Value (US$ Mn), By Gender 2017-2022
TABLE 107 Mexico Hard Luxury Goods Market Value (US$ Mn), By Sales Channel 2012-2016
TABLE 108 Mexico Hard Luxury Goods Market Value (US$ Mn), By Sales Channel 2017-2022
TABLE 109 Argentina Hard Luxury Goods Market Value (US$ Mn), By Product Type 2012-2016
TABLE 110 Argentina Hard Luxury Goods Market Value (US$ Mn), By Product Type 2017-2022
TABLE 111 Argentina Hard Luxury Goods Market Value (US$ Mn), By Gender 2012-2016
TABLE 112 Argentina Hard Luxury Goods Market Value (US$ Mn), By Gender 2017-2022
TABLE 113 Argentina Hard Luxury Goods Market Value (US$ Mn), By Sales Channel 2012-2016
TABLE 114 Argentina Hard Luxury Goods Market Value (US$ Mn), By Sales Channel 2017-2022
TABLE 115 Germany Hard Luxury Goods Market Value (US$ Mn), By Product Type 2012-2016
TABLE 116 Germany Hard Luxury Goods Market Value (US$ Mn), By Product Type 2017-2022
TABLE 117 Germany Hard Luxury Goods Market Value (US$ Mn), By Gender 2012-2016
TABLE 118 Germany Hard Luxury Goods Market Value (US$ Mn), By Gender 2017-2022
TABLE 119 Germany Hard Luxury Goods Market Value (US$ Mn), By Sales Channel 2012-2016
TABLE 120 Germany Hard Luxury Goods Market Value (US$ Mn), By Sales Channel 2017-2022
TABLE 121 UK Hard Luxury Goods Market Value (US$ Mn), By Product Type 2012-2016
TABLE 122 UK Hard Luxury Goods Market Value (US$ Mn), By Product Type 2017-2022
TABLE 123 UK Hard Luxury Goods Market Value (US$ Mn), By Gender 2012-2016
TABLE 124 UK Hard Luxury Goods Market Value (US$ Mn), By Gender 2017-2022
TABLE 125 UK Hard Luxury Goods Market Value (US$ Mn), By Sales Channel 2012-2016
TABLE 126 UK Hard Luxury Goods Market Value (US$ Mn), By Sales Channel 2017-2022
TABLE 127 France Hard Luxury Goods Market Value (US$ Mn), By Product Type 2012-2016
TABLE 128 France Hard Luxury Goods Market Value (US$ Mn), By Product Type 2017-2022
TABLE 129 France Hard Luxury Goods Market Value (US$ Mn), By Gender 2012-2016
TABLE 130 France Hard Luxury Goods Market Value (US$ Mn), By Gender 2017-2022
TABLE 131 France Hard Luxury Goods Market Value (US$ Mn), By Sales Channel 2012-2016
TABLE 132 France Hard Luxury Goods Market Value (US$ Mn), By Sales Channel 2017-2022
TABLE 133 Spain Hard Luxury Goods Market Value (US$ Mn), By Product Type 2012-2016
TABLE 134 Spain Hard Luxury Goods Market Value (US$ Mn), By Product Type 2017-2022
TABLE 135 Spain Hard Luxury Goods Market Value (US$ Mn), By Gender 2012-2016
TABLE 136 Spain Hard Luxury Goods Market Value (US$ Mn), By Gender 2017-2022
TABLE 137 Spain Hard Luxury Goods Market Value (US$ Mn), By Sales Channel 2012-2016
TABLE 138 Spain Hard Luxury Goods Market Value (US$ Mn), By Sales Channel 2017-2022
TABLE 139 Italy Hard Luxury Goods Market Value (US$ Mn), By Product Type 2012-2016
TABLE 140 Italy Hard Luxury Goods Market Value (US$ Mn), By Product Type 2017-2022
TABLE 141 Italy Hard Luxury Goods Market Value (US$ Mn), By Gender 2012-2016
TABLE 142 Italy Hard Luxury Goods Market Value (US$ Mn), By Gender 2017-2022
TABLE 143 Italy Hard Luxury Goods Market Value (US$ Mn), By Sales Channel 2012-2016
TABLE 144 Italy Hard Luxury Goods Market Value (US$ Mn), By Sales Channel 2017-2022
TABLE 145 Nordic Hard Luxury Goods Market Value (US$ Mn), By Product Type 2012-2016
TABLE 146 Nordic Hard Luxury Goods Market Value (US$ Mn), By Product Type 2017-2022
TABLE 147 Nordic Hard Luxury Goods Market Value (US$ Mn), By Gender 2012-2016
TABLE 148 Nordic Hard Luxury Goods Market Value (US$ Mn), By Gender 2017-2022
TABLE 149 Nordic Hard Luxury Goods Market Value (US$ Mn), By Sales Channel 2012-2016
TABLE 150 Nordic Hard Luxury Goods Market Value (US$ Mn), By Sales Channel 2017-2022
TABLE 151 Japan Hard Luxury Goods Market Value (US$ Mn), By Product Type 2012-2016
TABLE 152 Japan Hard Luxury Goods Market Value (US$ Mn), By Product Type 2017-2022
TABLE 153 Japan Hard Luxury Goods Market Value (US$ Mn), By Gender 2012-2016
TABLE 154 Japan Hard Luxury Goods Market Value (US$ Mn), By Gender 2017-2022
TABLE 155 Japan Hard Luxury Goods Market Value (US$ Mn), By Sales Channel 2012-2016
TABLE 156 Japan Hard Luxury Goods Market Value (US$ Mn), By Sales Channel 2017-2022
TABLE 157 China Hard Luxury Goods Market Value (US$ Mn), By Product Type 2012-2016
TABLE 158 China Hard Luxury Goods Market Value (US$ Mn), By Product Type 2017-2022
TABLE 159 China Hard Luxury Goods Market Value (US$ Mn), By Gender 2012-2016
TABLE 160 China Hard Luxury Goods Market Value (US$ Mn), By Gender 2017-2022
TABLE 161 China Hard Luxury Goods Market Value (US$ Mn), By Sales Channel 2012-2016
TABLE 162 China Hard Luxury Goods Market Value (US$ Mn), By Sales Channel 2017-2022
TABLE 163 India Hard Luxury Goods Market Value (US$ Mn), By Product Type 2012-2016
TABLE 164 India Hard Luxury Goods Market Value (US$ Mn), By Product Type 2017-2022
TABLE 165 India Hard Luxury Goods Market Value (US$ Mn), By Gender 2012-2016
TABLE 166 India Hard Luxury Goods Market Value (US$ Mn), By Gender 2017-2022
TABLE 167 India Hard Luxury Goods Market Value (US$ Mn), By Sales Channel 2012-2016
TABLE 168 India Hard Luxury Goods Market Value (US$ Mn), By Sales Channel 2017-2022
TABLE 169 Malaysia Hard Luxury Goods Market Value (US$ Mn), By Product Type 2012-2016
TABLE 170 Malaysia Hard Luxury Goods Market Value (US$ Mn), By Product Type 2017-2022
TABLE 171 Malaysia Hard Luxury Goods Market Value (US$ Mn), By Gender 2012-2016
TABLE 172 Malaysia Hard Luxury Goods Market Value (US$ Mn), By Gender 2017-2022
TABLE 173 Malaysia Hard Luxury Goods Market Value (US$ Mn), By Sales Channel 2012-2016
TABLE 174 Malaysia Hard Luxury Goods Market Value (US$ Mn), By Sales Channel 2017-2022
TABLE 175 Thailand Hard Luxury Goods Market Value (US$ Mn), By Product Type 2012-2016
TABLE 176 Thailand Hard Luxury Goods Market Value (US$ Mn), By Product Type 2017-2022
TABLE 177 Thailand Hard Luxury Goods Market Value (US$ Mn), By Gender 2012-2016
TABLE 178 Thailand Hard Luxury Goods Market Value (US$ Mn), By Gender 2017-2022
TABLE 179 Thailand Hard Luxury Goods Market Value (US$ Mn), By Sales Channel 2012-2016
TABLE 180 Thailand Hard Luxury Goods Market Value (US$ Mn), By Sales Channel 2017-2022
TABLE 181 Singapore Hard Luxury Goods Market Value (US$ Mn), By Product Type 2012-2016
TABLE 182 Singapore Hard Luxury Goods Market Value (US$ Mn), By Product Type 2017-2022
TABLE 183 Singapore Hard Luxury Goods Market Value (US$ Mn), By Gender 2012-2016
TABLE 184 Singapore Hard Luxury Goods Market Value (US$ Mn), By Gender 2017-2022
TABLE 185 Singapore Hard Luxury Goods Market Value (US$ Mn), By Sales Channel 2012-2016
TABLE 186 Singapore Hard Luxury Goods Market Value (US$ Mn), By Sales Channel 2017-2022
TABLE 187 Australia Hard Luxury Goods Market Value (US$ Mn), By Product Type 2012-2016
TABLE 188 Australia Hard Luxury Goods Market Value (US$ Mn), By Product Type 2017-2022
TABLE 189 Australia Hard Luxury Goods Market Value (US$ Mn), By Gender 2012-2016
TABLE 190 Australia Hard Luxury Goods Market Value (US$ Mn), By Gender 2017-2022
TABLE 191 Australia Hard Luxury Goods Market Value (US$ Mn), By Sales Channel 2012-2016
TABLE 192 Australia Hard Luxury Goods Market Value (US$ Mn), By Sales Channel 2017-2022
TABLE 193 GCC Countries Hard Luxury Goods Market Value (US$ Mn), By Product Type 2012-2016
TABLE 194 GCC Countries Hard Luxury Goods Market Value (US$ Mn), By Product Type 2017-2022
TABLE 195 GCC Countries Hard Luxury Goods Market Value (US$ Mn), By Gender 2012-2016
TABLE 196 GCC Countries Hard Luxury Goods Market Value (US$ Mn), By Gender 2017-2022
TABLE 197 GCC Countries Hard Luxury Goods Market Value (US$ Mn), By Sales Channel 2012-2016
TABLE 198 GCC Countries Hard Luxury Goods Market Value (US$ Mn), By Sales Channel 2017-2022
TABLE 199 South Africa Hard Luxury Goods Market Value (US$ Mn), By Product Type 2012-2016
TABLE 200 South Africa Hard Luxury Goods Market Value (US$ Mn), By Product Type 2017-2022
TABLE 201 South Africa Hard Luxury Goods Market Value (US$ Mn), By Gender 2012-2016
TABLE 202 South Africa Hard Luxury Goods Market Value (US$ Mn), By Gender 2017-2022
TABLE 203 South Africa Hard Luxury Goods Market Value (US$ Mn), By Sales Channel 2012-2016
TABLE 204 South Africa Hard Luxury Goods Market Value (US$ Mn), By Sales Channel 2017-2022
TABLE 205 Nigeria Hard Luxury Goods Market Value (US$ Mn), By Product Type 2012-2016
TABLE 206 Nigeria Hard Luxury Goods Market Value (US$ Mn), By Product Type 2017-2022
TABLE 207 Nigeria Hard Luxury Goods Market Value (US$ Mn), By Gender 2012-2016
TABLE 208 Nigeria Hard Luxury Goods Market Value (US$ Mn), By Gender 2017-2022
TABLE 209 Nigeria Hard Luxury Goods Market Value (US$ Mn), By Sales Channel 2012-2016
TABLE 210 Nigeria Hard Luxury Goods Market Value (US$ Mn), By Sales Channel 2017-2022
TABLE 211 Israel Hard Luxury Goods Market Value (US$ Mn), By Product Type 2012-2016
TABLE 212 Israel Hard Luxury Goods Market Value (US$ Mn), By Product Type 2017-2022
TABLE 213 Israel Hard Luxury Goods Market Value (US$ Mn), By Gender 2012-2016
TABLE 214 Israel Hard Luxury Goods Market Value (US$ Mn), By Gender 2017-2022
TABLE 215 Israel Hard Luxury Goods Market Value (US$ Mn), By Sales Channel 2012-2016
TABLE 216 Israel Hard Luxury Goods Market Value (US$ Mn), By Sales Channel 2017-2022
List of Figures
FIG. 1 Global Hard Luxury Goods Market Value (US$ Mn), 2012-2016
FIG. 2 Global Hard Luxury Goods Market Value (US$ Mn) Forecast, 2017-2022
FIG. 3 Global Hard Luxury Goods Market Value (US$ Mn) and Y-o-Y, 2015-2022
FIG. 4 Global Watches Segment Market Value (US$ Mn) By Region, 2012-2016
FIG. 5 Global Watches Segment Market Value (US$ Mn) By Region, 2017-2022
FIG. 6 Global Watches Segment Y-o-Y Growth Rate, By Region, 2015-2022
FIG. 7 Global Jewelry Segment Market Value (US$ Mn) By Region, 2012-2016
FIG. 8 Global Jewelry Segment Market Value (US$ Mn) By Region, 2017-2022
FIG. 9 Global Jewelry Segment Y-o-Y Growth Rate, By Region, 2015-2022
FIG. 10 Global Men Segment Market Value (US$ Mn) By Region, 2012-2016
FIG. 11 Global Men Segment Market Value (US$ Mn) By Region, 2017-2022
FIG. 12 Global Men Segment Y-o-Y Growth Rate, By Region, 2015-2022
FIG. 13 Global Women Segment Market Value (US$ Mn) By Region, 2012-2016
FIG. 14 Global Women Segment Market Value (US$ Mn) By Region, 2017-2022
FIG. 15 Global Women Segment Y-o-Y Growth Rate, By Region, 2015-2022
FIG. 16 Global Monobrand Store Segment Market Value (US$ Mn) By Region, 2012-2016
FIG. 17 Global Monobrand Store Segment Market Value (US$ Mn) By Region, 2017-2022
FIG. 18 Global Monobrand Store Segment Y-o-Y Growth Rate, By Region, 2015-2022
FIG. 19 Global Department Store Segment Market Value (US$ Mn) By Region, 2012-2016
FIG. 20 Global Department Store Segment Market Value (US$ Mn) By Region, 2017-2022
FIG. 21 Global Department Store Segment Y-o-Y Growth Rate, By Region, 2015-2022
FIG. 22 Global Specialty Store Segment Market Value (US$ Mn) By Region, 2012-2016
FIG. 23 Global Specialty Store Segment Market Value (US$ Mn) By Region, 2017-2022
FIG. 24 Global Specialty Store Segment Y-o-Y Growth Rate, By Region, 2015-2022
FIG. 25 Global Online Store Segment Market Value (US$ Mn) By Region, 2012-2016
FIG. 26 Global Online Store Segment Market Value (US$ Mn) By Region, 2017-2022
FIG. 27 Global Online Store Segment Y-o-Y Growth Rate, By Region, 2015-2022
FIG. 28 Global Others Segment Market Value (US$ Mn) By Region, 2012-2016
FIG. 29 Global Others Segment Market Value (US$ Mn) By Region, 2017-2022
FIG. 30 Global Others Segment Y-o-Y Growth Rate, By Region, 2015-2022
FIG. 31 North America Hard Luxury Goods Market Value (US$ Mn), By Product Type 2012-2016
FIG. 32 North America Hard Luxury Goods Market Value (US$ Mn), By Product Type 2017-2022
FIG. 33 North America Hard Luxury Goods Market Value (US$ Mn), By Gender 2012-2016
FIG. 34 North America Hard Luxury Goods Market Value (US$ Mn), By Gender 2017-2022
FIG. 35 North America Hard Luxury Goods Market Value (US$ Mn), By Sales Channel 2012-2016
FIG. 36 North America Hard Luxury Goods Market Value (US$ Mn), By Sales Channel 2017-2022
FIG. 37 Latin America Hard Luxury Goods Market Value (US$ Mn), By Product Type 2012-2016
FIG. 38 Latin America Hard Luxury Goods Market Value (US$ Mn), By Product Type 2017-2022
FIG. 39 Latin America Hard Luxury Goods Market Value (US$ Mn), By Gender 2012-2016
FIG. 40 Latin America Hard Luxury Goods Market Value (US$ Mn), By Gender 2017-2022
FIG. 41 Latin America Hard Luxury Goods Market Value (US$ Mn), By Sales Channel 2012-2016
FIG. 42 Latin America Hard Luxury Goods Market Value (US$ Mn), By Sales Channel 2017-2022
FIG. 43 Europe Hard Luxury Goods Market Value (US$ Mn), By Product Type 2012-2016
FIG. 44 Europe Hard Luxury Goods Market Value (US$ Mn), By Product Type 2017-2022
FIG. 45 Europe Hard Luxury Goods Market Value (US$ Mn), By Gender 2012-2016
FIG. 46 Europe Hard Luxury Goods Market Value (US$ Mn), By Gender 2017-2022
FIG. 47 Europe Hard Luxury Goods Market Value (US$ Mn), By Sales Channel 2012-2016
FIG. 48 Europe Hard Luxury Goods Market Value (US$ Mn), By Sales Channel 2017-2022
FIG. 49 Japan Hard Luxury Goods Market Value (US$ Mn), By Product Type 2012-2016
FIG. 50 Japan Hard Luxury Goods Market Value (US$ Mn), By Product Type 2017-2022
FIG. 51 Japan Hard Luxury Goods Market Value (US$ Mn), By Gender 2012-2016
FIG. 52 Japan Hard Luxury Goods Market Value (US$ Mn), By Gender 2017-2022
FIG. 53 Japan Hard Luxury Goods Market Value (US$ Mn), By Sales Channel 2012-2016
FIG. 54 Japan Hard Luxury Goods Market Value (US$ Mn), By Sales Channel 2017-2022
FIG. 55 APEJ Hard Luxury Goods Market Value (US$ Mn), By Product Type 2012-2016
FIG. 56 APEJ Hard Luxury Goods Market Value (US$ Mn), By Product Type 2017-2022
FIG. 57 APEJ Hard Luxury Goods Market Value (US$ Mn), By Gender 2012-2016
FIG. 58 APEJ Hard Luxury Goods Market Value (US$ Mn), By Gender 2017-2022
FIG. 59 APEJ Hard Luxury Goods Market Value (US$ Mn), By Sales Channel 2012-2016
FIG. 60 APEJ Hard Luxury Goods Market Value (US$ Mn), By Sales Channel 2017-2022
FIG. 61 MEA Hard Luxury Goods Market Value (US$ Mn), By Product Type 2012-2016
FIG. 62 MEA Hard Luxury Goods Market Value (US$ Mn), By Product Type 2017-2022
FIG. 63 MEA Hard Luxury Goods Market Value (US$ Mn), By Gender 2012-2016
FIG. 64 MEA Hard Luxury Goods Market Value (US$ Mn), By Gender 2017-2022
FIG. 65 MEA Hard Luxury Goods Market Value (US$ Mn), By Sales Channel 2012-2016
FIG. 66 MEA Hard Luxury Goods Market Value (US$ Mn), By Sales Channel 2017-2022
Copyright © Transparency Market Research, Inc. All Rights reserved
Trust Online

Hard Luxury Goods Market