
Reports
Reports
Over the past few months, the coronavirus pandemic has caused an unprecedented global economic and social crisis. This has caused ripple effects even in the power distribution sector. Since commercial and industrial sectors continue to function in a staggered manner as stakeholders are reluctant to make short and long-term investments in projects, sales in power distribution component market have been affected.
Suppliers and manufacturers in the power distribution component market are focusing on needs of the residential sector, as several individuals and businesses are working remotely from their respective homes. The Western Power Distribution in the U.K. is increasing efforts to work 24/7 in order to keep the power flowing to millions of customers; such trends are helping to keep economies running during the ongoing pandemic.
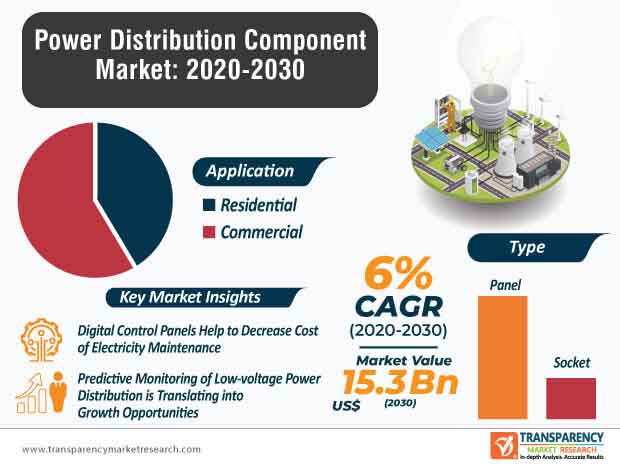
The power distribution component market is expected to reach the valuation of US$ 15.3 Bn by 2030. Digital control panels are gaining prominence for preventing signal loss during analog to digital conversion. However, its drawbacks involve the need for additional training to operate and troubleshoot the device. As such, companies are expanding their portfolio in before and after-sale services to gain a competitive edge over other market leaders and helps to provide training to service professionals.
Increase reliability, programmable functions, and reduction in signal loss are offsetting the disadvantages of digital control panels. Digital control panels help to easily manage other variables such as humidity, pressure, and temperature in commercial and residential spaces.
Automated power distribution is a fast growing phenomenon in the power distribution component market. This explains why the market is expected to grow at a favorable CAGR of 6% during the forecast period. The automated distribution of electricity helps to overcome major economic challenges such as increasing cost of electricity generation, rising cost of maintenance of components, and poor customer service.
Most electric utilities aim to save costs, whilst providing better services to their customers. Companies in the power distribution component market are gaining awareness about these demands and innovating in devices that deliver automated power distribution such as in the case of digital control panels.
Intelligent power innovation with predictive monitoring of low-voltage power distribution applications is translating into growth opportunities for stakeholders in the power distribution component market. In August 2020, power management company Eaton introduced its panelboards and switchboards that demonstrate real-time breaker health monitoring under its family of Pow-R-Line Xpert intelligent components.
Combined solutions with intelligent power distribution is providing accurate and actionable data useful for professionals and facility managers in healthcare, commercial buildings, and data centers. Such trends are contributing to the growth of the global power distribution component market. Smart power distribution helps industrial facilities to take smart decisions about upgrading their power distribution infrastructure.
Innovators in the power distribution component market are increasing their focus in modular and field-modifiable panel designs. ReliaGear neXT from ABB is gaining popularity for dramatically speeding up field modifications and omitting the need of labor-intensive bolt-on components. Innovations in plug-in circuit breakers help save time, labor, and cost, while ensuring greater energy efficiency and rock-solid reliability of electrical infrastructures.
Field-reversible bus stacks, along with plug-in circuit breakers help in fast installation of electrical infrastructures. Manufacturers in the power distribution component market are increasing their production capabilities in spring-loaded circuit breaker plug-in connectors with increased plating thickness for enhancing panel durability to facilitate repeated insertion and removal. Component suppliers are growing passionate about safety by developing arc-resistant switchgear and ground fault sensing circuit breakers that help to keep personnel out of harm’s way.
Analysts’ Viewpoint
Discoms are increasing efforts to maintain reliable networks to power home offices, home schooling, and are timely charging power distribution devices to ensure connectivity among individuals during the ongoing COVID-19 pandemic. Digital control panels are easily programmable and help to implement complex control techniques. However, there is a need of training in order to operate digital control panels. Hence, companies in the power distribution component market should amp-up their services, offer training to field professionals, and increase awareness about advantages such as prevention of signal loss during analog to digital conversion. Intelligent power distribution techniques help to deliver smart circuit protection of panelboards and switchboards.
1. Executive Summary
1.1. Market Outlook
1.2. Key Facts and Figures
1.3. Key Trends
2. Market Overview
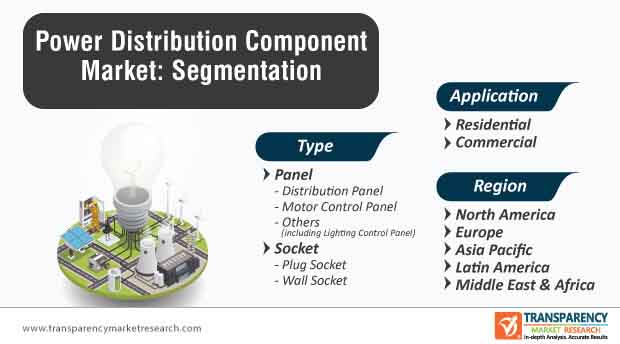
2.1. Market Segmentation
2.2. Market Indicators
3. Market Dynamics
3.1. Drivers and Restraints Snapshot Analysis
3.1.1.1. Drivers
3.1.1.2. Restraints
3.1.1.3. Opportunities
3.2. Porter’s Five Forces Analysis
3.2.1. Threat of Substitutes
3.2.2. Bargaining Power of Buyers
3.2.3. Bargaining Power of Suppliers
3.2.4. Threat of New Entrants
3.2.5. Degree of Competition
3.3. Regulatory Scenario
3.4. Value Chain Analysis
4. COVID-19 Impact Analysis
5. Power Distribution Component Market Value (US$ Mn) Analysis, by Type
5.1. Key Findings and Introduction
5.2. Power Distribution Component Market Value (US$ Mn) Forecast, by Type, 2019–2030
5.2.1. Power Distribution Component Market Value (US$ Mn) Forecast, by Panel, 2019–2030
5.2.1.1. Power Distribution Component Market Value (US$ Mn) Forecast, by Distribution Panel, 2019–2030
5.2.1.2. Power Distribution Component Market Value (US$ Mn) Forecast, by Motor Control Panel, 2019–2030
5.2.1.3. Power Distribution Component Market Value (US$ Mn) Forecast, by Others, 2019–2030
5.2.2. Power Distribution Component Market Value (US$ Mn) Forecast, by Socket, 2019–2030
5.2.2.1. Power Distribution Component Market Value (US$ Mn) Forecast, by Plug Socket, 2019–2030
5.2.2.2. Power Distribution Component Market Value (US$ Mn) Forecast, by Wall Socket, 2019–2030
5.3. Power Distribution Component Market Attractive Analysis, by Type
6. Power Distribution Component Market Value (US$ Mn) Analysis, by Application
6.1. Key Findings and Introduction
6.2. Power Distribution Component Market Value (US$ Mn) Forecast, by Application, 2019–2030
6.2.1. Power Distribution Component Market Value (US$ Mn) Forecast, by Residential, 2019-2030
6.2.2. Power Distribution Component Market Value (US$ Mn) Forecast, by Commercial, 2019-2030
6.3. Power Distribution Component Market Attractive Analysis, by Application
7. Power Distribution Component Market Analysis, by Region
7.1. Key Findings
7.2. Power Distribution Component Market Value (US$ Mn) Forecast, by Region
7.2.1. North America
7.2.2. Europe
7.2.3. Asia Pacific
7.2.4. Latin America
7.2.5. Middle East & Africa
7.3. Power Distribution Component Market Attractiveness Analysis, by Region
8. North America Power Distribution Component Overview
8.1. Key Findings
8.2. North America Power Distribution Component Value (US$ Mn) Forecast, by Type, 2019–2030
8.3. North America Power Distribution Component Value (US$ Mn) Forecast, by Application, 2019–2030
8.4. North America Power Distribution Component Value (US$ Mn) Forecast, by Country
8.4.1. U.S. Power Distribution Component Value (US$ Mn) Forecast, by Type, 2019–2030
8.4.2. U.S. Power Distribution Component Value (US$ Mn) Forecast, by Application, 2019–2030
8.4.3. Canada Power Distribution Component Value (US$ Mn) Forecast, by Type, 2019–2030
8.4.4. Canada Power Distribution Component Value (US$ Mn) Forecast, by Application, 2019–2030
8.5. North America Power Distribution Component Attractiveness Analysis, by Type
8.6. North America Power Distribution Component Attractiveness Analysis, by Application
8.7. North America Power Distribution Component Attractiveness Analysis, by Country
9. Europe Power Distribution Component Overview
9.1. Key Findings
9.2. Europe Power Distribution Component Value (US$ Mn) Forecast, by Type, 2019–2030
9.3. Europe Power Distribution Component Value (US$ Mn) Forecast, by Application, 2019–2030
9.4. Europe Power Distribution Component Value (US$ Mn) and Forecast, by Country and Sub-region
9.4.1. Germany Power Distribution Component Value (US$ Mn) Forecast, by Type, 2019–2030
9.4.2. Germany Power Distribution Component Value (US$ Mn) Forecast, by Application, 2019–2030
9.4.3. U.K. Power Distribution Component Value (US$ Mn) Forecast, by Type, 2019–2030
9.4.4. U.K. Power Distribution Component Value (US$ Mn) Forecast, by Application, 2019–2030
9.4.5. France Power Distribution Component Value (US$ Mn) Forecast, by Type, 2019–2030
9.4.6. France Power Distribution Component Value (US$ Mn) Forecast, by Application, 2019–2030
9.4.7. Spain Power Distribution Component Value (US$ Mn) Forecast, by Type, 2019–2030
9.4.8. Spain Power Distribution Component Value (US$ Mn) Forecast, by Application, 2019–2030
9.4.9. Italy Power Distribution Component Value (US$ Mn) Forecast, by Type, 2019–2030
9.4.10. Italy Power Distribution Component Value (US$ Mn) Forecast, by Application, 2019–2030
9.4.11. Russia & CIS Power Distribution Component Value (US$ Mn) Forecast, by Type, 2019–2030
9.4.12. Russia & CIS Power Distribution Component Value (US$ Mn) Forecast, by Application, 2019–2030
9.4.13. Rest of Europe Power Distribution Component Value (US$ Mn) Forecast, by Type, 2019–2030
9.4.14. Rest of Europe Power Distribution Component Value (US$ Mn) Forecast, by Application, 2019–2030
9.5. Europe Power Distribution Component Attractiveness Analysis, by Type
9.6. Europe Power Distribution Component Attractiveness Analysis, by Application
9.7. Europe Power Distribution Component Attractiveness Analysis, by Country and Sub-region
10. Asia Pacific Power Distribution Component Overview
10.1. Key Findings
10.2. Asia Pacific Power Distribution Component Value (US$ Mn) Forecast, by Type, 2019–2030
10.3. Asia Pacific Power Distribution Component Value (US$ Mn) Forecast, by Application, 2019–2030
10.4. Asia Pacific Power Distribution Component Value (US$ Mn) Forecast, by Country and Sub-region
10.4.1. China Power Distribution Component Value (US$ Mn) Forecast, by Type, 2019–2030
10.4.2. China Power Distribution Component Value (US$ Mn) Forecast, by Application, 2019–2030
10.4.3. India Power Distribution Component Value (US$ Mn) Forecast, by Type, 2019–2030
10.4.4. India Power Distribution Component Value (US$ Mn) Forecast, by Application, 2019–2030
10.4.5. Japan Power Distribution Component Value (US$ Mn) Forecast, by Type, 2019–2030
10.4.6. Japan Power Distribution Component Value (US$ Mn) Forecast, by Application, 2019–2030
10.4.7. ASEAN Power Distribution Component Value (US$ Mn) Forecast, by Type, 2019–2030
10.4.8. ASEAN Power Distribution Component Value (US$ Mn) Forecast, by Application, 2019–2030
10.4.9. Rest of Asia Pacific Power Distribution Component Value (US$ Mn) Forecast, by Type, 2019–2030
10.4.10. Rest of Asia Pacific Power Distribution Component Value (US$ Mn) Forecast, by Application, 2019–2030
10.5. Asia Pacific Power Distribution Component Attractiveness Analysis, by Type
10.6. Asia Pacific Power Distribution Component Attractiveness Analysis, by Application
10.7. Asia Pacific Power Distribution Component Attractiveness Analysis, by Country and Sub-region
11. Latin America Power Distribution Component Overview
11.1. Key Findings
11.2. Latin America Power Distribution Component Value (US$ Mn) Forecast, by Type, 2019–2030
11.3. Latin America Power Distribution Component Value (US$ Mn) Forecast, by Application, 2019–2030
11.4. Latin America Power Distribution Component Value (US$ Mn) Forecast, by Country and Sub-region
11.4.1. Brazil Power Distribution Component Value (US$ Mn) Forecast, by Type, 2019–2030
11.4.2. Brazil Power Distribution Component Value (US$ Mn) Forecast, by Application, 2019–2030
11.4.3. Mexico Power Distribution Component Value (US$ Mn) Forecast, by Type, 2019–2030
11.4.4. Mexico Power Distribution Component Value (US$ Mn) Forecast, by Application, 2019–2030
11.4.5. Rest of Latin America Power Distribution Component Value (US$ Mn) Forecast, by Type, 2019–2030
11.4.6. Rest of Latin America Power Distribution Component Value (US$ Mn) Forecast, by Application, 2019–2030
11.5. Latin America Power Distribution Component Attractiveness Analysis, by Type
11.6. Latin America Power Distribution Component Attractiveness Analysis, by Application
11.7. Latin America Power Distribution Component Attractiveness Analysis, by Country and Sub-region
12. Middle East & Africa Power Distribution Component Overview
12.1. Key Findings
12.2. Middle East & Africa Power Distribution Component Value (US$ Mn) Forecast, by Type, 2019–2030
12.3. Middle East & Africa Power Distribution Component Value (US$ Mn) Forecast, by Application, 2019–2030
12.4. Middle East & Africa Power Distribution Component Value (US$ Mn) Forecast, by Country and Sub-region
12.4.1. GCC Power Distribution Component Value (US$ Mn) Forecast, by Type, 2019–2030
12.4.2. GCC Power Distribution Component Value (US$ Mn) Forecast, by Application, 2019–2030
12.4.3. South Africa Power Distribution Component Value (US$ Mn) Forecast, by Type, 2019–2030
12.4.4. South Africa Power Distribution Component Value (US$ Mn) Forecast, by Application, 2019–2030
12.4.5. Rest of Middle East & Africa Power Distribution Component Value (US$ Mn) Forecast, by Type, 2019–2030
12.4.6. Rest of Middle East & Africa Power Distribution Component Value (US$ Mn) Forecast, by Application, 2019–2030
12.5. Middle East & Africa Power Distribution Component Attractiveness Analysis, by Type
12.6. Middle East & Africa Power Distribution Component Attractiveness Analysis, by Application
12.7. Middle East & Africa Power Distribution Component Attractiveness Analysis, by Country and Sub-region
13. Competition Landscape
13.1. Competition Matrix
13.2. Power Distribution Component Market Share Analysis, by Company (2020)
13.3. Market Footprint Analysis
13.4. Company Profiles
13.4.1. ABB Ltd.
13.4.1.1. Company Details
13.4.1.2. Company Description
13.4.1.3. Business Overview
13.4.1.4. Financial Details
13.4.1.5. Strategic Overview
13.4.2. Lucy Electric
13.4.2.1. Company Details
13.4.2.2. Company Description
13.4.2.3. Business Overview
13.4.3. Siemens
13.4.3.1. Company Details
13.4.3.2. Company Description
13.4.3.3. Business Overview
13.4.3.4. Financial Details
13.4.3.5. Strategic Overview
13.4.4. Eaton
13.4.4.1. Company Details
13.4.4.2. Company Description
13.4.4.3. Business Overview
13.4.4.4. Financial Details
13.4.4.5. Strategic Overview
13.4.5. Norelco
13.4.5.1. Company Details
13.4.5.2. Company Description
13.4.5.3. Business Overview
13.4.6. Schneider Electric SE
13.4.6.1. Company Details
13.4.6.2. Company Description
13.4.6.3. Business Overview
13.4.6.4. Financial Details
13.4.6.5. Strategic Overview
13.4.7. Larsen & Toubro Limited
13.4.7.1. Company Details
13.4.7.2. Company Description
13.4.7.3. Business Overview
13.4.7.4. Financial Details
13.4.8. Hyundai Electric & Energy Systems Co., Ltd.
13.4.8.1. Company Details
13.4.8.2. Company Description
13.4.8.3. Business Overview
13.4.8.4. Financial Details
13.4.9. Fuji Electric Co., Ltd.
13.4.9.1. Company Details
13.4.9.2. Company Description
13.4.9.3. Business Overview
13.4.9.4. Financial Details
13.4.10. Crompton Greaves Consumer Electricals Ltd.
13.4.10.1. Company Details
13.4.10.2. Company Description
13.4.10.3. Business Overview
13.4.10.4. Financial Details
13.4.11. Mitsubishi Electric Corporation
13.4.11.1. Company Details
13.4.11.2. Company Description
13.4.11.3. Business Overview
13.4.11.4. Financial Details
13.4.11.5. Strategic Overview
13.4.12. GENERAL Electric
13.4.12.1. Company Details
13.4.12.2. Company Description
13.4.12.3. Business Overview
13.4.12.4. Financial Details
13.4.12.5. Strategic Overview
14. Primary Research – Key Insights
15. Appendix
15.1. Research Methodology and Assumptions
List of Tables
Table 01: Global Power Distribution Component Market Value (US$ Mn) Forecast, by Type, 2019–2030
Table 02: Global Power Distribution Component Market Value (US$ Mn) Forecast, by Application, 2019–2030
Table 03: North America Power Distribution Component Market Value (US$ Mn) Forecast, by Country, 2019–2030
Table 04: North America Power Distribution Component Market Value (US$ Mn) Forecast, by Type, 2019–2030
Table 05: North America Power Distribution Component Market Value (US$ Mn) Forecast, by Application, 2019–2030
Table 06: U.S. Power Distribution Component Market Value (US$ Mn) Forecast, by Type, 2019–2030
Table 07: U.S. Power Distribution Component Market Value (US$ Mn) Forecast, by Application, 2019–2030
Table 08: Canada Power Distribution Component Market Value (US$ Mn) Forecast, by Type, 2019–2030
Table 09: Canada Power Distribution Component Market Value (US$ Mn) Forecast, by Application, 2019–2030
Table 10: Europe Power Distribution Component Market Value (US$ Mn) Forecast, by Country and Sub-region, 2019–2030
Table 11: Europe Power Distribution Component Market Value (US$ Mn) Forecast, by Type, 2019–2030
Table 12: Europe Power Distribution Component Market Value (US$ Mn) Forecast, by Application, 2019–2030
Table 13: U.K. Power Distribution Component Market Value (US$ Mn) Forecast, by Type, 2019–2030
Table 14: U.K. Power Distribution Component Market Value (US$ Mn) Forecast, by Application, 2019–2030
Table 15: Germany Power Distribution Component Market Value (US$ Mn) Forecast, by Type, 2019–2030
Table 16: Germany Power Distribution Component Market Value (US$ Mn) Forecast, by Application, 2019–2030
Table 17: France Power Distribution Component Market Value (US$ Mn) Forecast, by Type, 2019–2030
Table 18: France Power Distribution Component Market Value (US$ Mn) Forecast, by Application, 2019–2030
Table 19: Italy Power Distribution Component Market Value (US$ Mn) Forecast, by Type, 2019–2030
Table 20: Italy Power Distribution Component Market Value (US$ Mn) Forecast, by Application, 2019–2030
Table 21: Spain Power Distribution Component Market Value (US$ Mn) Forecast, by Type, 2019–2030
Table 22: Spain Power Distribution Component Market Value (US$ Mn) Forecast, by Application, 2019–2030
Table 23: Russia & CIS Power Distribution Component Market Value (US$ Mn) Forecast, by Type, 2019–2030
Table 24: Russia & CIS Power Distribution Component Market Value (US$ Mn) Forecast, by Application, 2019–2030
Table 25: Rest of Europe Power Distribution Component Market Value (US$ Mn) Forecast, by Type, 2019–2030
Table 26: Rest of Europe Power Distribution Component Market Value (US$ Mn) Forecast, by Application, 2019–2030
Table 27: Asia Pacific Power Distribution Component Market Value (US$ Mn) Forecast, by Country and Sub-region, 2019–2030
Table 28: Asia Pacific Power Distribution Component Market Value (US$ Mn) Forecast, by Type, 2019–2030
Table 29: Asia Pacific Power Distribution Component Market Value (US$ Mn) Forecast, by Application, 2019–2030
Table 30: China Power Distribution Component Market Value (US$ Mn) Forecast, by Type, 2019–2030
Table 31: China Power Distribution Component Market Value (US$ Mn) Forecast, by Application, 2019–2030
Table 32: India Power Distribution Component Market Value (US$ Mn) Forecast, by Type, 2019–2030
Table 33: India Power Distribution Component Market Value (US$ Mn) Forecast, by Application, 2019–2030
Table 34: Japan Power Distribution Component Market Value (US$ Mn) Forecast, by Type, 2019–2030
Table 35: Japan Power Distribution Component Market Value (US$ Mn) Forecast, by Application, 2019–2030
Table 36: ASEAN Power Distribution Component Market Value (US$ Mn) Forecast, by Type, 2019–2030
Table 37: ASEAN Power Distribution Component Market Value (US$ Mn) Forecast, by Application, 2019–2030
Table 38: Rest of Asia Pacific Power Distribution Component Market Value (US$ Mn) Forecast, by Type, 2019–2030
Table 39: Rest of Asia Pacific Power Distribution Component Market Value (US$ Mn) Forecast, by Application, 2019–2030
Table 40: Middle East & Africa Power Distribution Component Market Value (US$ Mn) Forecast, by Country and Sub-region, 2019–2030
Table 41: Middle East & Africa Power Distribution Component Market Value (US$ Mn) Forecast, by Type, 2019–2030
Table 42: Middle East & Africa Power Distribution Component Market Value (US$ Mn) Forecast, by Application, 2019–2030
Table 43: GCC Power Distribution Component Market Value (US$ Mn) Forecast, by Type, 2019–2030
Table 44: GCC Power Distribution Component Market Value (US$ Mn) Forecast, by Application, 2019–2030
Table 45: South Africa Power Distribution Component Market Value (US$ Mn) Forecast, by Type, 2019–2030
Table 46: South Africa Power Distribution Component Market Value (US$ Mn) Forecast, by Application, 2019–2030
Table 47: Rest of Middle East & Africa Power Distribution Component Market Value (US$ Mn) Forecast, by Type, 2019–2030
Table 48: Rest of Middle East & Africa Power Distribution Component Market Value (US$ Mn) Forecast, by Application, 2019–2030
Table 49: Latin America Power Distribution Component Market Value (US$ Mn) Forecast, by Country and Sub-region, 2019–2030
Table 50: Latin America Power Distribution Component Market Value (US$ Mn) Forecast, by Type, 2019–2030
Table 51: Latin America Power Distribution Component Market Value (US$ Mn) Forecast, by Application, 2019–2030
Table 52: Brazil Power Distribution Component Market Value (US$ Mn) Forecast, by Type, 2019–2030
Table 53: Brazil Power Distribution Component Market Value (US$ Mn) Forecast, by Application, 2019–2030
Table 54: Mexico Power Distribution Component Market Value (US$ Mn) Forecast, by Type, 2019–2030
Table 55: Mexico Power Distribution Component Market Value (US$ Mn) Forecast, by Application, 2019–2030
Table 56: Rest of Latin America Power Distribution Component Market Value (US$ Mn) Forecast, by Type, 2019–2030
Table 57: Rest of Latin America Power Distribution Component Market Value (US$ Mn) Forecast, by Application, 2019–2030
List of Figures
Figure 01: Global Power Distribution Component Market Value Share Analysis, by Type, 2019, 2025, and 2030
Figure 02: Global Power Distribution Component Market Attractiveness Analysis, by Type
Figure 03: Global Power Distribution Component Market Value Share Analysis, by Application, 2019, 2025, and 2030
Figure 04: Global Power Distribution Component Market Attractiveness Analysis, by Application
Figure 05: North America Power Distribution Component Market Value (US$ Mn) Forecast, 2019–2030
Figure 06: North America Power Distribution Component Market Value Share Analysis, by Country, 2019, 2025, and 2030
Figure 07: North America Power Distribution Component Market Attractiveness Analysis, by Country
Figure 08: North America Power Distribution Component Market Value Share Analysis, by Type, 2019, 2025, and 2030
Figure 09: North America Power Distribution Component Market Attractiveness Analysis, by Type
Figure 10: North America Power Distribution Component Market Value Share Analysis, by Application, 2019, 2025, and 2030
Figure 11: North America Power Distribution Component Market Attractiveness Analysis, by Application
Figure 12: Europe Power Distribution Component Market Value (US$ Mn) Forecast, 2019–2030
Figure 13: Europe Power Distribution Component Market Value Share Analysis, by Country and Sub-region, 2019, 2025, and 2030
Figure 14: Europe Power Distribution Component Market Attractiveness Analysis, by Country and Sub-region
Figure 15: Europe Power Distribution Component Market Value Share Analysis, by Type, 2019, 2025, and 2030
Figure 16: Europe Power Distribution Component Market Attractiveness Analysis, by Type
Figure 17: Europe Power Distribution Component Market Value Share Analysis, by Application, 2019, 2025, and 2030
Figure 18: Europe Power Distribution Component Market Attractiveness Analysis, by Application
Figure 19: Asia Pacific Power Distribution Component Market Value (US$ Mn) Forecast, 2019–2030
Figure 20: Asia Pacific Power Distribution Component Market Value Share Analysis, by Country and Sub-region, 2019, 2025, and 2030
Figure 21: Asia Pacific Power Distribution Component Market Attractiveness Analysis, by Country and Sub-region
Figure 22: Asia Pacific Power Distribution Component Market Value Share Analysis, by Type, 2019, 2025, and 2030
Figure 23: Asia Pacific Power Distribution Component Market Attractiveness Analysis, by Type
Figure 24: Asia Pacific Power Distribution Component Market Value Share Analysis, by Application, 2019, 2025, and 2030
Figure 25: Asia Pacific Power Distribution Component Market Attractiveness Analysis, by Application
Figure 26: Middle East & Africa Power Distribution Component Market Value (US$ Mn) Forecast, 2019–2030
Figure 27: Middle East & Africa Power Distribution Component Market Value Share Analysis, by Country and Sub-region, 2019, 2025, and 2030
Figure 28: Middle East & Africa Power Distribution Component Market Attractiveness Analysis, by Country and Sub-region
Figure 29: Middle East & Africa Power Distribution Component Market Value Share Analysis, by Type, 2019, 2025, and 2030
Figure 30: Middle East & Africa Power Distribution Component Market Attractiveness Analysis, by Type
Figure 31: Middle East & Africa Power Distribution Component Market Value Share Analysis, by Application, 2019, 2025, and 2030
Figure 32: Middle East & Africa Power Distribution Component Market Attractiveness Analysis, by Application
Figure 33: Latin America Power Distribution Component Market Value (US$ Mn) Forecast, 2019–2030
Figure 34: Latin America Power Distribution Component Market Value Share Analysis, by Country and Sub-region, 2019, 2025, and 2030
Figure 35: Latin America Power Distribution Component Market Attractiveness Analysis, by Country and Sub-region
Figure 36: Latin America Power Distribution Component Market Value Share Analysis, by Type, 2019, 2025, and 2030
Figure 37: Latin America Power Distribution Component Market Attractiveness Analysis, by Type
Figure 38: Latin America Power Distribution Component Market Value Share Analysis, by Application, 2019, 2025, and 2030
Figure 39: Latin America Power Distribution Component Market Attractiveness Analysis, by Application
Figure 40: Company Market Share Analysis, 2019
Copyright © Transparency Market Research, Inc. All Rights reserved
Trust Online

Global Power Distribution Component Market Forecast 2020-2030