
Reports
Reports
The demand within the global bioenergy market is slated to grow with fresh developments in the energy sector. Depletion of fossil fuels has created humongous opportunities for new industries such as renewable and green energy. The energy sector has sent clarion calls to several industries, requesting them to conserve and preserve the earth’s natural cover. Furthermore, the rising levels of air and environmental pollution have compelled these industries to invest in renewable technologies. The shift from non-renewable resources to renewable energy technologies forms the basis for growth within the global bioenergy market. There is little contention about the growing focus on renewable technologies across leading industries.
Widening Energy Gap Pushes Countries to Use Bioenergy
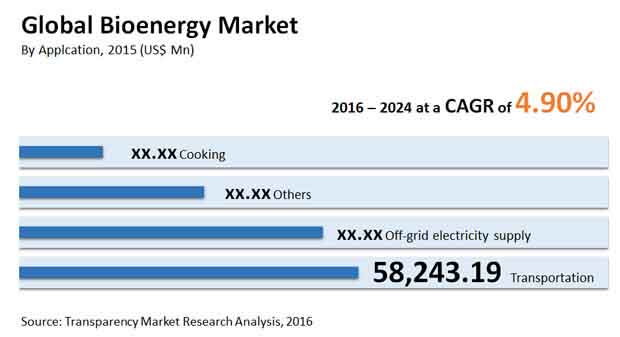
The growing demand for energy to keep up with the industrial spurt and the rampant urbanization has created a huge shortfall, coaxing several countries to resort to alternative energy options. The increasing pressure on the world leaders to reduce the carbon footprint and the deadly amount of greenhouse gasses is also forcing nations across the globe, especially developing countries to take up the option of bioenergy seriously. With these environmental, social, and political pressures the opportunity in the global bioenergy market is anticipated to be worth US$246.52 bn by 2024 from US$158.39 bn in 2015. During the forecast period of 2016 and 2024, the global market is expected to rise at a CAGR of 4.9%.
Yet another growth driver for the bioenergy is the looming crisis of energy security. The transportation industry, known as the backbone of every economy, depends on oil, which makes it exceptionally vulnerable to any changes in the oil prices. Modern economies are heavily relying on renewable sources of energy to achieve long-term energy security by reducing their dependence on other nations to fuel their economic growth. Thus, the sustainable environmental projects initiated by several governments are expected to propel the usage of bioenergy across several sectors.
Bioethanol: An Alternative to Conventional Fuel
Bioethanol is the largest product segment of the bioenergy market. Increasing awareness about the advantages of bioethanol, its cost-efficiency, and its benefit to the environment are some the underlying factors supporting the growth of this segment. The biggest end user of bioethanol is the transportation industry. The sale of bioethanol has gained momentum in the recent years due to the ban on usage of gasoline in some countries. In the foreseeable future, the unaffordable rise in the price of crude oil is going to push governments and private sector to commercialize the sale of bioethanol for several purposes.
Supportive Policies Help Europe Lead the Race
Europe is at the forefront of the bioenergy consumption, changing the perspective of the world towards greener living with its positive efforts. As of 2014, the region accounted for 44.0% of the global market with support from governments in the form of subsidies. The major production plants supplemented the bioenergy needs of Europe are based in France, the U.K., Germany, and Sweden. The key policies changing the face of the energy mix in Europe are Promotion of Renewable Electricity, European Emissions Trading Schemes, and Biofuels and Landfill Directives.
Some of the key players operating in the global bioenergy market are Joule Unlimited, Amyris, Inc., Abengoa Bioenergy, BP Biofuels, Butamax Advanced Biofuels, Ceres Inc., E. I. du Pont de Nemours and Company, Enerkem, Gevo, Inc., POET LLC, Novozymes, LanzaTech, Sapphire Energy, Zeachem Inc., and Solazyme Inc. The majority of the players in this market are focusing on improving their brand awareness and investing in expanding their geographical reach to grab bigger and better shares in the overall market. Vertical integration is also an important business strategy adopted by some of the companies in the global bioenergy market.
Bioenergy Market to Witness Notable Development Owing to Increasing Emphasis on Biofuel Creation
Bioenergy is an environmentally friendly power energy supply made out of materials acquired from characteristic or organic sources. Biomass, for instance, is a type of bioenergy that incorporates wood, fertilizer, squander, sugarcane, straw, and an assortment of different things. On a worldwide scale, there is an energy emergency; thus, plans are being made to utilize various kinds of bioenergy advances to alleviate the current circumstance. The expanding shift towards renewables and other non-petroleum product based fuel sources, like strong biomass, biogas, and others, is a significant supporter of the development of the bioenergy business. During the projected period, factors, for example, rising energy interest propels in bioenergy transformation innovation, expanded bioenergy speculation, and diminishing power age costs from bioenergy offices are required to drive the business. Nonetheless, in the coming years, the developing utilization of electric vehicles all throughout the planet is required to negatively affect biofuel creation.
The expanding worry about an Earth-wide temperature boost and future energy security has brought about expanded energy insurance drives, which is another basic development driver for the worldwide bioenergy industry. The transportation business is the foundation of any monetary area, and it is intensely dependent on oil, making it exceptionally powerless against oil value changes. Current monetary conditions depend altogether on environmentally friendly power sources to accomplish long haul energy security while lessening their dependence on different nations to foster their economies. Subsequently, it is expected that sustainable green projects embraced by specific governments would advance the utilization of bioenergy in an assortment of areas.
Latest improvements in the energy area are likely to augment the growth of the bioenergy market. Consumption of petroleum derivatives has set out humongous open doors for new enterprises like inexhaustible and environmentally friendly power energy. The energy area has sent clarion calls to a few businesses, mentioning them to moderate and protect the world's regular cover. Moreover, the rising degrees of air and ecological contamination have constrained these ventures to put resources into inexhaustible innovations. The shift from non-inexhaustible assets to sustainable power advancements shapes the reason for development inside the worldwide bioenergy market. There is little dispute about the developing spotlight on inexhaustible advances across driving enterprises.
List of Tables
Table1.1 Global Bioenergy Market: Snapshot
Table1.2 Global Bioenergy Market, Revenue Estimates and Forecast, By Product, 2014–2024 (US$ Bn)
Table1.3 Global Bioenergy Market, Volume Estimates and Forecast, By Product, 2014–2024 (Billion Gallons)
Table1.4 Global Bioenergy Market, Revenue Estimates and Forecast, By Application, 2014–2024 (US$ Bn)
Table1.5 Global Bioenergy Market, Volume Estimates and Forecast, By Application, 2014–2024 (Billion Gallons)
Table1.6 North America Bioenergy Market, By Product, 2014–2024 (US$ Bn)
Table1.7 North America Bioenergy Market, By Product, 2014–2024 (Billion Gallons)
Table1.8 North America Bioenergy Market, By Application, 2014–2024 (US$ Bn)
Table1.9 North America Bioenergy Market, By Application, 2014–2024 (Billion Gallons)
Table1.10 U.S. Bioenergy Market, By Product, 2014–2024 (US$ Bn)
Table1.11 U.S. Bioenergy Market, By Product, 2014–2024 (Billion Gallons)
Table1.12 U.S. Bioenergy Market, By Application, 2014–2024 (US$ Bn)
Table1.13 U.S. Bioenergy Market, By Application, 2014–2024 (Billion Gallons)
Table1.14 Canada Bioenergy Market, By Product, 2014–2024 (US$ Bn)
Table1.15 Canada Bioenergy Market, By Product, 2014–2024 (Billion Gallons)
Table1.16 Canada Bioenergy Market, By Application, 2014–2024 (US$ Bn)
Table1.17 Canada Bioenergy Market, By Application, 2014–2024 (Billion Gallons)
Table1.18 Mexico Bioenergy Market, By Product, 2014–2024 (US$ Bn)
Table1.19 Mexico Bioenergy Market, By Product, 2014–2024 (Billion Gallons)
Table1.20 Mexico Bioenergy Market, By Application, 2014–2024 (US$ Bn)
Table1.21 Mexico Bioenergy Market, By Application, 2014–2024 (Billion Gallons)
Table1.22 Europe Bioenergy Market, By Product, 2014–2024 (US$ Bn)
Table1.23 Europe Bioenergy Market, By Product, 2014–2024 (Billion Gallons)
Table1.24 Europe Bioenergy Market, By Application, 2014–2024 (US$ Bn)
Table1.25 Europe Bioenergy Market, By Application, 2014–2024 (Billion Gallons)
Table1.26 Germany Bioenergy Market, By Product, 2014–2024 (US$ Bn)
Table1.27 Germany Bioenergy Market, By Product, 2014–2024 (Billion Gallons)
Table1.28 Germany Bioenergy Market, By Application, 2014–2024 (US$ Bn)
Table1.29 Germany Bioenergy Market, By Application, 2014–2024 (Billion Gallons)
Table1.30 U.K. Bioenergy Market, By Product, 2014–2024 (US$ Bn)
Table1.31 U.K. Bioenergy Market, By Product, 2014–2024 (Billion Gallons)
Table1.32 U.K. Bioenergy Market, By Application, 2014–2024 (US$ Bn)
Table1.33 U.K. Bioenergy Market, By Application, 2014–2024 (Billion Gallons)
Table1.34 France Bioenergy Market, By Product, 2014–2024 (US$ Bn)
Table1.35 France Bioenergy Market, By Product, 2014–2024 (Billion Gallons)
Table1.36 France Bioenergy Market, By Application, 2014–2024 (US$ Bn)
Table1.37 France Bioenergy Market, By Application, 2014–2024 (Billion Gallons)
Table1.38 Rest of Europe Bioenergy Market, By Product, 2014–2024 (US$ Bn)
Table1.39 Rest of Europe Bioenergy Market, By Product, 2014–2024 (Billion Gallons)
Table1.40 Rest of Europe Bioenergy Market, By Application, 2014–2024 (US$ Bn)
Table1.41 Rest of Europe Bioenergy Market, By Application, 2014–2024 (Billion Gallons)
Table1.42 Asia Pacific Bioenergy Market, By Product, 2014–2024 (US$ Bn)
Table1.43 Asia Pacific Bioenergy Market, By Product, 2014–2024 (Billion Gallons)
Table1.44 Asia Pacific Bioenergy Market, By Application, 2014–2024 (US$ Bn)
Table1.45 Asia Pacific Bioenergy Market, By Application, 2014–2024 (Billion Gallons)
Table1.46 China Bioenergy Market, By Product, 2014–2024 (US$ Bn)
Table1.47 China Bioenergy Market, By Product, 2014–2024 (Billion Gallons)
Table1.48 China Bioenergy Market, By Application, 2014–2024 (US$ Bn)
Table1.49 China Bioenergy Market, By Application, 2014–2024 (Billion Gallons)
Table1.50 India Bioenergy Market, By Product, 2014–2024 (US$ Bn)
Table1.51 India Bioenergy Market, By Product, 2014–2024 (Billion Gallons)
Table1.52 India Bioenergy Market, By Application, 2014–2024 (US$ Bn)
Table1.53 India Bioenergy Market, By Application, 2014–2024 (Billion Gallons)
Table1.54 Japan Bioenergy Market, By Product, 2014–2024 (US$ Bn)
Table1.55 Japan Bioenergy Market, By Product, 2014–2024 (Billion Gallons)
Table1.56 Japan Bioenergy Market, By Application, 2014–2024 (US$ Bn)
Table1.57 Japan Bioenergy Market, By Application, 2014–2024 (Billion Gallons)
Table1.58 Rest of Asia Pacific Bioenergy Market, By Product, 2014–2024 (US$ Bn)
Table1.59 Rest of Asia Pacific Bioenergy Market, By Product, 2014–2024 (Billion Gallons)
Table1.60 Rest of Asia Pacific Bioenergy Market, By Application, 2014–2024 (US$ Bn)
Table1.61 Rest of Asia Pacific Bioenergy Market, By Application, 2014–2024 (Billion Gallons)
Table1.62 Rest of the World Bioenergy Market, By Product, 2014–2024 (US$ Bn)
Table1.63 Rest of the World Bioenergy Market, By Product, 2014–2024 (Billion Gallons)
Table1.64 Rest of the World Bioenergy Market, By Application, 2014–2024 (US$ Bn)
Table1.65 Rest of the World Bioenergy Market, By Application, 2014–2024 (Billion Gallons)
Table1.66 Brazil Bioenergy Market, By Product, 2014–2024 (US$ Bn)
Table1.67 Brazil Bioenergy Market, By Product, 2014–2024 (Billion Gallons)
Table1.68 Brazil Bioenergy Market, By Application, 2014–2024 (US$ Bn)
Table1.69 Brazil Bioenergy Market, By Application, 2014–2024 (Billion Gallons)
Table1.70 Argentina Bioenergy Market, By Product, 2014–2024 (US$ Bn)
Table1.71 Argentina Bioenergy Market, By Product, 2014–2024 (Billion Gallons)
Table1.72 Argentina Bioenergy Market, By Application, 2014–2024 (US$ Bn)
Table1.73 Argentina Bioenergy Market, By Application, 2014–2024 (Billion Gallons)
Table1.74 Mozambique Bioenergy Market, By Product, 2014–2024 (US$ Bn)
Table1.75 Mozambique Bioenergy Market, By Product, 2014–2024 (Billion Gallons)
Table1.76 Mozambique Bioenergy Market, By Application, 2014–2024 (US$ Bn)
Table1.77 Mozambique Bioenergy Market, By Application, 2014–2024 (Billion Gallons)
Table1.78 Others Bioenergy Market, By Product, 2014–2024 (US$ Bn)
Table1.79 Others Bioenergy Market, By Product, 2014–2024 (Billion Gallons)
Table1.80 Others Bioenergy Market, By Application, 2014–2024 (US$ Bn)
Table1.81 Others Bioenergy Market, By Application, 2014–2024 (Billion Gallons)
List of Figures
Figure 1. Global Bioenergy Market, Estimates and Forecast, By Revenue, 2014–2024 (US$ Bn)
Figure 2. Global Bioenergy Market, % Market Revenue, By Region, 2014
Figure 3. Bioenergy Market – Market Attractiveness Analysis, 2014
Figure 4. Global Bioenergy Market Share, By Product, By Revenue, 2014 and 2024
Figure 5. Global Bioethanol Segment, Revenue and Volume Estimates and Forecast, 2014–2024 (US$ Bn) (Billion Gallons)
Figure 6. Global Biodiesel Segment, Revenue and Volume Estimates and Forecast, 2014–2024 (US$ Bn) (Billion Gallons)
Figure 7. Global Biogas Segment, Revenue and Volume Estimates and Forecast, 2014–2024 (US$ Bn) (Billion Gallons)
Figure 8. Global Others Segment, Revenue and Volume Estimates and Forecast, 2014–2024 (US$ Bn) (Billion Gallons)
Figure 9. Global Bioenergy Market Share, By Application, By Revenue, 2014 and 2024
Figure 10. Global Cooking Segment, Revenue and Volume Estimates and Forecast, 2014–2024 (US$ Bn) (Billion Gallons)
Figure 11. Global Off-grid electricity Segment, Revenue and Volume Estimates and Forecast, 2014–2024 (US$ Bn) (Billion Gallons)
Figure 12. Global Transportation Segment, Revenue and Volume Estimates and Forecast, 2014–2024 (US$ Bn) (Billion Gallons)
Figure 13. Global Others Segment, Revenue and Volume Estimates and Forecast, 2014–2024 (US$ Bn) (Billion Gallons)
Figure 14. Global Bioenergy Market Share, By Region, By Revenue 2014 and 2024
Figure 15. North America Bioenergy Market, By Revenue, 2014 and 2024
Figure 16. Bioenergy Market – North America, By Country, 2014–2024 (US$ Bn)
Figure 17. Bioenergy Market – North America, By Country, 2014–2024 (Billion Gallons)
Figure 18. Europe Bioenergy Market, By Revenue, 2014 and 2024
Figure 19. Bioenergy Market – Europe, By Country, 2014–2024 (US$ Bn)
Figure 20. Bioenergy Market – Europe, By Country, 2014–2024 (Billion Gallons)
Figure 21. Asia Pacific Bioenergy Market, By Revenue, 2014 and 2024
Figure 22. Bioenergy Market – Asia Pacific, By Country, 2014–2024 (US$ Bn)
Figure 23. Bioenergy Market – Asia Pacific, By Country, 2014–2024 (Billion Gallons)
Figure 24. Rest of the World Bioenergy Market, By Revenue, 2014 and 2024
Figure 25. Bioenergy Market – Rest of the World, By Country, 2014–2024 (US$ Bn)
Figure 26. Bioenergy Market – Rest of the World, By Country, 2014–2024 (Billion Gallons)
Copyright © Transparency Market Research, Inc. All Rights reserved
Trust Online

Bioenergy Market