
Reports
Reports
Global Gas Turbine Upgrades for Performance Enhancement Market: Snapshot
Gas turbines are the most widely used power generating technology in today’s world. A gas turbine is a common type of internal combustion engine that uses hot gases produced from the combustion of air-fuel mixtures to rotate turbine blades for generating power. For several years, gas turbines have been used in the aerospace industry and other industries. Gas turbines can run on a variety of fuels such as fuel oil, synthetic fuel, and natural gas. Gas turbines consist of three primary components mounted on the same shaft: compressor, combustion chamber, and turbine. With the emergence of renewable sources of energy and continuous growth of power generation and gas sectors, the need for advancements in existing gas turbines has emerged. The performance of gas turbines is restricted by the ambient temperature, as the power output of gas turbines is inversely proportional to the ambient temperature. The air mass flow rate decreases when the ambient temperature increases, which results in reduced power output from gas turbines.
Upgrades of gas turbines are necessary to boost power and improve the heat rate of gas turbines, either by increasing their inlet air density or by boosting specific power. Innovative solutions are being carried out by OEMs to meet the requirements of various end-use customers due to the evolution of the electricity market, the changing environmental requirements and the globalization of the energy market. They also help reduce the overall environmental impact of a plant through lowered CO2 emissions.
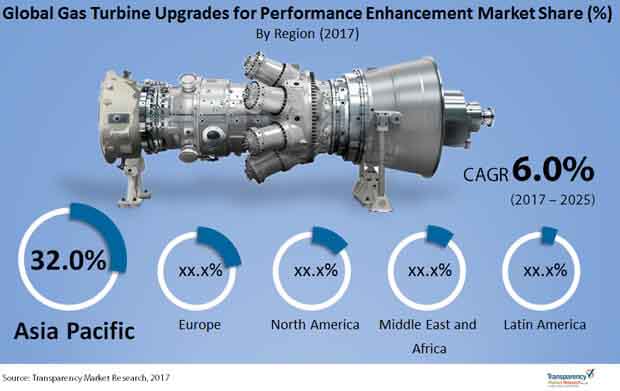
The global gas turbine upgrades for performance enhancement market is expected to exhibit a 6% CAGR between 2017 and 2025. The market was valued at US$13.9 bn in 2017 and is likely to rise to US$22.3 bn by 2025.
Combined Cycles to Dominate Market due to Higher Efficiency
The gas turbine upgrades for performance enhancement market has been segmented into two categories: turbine cycle and upgrade type. In terms of turbine cycle, the gas turbine upgrades for performance enhancement market has been classified into simple cycle and combined cycle. In terms of revenue, combined cycle held the largest share in 2016, owing to its extensive usage and better efficiency than simple cycle gas turbines.
By upgrade type, the gas turbine upgrades for performance enhancement market has been segregated into comprehensive upgrade, hot section coating, compressor coating, inlet air fogging, and other. The inlet air fogging is further segmented into evaporative cooling, fogging, inlet chilling, and others. By upgrade type, the comprehensive upgrade segment constituted 33% market share in 2016.
Asia Pacific to Dominate Gas Turbine Upgrades for Performance Enhancement Market
In terms of region, the gas turbine upgrades for performance enhancement market has been classified into North America, Europe, Asia Pacific, Middle East and Africa, and Latin America. In 2016, Asia Pacific dominated the gas turbine upgrades for performance enhancement market with a share of more than 32% and is expected to follow the trend during the forecast period, with the region likely to exhibit the leading 6.6% CAGR in the forecast period. Europe’s share in the global gas turbine upgrades for performance enhancement market is also likely to rise in the market, with the market expected to exhibit a 6.1% CAGR in the 2017-2025 forecast period.
Key players in the gas turbine upgrades for performance enhancement market are expected to benefit from the formation of strategic alliances with global players in the gas turbine upgrades for performance enhancement market. Prominent players in the gas turbine upgrades for performance enhancement market are General Electric, MITSUBISHI HEAVY INDUSTRIES, LTD., Siemens AG, ENRGISTX, Mee Industries Inc., Stellar Energy, and others.
Strict Emission Norms and Latest Advancements to Bring Extensive Growth Opportunities for the Gas Turbine Upgrades for Performance Enhancement Market
The gas turbine upgrades for performance enhancement market is anticipated to observe stable growth across the assessment period of 2017-2025 on the back of the heightening electricity consumption around the world. The gas turbine technology has evolved extensively since its inception and continues to evolve at a faster rate. Thus, all these aspects prove to be vital growth generators for the gas turbine upgrades for performance enhancement market.
1. Preface
1.1. Report Scope and Market Segmentation
1.2. Research Highlights
1.3. Research Objectives
1.4. Key Questions Answered
2. Assumptions and Research Methodology
2.1. Report Assumptions
2.2. Abbreviations Used
2.3. Research Methodology
3. Executive Summary
3.1. Global Gas Turbine Upgrades for Performance Enhancement Market Size, by Market Value (US$ Mn/Bn) and Market Value Share, by Region
3.2. Top 3 Trends
4. Market Overview
4.1. Introduction
4.2. Market Indicator
4.3. Drivers and Restraints Snapshot Analysis
4.3.1. Drivers
4.3.2. Restraints
4.3.3. Opportunities
4.4. Porter’s Analysis
4.4.1. Threat of Substitutes
4.4.2. Bargaining Power of Buyers
4.4.3. Bargaining Power of Suppliers
4.4.4. Threat of New Entrants
4.4.5. Degree of Competition
4.5. Value Chain Analysis
4.6. SWOT Analysis
4.7. Global Regulatory Scenario
5. Global Gas Turbine Upgrades for Performance Enhancement Market Analysis and Forecasts, by Turbine Cycle
5.1. Key Findings
5.2. Introduction and Definition
5.3. Market Size (US$ Mn) Forecast, By Turbine Cycle
5.4. Gas Turbine Upgrades for Performance Enhancement Market Analysis, By Turbine Cycle
5.5. Gas Turbine Upgrades for Performance Enhancement Market Attractiveness Analysis, By Turbine Cycle
5.6. Gas Turbine Upgrades For Performance Enhancement Market, Comparison Matrix, By Turbine Cycle
6. Global Gas Turbine Upgrades for Performance Enhancement Market Analysis and Forecasts, by Upgrade Type
6.1. Introduction and Definition
6.2. Key Findings
6.3. Market Size (US$ Mn) Forecast, By Upgrade Type
6.4. Gas Turbine Upgrades for Performance Enhancement Market Analysis, By Upgrade Type
6.5. Gas Turbine Upgrades for Performance Enhancement Market Attractiveness Analysis, By Upgrade Type
6.6. Gas Turbine Upgrades for Performance Enhancement Market, Comparison Matrix, By Upgrade Type
7. Global Gas Turbine Upgrades for Performance Enhancement Market Analysis, By Region
7.1. Key Findings
7.2. Market Size (US$ Mn) Forecast, By Region
7.3. Gas Turbine Upgrades for Performance Enhancement Market Attractiveness Analysis, By Region
8. North America Gas Turbine Upgrades for Performance Enhancement Market Analysis
8.1. Key Findings
8.2. North America Gas Turbine Upgrades for Performance Enhancement Market Overview
8.3. North America Market Value Share Analysis, By Turbine Cycle
8.4. North America Market Value Share Analysis, By Upgrade Type
8.5. North America Market Value Share Analysis, By Country
8.5.1. U.S., 2017-2025
8.5.2. Canada, 2017-2025
8.6. North America Market, Comparison Matrix by Turbine Cycle
8.7. North America Market, Comparison Matrix by Upgrade Type
8.8. PEST Analysis
9. Latin America Gas Turbine Upgrades for Performance Enhancement Market Analysis
9.1. Key Findings
9.2. Latin America Gas Turbine Upgrades for Performance Enhancement Market Overview
9.3. Latin America Market Value Share Analysis, By Turbine Cycle
9.4. Latin America Market Value Share Analysis, By Upgrade Type
9.5. Latin America Market Value Share Analysis, By Country
9.5.1. Brazil, 2017-2025
9.5.2. Mexico, 2017-2025
9.5.3. Rest of Latin America, 2017-2025
9.6. Latin America Market, Comparison Matrix by Turbine Cycle
9.7. Latin America Market, Comparison Matrix by Upgrade Type
9.8. PEST Analysis
10. Europe Gas Turbine Upgrades for Performance Enhancement Market Analysis
10.1. Key Findings
10.2. Europe Gas Turbine Upgrades for Performance Enhancement Market Overview
10.3. Europe Market Value Share Analysis, By Turbine Cycle
10.4. Europe Market Value Share Analysis, By Upgrade Type
10.5. Europe Market Value Share Analysis, By Country
10.5.1. Germany, 2017-2025
10.5.2. France, 2017-2025
10.5.3. U.K., 2017-2025
10.5.4. Spain, 2017-2025
10.5.5. Italy, 2017-2025
10.5.6. Rest of Europe, 2017-2025
10.6. Europe Market, Comparison Matrix by Turbine Cycle
10.7. Europe Market, Comparison Matrix by Upgrade Type
10.8. PEST Analysis
11. Asia Pacific Gas Turbine Upgrades for Performance Enhancement Market Analysis
11.1. Key Findings
11.2. Asia Pacific Gas Turbine Upgrades for Performance Enhancement Market Overview
11.3. Asia Pacific Market Value Share Analysis, By Turbine Cycle
11.4. Asia Pacific Market Value Share Analysis, By Upgrade Type
11.5. Asia Pacific Market Value Share Analysis, By Country
11.5.1. China, 2017-2025
11.5.2. Japan, 2017-2025
11.5.3. India, 2017-2025
11.5.4. ASEAN, 2017-2025
11.5.5. Rest of Asia Pacific, 2017-2025
11.6. Asia Pacific Market, Comparison Matrix by Turbine Cycle
11.7. Asia Pacific Market, Comparison Matrix by Upgrade Type
11.8. PEST Analysis
12. Middle East & Africa Gas Turbine Upgrades for Performance Enhancement Market Analysis
12.1. Key Findings
12.2. Middle East & Africa Gas Turbine Upgrades for Performance Enhancement Market Overview
12.3. Middle East & Africa Market Value Share Analysis, By Turbine Cycle
12.4. Middle East & Africa Market Value Share Analysis, By Upgrade Type
12.5. Middle East & Africa Market Value Share Analysis, By Country
12.5.1. GCC, 2017-2025
12.5.2. South Africa, 2017-2025
12.5.3. Rest of Middle East & Africa, 2017-2025
12.6. Middle East & Africa Market, Comparison Matrix by Turbine Cycle
12.7. Middle East & Africa Market, Comparison Matrix by Upgrade Type
12.8. PEST Analysis
13. Company Profiles
13.1. GENERAL ELECTRIC
13.1.1. Company Overview
13.1.2 Financial Overview
13.1.3. Business Strategy
13.1.4. Recent Developments
13.2. MITSUBISHI HEAVY INDUSTRIES, LTD.
13.2.1. Company Overview
13.2.2 Financial Overview
13.2.3. Business Strategy
13.2.4. Recent Developments
13.3. Siemens AG
13.3.1. Company Overview
13.3.2 Financial Overview
13.3.3. Business Strategy
13.3.4. Recent Developments
13.4. Stellar Energy
13.4.1. Company Overview
13.4.2 Financial Overview
13.5. Mee Industries Inc.
13.5.1. Company Overview
13.5.2 Financial Overview
13.6. ENRGISTX
13.6.1. Company Overview
13.6.2 Financial Overview
13.7. Araner
13.7.1. Company Overview
13.7.2 Financial Overview
13.8. Integrated Turbine Systems
13.8.1. Company Overview
13.8.2 Financial Overview
13.9. Centrax Ltd.
13.9.1. Company Overview
13.9.2 Financial Overview
13.10. Dresser-Rand
13.10.1. Company Overview
13.10.2 Financial Overview
13.11. B&B-AGEMA GmbH
13.11.1. Company Overview
13.11.2 Financial Overview
14. Key Asian Utility Market Players
14.1. Electricity Generating Authority of Thailand
14.1.1. Company Overview
14.1.2 Financial Overview
14.1.3. Business Strategy
14.1.4. Recent Developments
14.2. Vietnam Electricity
14.2.1. Company Overview
14.2.2 Financial Overview
14.2.3. Business Strategy
14.2.4. Recent Developments
14.3. Tata Power
14.3.1. Company Overview
14.3.2 Financial Overview
14.3.3. Business Strategy
14.3.4. Recent Developments
14.4. PetroVietnam
14.4.1. Company Overview
14.4.2 Financial Overview
14.3.3. Business Strategy
14.3.4. Recent Developments
14.5. NTPC Ltd.
14.5.1. Company Overview
14.5.2 Financial Overview
14.3.3. Business Strategy
14.3.4. Recent Developments
14.6. TENAGA NASIONAL BERHAD
14.6.1. Company Overview
14.6.2 Financial Overview
14.3.3. Business Strategy
14.3.4. Recent Developments
14.7. Singapore Power Ltd.
14.7.1. Company Overview
14.7.2 Financial Overview
14.3.3. Business Strategy
14.3.4. Recent Developments
14.8. Karnataka Power Transmission Corporation Limited
14.8.1. Company Overview
14.8.2 Financial Overview
14.3.3. Business Strategy
14.3.4. Recent Developments
14.9. INDONESIA POWER
14.9.1. Company Overview
14.9.2 Financial Overview
14.3.3. Business Strategy
14.3.4. Recent Developments
14.10. Maharashtra State Electricity Board
14.10.1. Company Overview
14.10.2 Financial Overview
14.11. BSES Rajdhani Power Ltd
14.11.1. Company Overview
14.11.2 Financial Overview
14.12. BSES Yamuna Power Ltd
14.12.1. Company Overview
14.12.2 Financial Overview
14.13. PT Perusahaan Listrik Negara
14.13.1. Company Overview
14.13.2 Financial Overview
14.14. PT Pembangkitan Jawa-Bali
14.14.1. Company Overview
14.14.2 Financial Overview
15. Key Take Away
List of Tables
Table 1: Gas Turbine Upgrades for Performance Enhancement Market Revenue (US$ Mn) Forecast, by Turbine Cycle, 2016-2025
Table 2: Gas Turbine Upgrades for Performance Enhancement Market Revenue (US$ Mn) Forecast, by Type of Upgrade, 2016-2025
Table 3: Gas Turbine Upgrades for Performance Enhancement Market Revenue (US$ Mn) Forecast, by Inlet Air Fogging Sub-Segment, 2016-2025
Table 4: Global Gas Turbine Upgrades for Performance Enhancement Market, Revenue (US$ Mn) Forecast, by Region, 2016–2025
Table 5: North America Gas Turbine Upgrades for Performance Enhancement Market Revenue (US$ Mn) Forecast, by Type of Upgrade, 2016–2025
Table 6: North America Gas Turbine Upgrades for Performance Enhancement Market Revenue (US$ Mn) Forecast, by Inlet Air Fogging, 2016–2025
Table 7: North America Gas Turbine Upgrades for Performance Enhancement Market Revenue (US$ Mn) Forecast, by Turbine Cycle, 2016–2025
Table 8: North America Gas Turbine Upgrades for Performance Enhancement Market Revenue (US$ Mn) Forecast, by Country/Sub-region, 2016–2025
Table 9: U.S. Gas Turbine Upgrades for Performance Enhancement Market Revenue (US$ Mn) Forecast, by Type of Upgrade, 2016–2025
Table 10: U.S. Gas Turbine Upgrades for Performance Enhancement Market Revenue (US$ Mn) Forecast, by Inlet Air Fogging, 2016–2025
Table 11: U.S. Gas Turbine Upgrades for Performance Enhancement Market Revenue (US$ Mn) Forecast, by Turbine Cycle, 2016–2025
Table 12: Canada Gas Turbine Upgrades for Performance Enhancement Market Revenue (US$ Mn) Forecast, by Type of Upgrade, 2016–2025
Table 13: Canada Gas Turbine Upgrades for Performance Enhancement Market Revenue (US$ Mn) Forecast, by Inlet Air Fogging, 2016–2025
Table 14: Canada Gas Turbine Upgrades for Performance Enhancement Market Revenue (US$ Mn) Forecast, by Turbine Cycle, 2016–2025
Table 15: Europe Gas Turbine Upgrades for Performance Enhancement Market Revenue (US$ Mn) Forecast, by Type of Upgrade, 2016–2025
Table 16: Europe Gas Turbine Upgrades for Performance Enhancement Market Revenue (US$ Mn) Forecast, by Turbine Cycle, 2016–2025
Table 17: Europe Gas Turbine Upgrades for Performance Enhancement Market Revenue (US$ Mn) Forecast, by Inlet Air Fogging Type, 2016–2025
Table 18: Europe Gas Turbine Upgrades for Performance Enhancement Market Revenue (US$ Mn) Forecast, by Country/Sub-region, 2016–2025
Table 19: Germany Gas Turbine Upgrades for Performance Enhancement Market Revenue (US$ Mn) Forecast, by Type of Upgrade, 2016–2025
Table 20: Germany Gas Turbine Upgrades for Performance Enhancement Market Revenue (US$ Mn) Forecast, by Inlet Air Fogging Type, 2016–2025
Table 21: Germany Gas Turbine Upgrades for Performance Enhancement Market Revenue (US$ Mn) Forecast, by Turbine Cycle, 2016–2025
Table 22: France Gas Turbine Upgrades for Performance Enhancement Market Revenue (US$ Mn) Forecast, by Type of Upgrade, 2016–2025
Table 23: France Gas Turbine Upgrades for Performance Enhancement Market Revenue (US$ Mn) Forecast, by Inlet Air Fogging Type, 2016–2025
Table 24: France Gas Turbine Upgrades for Performance Enhancement Market Revenue (US$ Mn) Forecast, by Turbine Cycle, 2016–2025
Table 25: U.K. Gas Turbine Upgrades for Performance Enhancement Market Revenue (US$ Mn) Forecast, by Type of Upgrade, 2016–2025
Table 26: U.K. Gas Turbine Upgrades for Performance Enhancement Market Revenue (US$ Mn) Forecast, by Inlet Air Fogging Type, 2016–2025
Table 27: U.K. Gas Turbine Upgrades for Performance Enhancement Market Revenue (US$ Mn) Forecast, by Turbine Cycle, 2016–2025
Table 28: Spain Gas Turbine Upgrades for Performance Enhancement Market Revenue (US$ Mn) Forecast, by Type of Upgrade, 2016–2025
Table 29: Spain Gas Turbine Upgrades for Performance Enhancement Market Revenue (US$ Mn) Forecast, by Inlet Air Fogging Type, 2016–2025
Table 30: Spain Gas Turbine Upgrades for Performance Enhancement Market Revenue (US$ Mn) Forecast, by Turbine Cycle, 2016–2025
Table 31: Italy Gas Turbine Upgrades for Performance Enhancement Market Revenue (US$ Mn) Forecast, by Type of Upgrade, 2016–2025
Table 32: Italy Gas Turbine Upgrades for Performance Enhancement Market Revenue (US$ Mn) Forecast, by Inlet Air Fogging Type, 2016–2025
Table 33: Italy Gas Turbine Upgrades for Performance Enhancement Market Revenue (US$ Mn) Forecast, by Turbine Cycle, 2016–2025
Table 34: Rest of Europe Gas Turbine Upgrades for Performance Enhancement Market Revenue (US$ Mn) Forecast, by Type of Upgrade, 2016–2025
Table 35: Rest of Europe Gas Turbine Upgrades for Performance Enhancement Market Revenue (US$ Mn) Forecast, by Inlet Air Fogging Type, 2016–2025
Table 36: Rest of Europe Gas Turbine Upgrades for Performance Enhancement Market Revenue (US$ Mn) Forecast, by Turbine Cycle, 2016–2025
Table 37: Asia Pacific Gas Turbine Upgrades for Performance Enhancement Market Revenue (US$ Mn) Forecast, by Type of Upgrade, 2016–2025
Table 38: Asia Pacific Gas Turbine Upgrades for Performance Enhancement Market Revenue (US$ Mn) Forecast, by Inlet Air Fogging, 2016–2025
Table 39: Asia Pacific Gas Turbine Upgrades for Performance Enhancement Market Revenue (US$ Mn) Forecast, by Turbine Cycle, 2016–2025
Table 40: Asia Pacific Gas Turbine Upgrades for Performance Enhancement Market Revenue (US$ Mn) Forecast, by Country/Sub-region, 2016–2025
Table 41: China Gas Turbine Upgrades for Performance Enhancement Market Revenue (US$ Mn) Forecast, by Type of Upgrade, 2016–2025
Table 42: China Gas Turbine Upgrades for Performance Enhancement Market Revenue (US$ Mn) Forecast, by Inlet Air Fogging Type, 2016–2025
Table 43: China Gas Turbine Upgrades for Performance Enhancement Market Revenue (US$ Mn) Forecast, by Turbine Cycle, 2016–2025
Table 44: Japan Gas Turbine Upgrades for Performance Enhancement Market Revenue (US$ Mn) Forecast, by Type of Upgrade, 2016–2025
Table 45: Japan Gas Turbine Upgrades for Performance Enhancement Market Revenue (US$ Mn) Forecast, by Inlet Air Fogging, 2016–2025
Table 46: Japan Gas Turbine Upgrades for Performance Enhancement Market Revenue (US$ Mn) Forecast, by Turbine Cycle, 2016–2025
Table 47: India Gas Turbine Upgrades for Performance Enhancement Market Revenue (US$ Mn) Forecast, by Type of Upgrade, 2016–2025
Table 48: India Gas Turbine Upgrades for Performance Enhancement Market Revenue (US$ Mn) Forecast, by Inlet Air Fogging, 2016–2025
Table 49: India Gas Turbine Upgrades for Performance Enhancement Market Revenue (US$ Mn) Forecast, by Turbine Cycle, 2016–2025
Table 50: ASEAN Gas Turbine Upgrades for Performance Enhancement Market Revenue (US$ Mn) Forecast, by Type of Upgrade, 2016–2025
Table 51: ASEAN Gas Turbine Upgrades for Performance Enhancement Market Revenue (US$ Mn) Forecast, by Inlet Air Fogging, 2016–2025
Table 52: ASEAN Gas Turbine Upgrades for Performance Enhancement Market Revenue (US$ Mn) Forecast, by Turbine Cycle, 2016–2025
Table 53: Rest of Asia Pacific Gas Turbine Upgrades for Performance Enhancement Market Revenue (US$ Mn) Forecast, by Type of Upgrade, 2016–2025
Table 54: Rest of Asia Pacific Gas Turbine Upgrades for Performance Enhancement Market Revenue (US$ Mn) Forecast, by Inlet Air Fogging, 2016–2025
Table 55: Rest of Asia Pacific Gas Turbine Upgrades for Performance Enhancement Market Revenue (US$ Mn) Forecast, by Turbine Cycle, 2016–2025
Table 56: Middle East & Africa Gas Turbine Upgrades for Performance Enhancement Market Revenue (US$ Mn) Forecast, by Type of Upgrade, 2016–2025
Table 57: Middle East & Africa Gas Turbine Upgrades for Performance Enhancement Market Revenue (US$ Mn) Forecast, by Inlet Air Fogging, 2016–2025
Table 58: Middle East & Africa Gas Turbine Upgrades for Performance Enhancement Market Revenue (US$ Mn) Forecast, by Turbine Cycle, 2016–2025
Table 59: Middle East & Africa Gas Turbine Upgrades for Performance Enhancement Market Revenue (US$ Mn) Forecast, by Country/Sub-region, 2016–2025
Table 60: GCC Gas Turbine Upgrades for Performance Enhancement Market Revenue (US$ Mn) Forecast, by Type of Upgrade, 2016–2025
Table 61: GCC Gas Turbine Upgrades for Performance Enhancement Market Revenue (US$ Mn) Forecast, by Inlet Air Fogging Type, 2016–2025
Table 62: GCC Gas Turbine Upgrades for Performance Enhancement Market Revenue (US$ Mn) Forecast, by Turbine Cycle, 2016–2025
Table 63: South Africa Gas Turbine Upgrades for Performance Enhancement Market Revenue (US$ Mn) Forecast, by Type of Upgrade, 2016–2025
Table 64: South Africa Gas Turbine Upgrades for Performance Enhancement Market Revenue (US$ Mn) Forecast, by Inlet Air Fogging, 2016–2025
Table 65: South Africa Gas Turbine Upgrades for Performance Enhancement Market Revenue (US$ Mn) Forecast, by Turbine Cycle, 2016–2025
Table 66: Rest of Middle East & Africa Gas Turbine Upgrades for Performance Enhancement Market Revenue (US$ Mn) Forecast, by Type of Upgrade, 2016–2025
Table 67: Rest of Middle East & Africa Gas Turbine Upgrades for Performance Enhancement Market Revenue (US$ Mn) Forecast, by Inlet Air Fogging, 2016–2025
Table 68: Rest of Middle East & Africa Gas Turbine Upgrades for Performance Enhancement Market Revenue (US$ Mn) Forecast, by Turbine Cycle, 2016–2025
Table 69: Latin America Gas Turbine Upgrades for Performance Enhancement Market Revenue (US$ Mn) Forecast, by Type of Upgrade, 2016–2025
Table 70: Latin America Gas Turbine Upgrades for Performance Enhancement Market Revenue (US$ Mn) Forecast, by Inlet Air Fogging, 2016–2025
Table 71: Latin America Gas Turbine Upgrades for Performance Enhancement Market Revenue (US$ Mn) Forecast, by Turbine Cycle, 2016–2025
Table 72: Latin America Gas Turbine Upgrades for Performance Enhancement Market Revenue (US$ Mn) Forecast, by Country/Sub-region, 2016–2025
Table 73: Brazil Gas Turbine Upgrades for Performance Enhancement Market Revenue (US$ Mn) Forecast, by Type of Upgrade, 2016–2025
Table 74: Brazil Gas Turbine Upgrades for Performance Enhancement Market Revenue (US$ Mn) Forecast, by Inlet Air Fogging, 2016–2025
Table 75: Brazil Gas Turbine Upgrades for Performance Enhancement Market Revenue (US$ Mn) Forecast, by Turbine Cycle, 2016–2025
Table 76: Mexico Gas Turbine Upgrades for Performance Enhancement Market Revenue (US$ Mn) Forecast, by Type of Upgrade, 2016–2025
Table 77: Mexico Gas Turbine Upgrades for Performance Enhancement Market Revenue (US$ Mn) Forecast, by Inlet Air Fogging, 2016–2025
Table 78: Mexico Gas Turbine Upgrades for Performance Enhancement Market Revenue (US$ Mn) Forecast, by Turbine Cycle, 2016–2025
Table 79: Rest of Latin America Gas Turbine Upgrades for Performance Enhancement Market Revenue (US$ Mn) Forecast, by Type of Upgrade, 2016–2025
Table 80: Rest of Latin America Gas Turbine Upgrades for Performance Enhancement Market Revenue (US$ Mn) Forecast, by Inlet Air Fogging, 2016–2025
Table 81: Rest of Latin America Gas Turbine Upgrades for Performance Enhancement Market Revenue (US$ Mn) Forecast, by Turbine Cycle, 2016–2025
List of Figures
Figure: 1 Global Gas Turbine Upgrades for Performance Enhancement Market Size, By Market Value (US$ Mn) and Market Value Share, By Region
Figure 2: Global Gas Turbine Upgrades for Performance Enhancement Market Size (US$ Mn) Forecast, 2017–2025
Figure 3: Global Gas Turbine Upgrades for Performance Enhancement Market Value Share Analysis, by Turbine Cycle, 2016 and 2025
Figure 4: Global Gas Turbine Upgrades for Performance Enhancement Market Size (US$ Mn) Forecast, by Simple Cycle, 2017–2025
Figure 5: Global Gas Turbine Upgrades for Performance Enhancement Market Size (US$ Mn) Forecast, by Combined Cycle, 2017–2025
Figure 6: Gas Turbine Upgrades for Performance Enhancement Market Attractiveness Analysis, by Turbine Cycle
Figure 7: Global Gas Turbine Upgrades for Performance Enhancement Market Value Share Analysis, by Type of Upgrade, 2016 and 2025
Figure 8: Global Gas Turbine Upgrades for Performance Enhancement Market Size (US$ Mn) Forecast, by Comprehensive Upgrade, 2017–2025
Figure 9: Global Gas Turbine Upgrades for Performance Enhancement Market Size (US$ Mn) Forecast, by Hot Section Coating, 2017–2025
Figure 10: Global Gas Turbine Upgrades for Performance Enhancement Market Size (US$ Mn) Forecast, by Compressor Coating, 2017–2025
Figure 11: Global Gas Turbine Upgrades for Performance Enhancement Market Size (US$ Mn) Forecast, by Inlet Air Fogging, 2017–2025
Figure 12: Global Gas Turbine Upgrades for Performance Enhancement Market Size (US$ Mn) Forecast, by Others, 2017–2025
Figure 13: Gas Turbine Upgrades for Performance Enhancement Market Attractiveness Analysis, by Type of Upgrade
Figure 14: Global Gas Turbine Upgrades for Performance Enhancement Market Value Share Analysis, by Region, 2016 and 2025
Figure 15: Global Gas Turbine Upgrades for Performance Enhancement Market Attractiveness Analysis, by Region
Figure 16: North America Gas Turbine Upgrades for Performance Enhancement Market Size (US$ Mn) Forecast, 2016–2025
Figure 17: North America Gas Turbine Upgrades for Performance Enhancement Market Value Share (US$ Mn) Analysis, by Type of Upgrade, 2016 and 2025
Figure 18: North America Gas Turbine Upgrades for Performance Enhancement Market Value Share (US$ Mn) Analysis, by Turbine Cycle, 2016 and 2025
Figure 19: North America Market Value Share (US$ Mn) Analysis, by Country/Sub-region, 2016 and 2025
Figure 20: Europe Gas Turbine Upgrades for Performance Enhancement Market Size (US$ Mn) Forecast, 2016–2025
Figure 21: Europe Gas Turbine Upgrades for Performance Enhancement Market Value Share (US$ Mn) Analysis, by Type of Upgrade, 2016 and 2025
Figure 22: Europe Gas Turbine Upgrades for Performance Enhancement Market Value Share (US$ Mn) Analysis, by Turbine Cycle, 2016 and 2025
Figure 23: Europe Market Value Share (US$ Mn) Analysis, by Country/Sub-region, 2016 and 2025
Figure 24: Asia Pacific Gas Turbine Upgrades for Performance Enhancement Market Size (US$ Mn) Forecast, 2016–2025
Figure 25: Asia Pacific Gas Turbine Upgrades for Performance Enhancement Market Value Share (US$ Mn) Analysis, by Type of Upgrade, 2016 and 2025
Figure 26: Asia Pacific Gas Turbine Upgrades for Performance Enhancement Market Value Share (US$ Mn) Analysis, by Turbine Cycle, 2016 and 2025
Figure 27: Asia Pacific Market Value Share (US$ Mn) Analysis, by Country/Sub-region, 2016 and 2025
Figure 28: Middle East & Africa Gas Turbine Upgrades for Performance Enhancement Market Size (US$ Mn) Forecast, 2016–2025
Figure 29: Middle East & Africa Gas Turbine Upgrades for Performance Enhancement Market Value Share (US$ Mn) Analysis, by Type of Upgrade, 2016 and 2025
Figure 30: Middle East & Africa Gas Turbine Upgrades for Performance Enhancement Market Value Share (US$ Mn) Analysis, by Turbine Cycle, 2016 and 2025
Figure 31: Middle East & Africa Market Value Share (US$ Mn) Analysis, by Country/Sub-region, 2016 and 2025
Figure 32: Latin America Gas Turbine Upgrades for Performance Enhancement Market Size (US$ Mn) Forecast, 2016–2025
Figure 33: Latin America Gas Turbine Upgrades for Performance Enhancement Market Value Share (US$ Mn) Analysis, by Type of Upgrade, 2016 and 2025
Figure 34: Latin America Gas Turbine Upgrades for Performance Enhancement Market Value Share (US$ Mn) Analysis, by Turbine Cycle, 2016 and 2025
Figure 35: Latin America Market Value Share (US$ Mn) Analysis, by Country/Sub-region, 2016 and 2025
Figure 36: Global gas turbine upgrades for performance enhancement Market Share Analysis, by Company (2016)
Copyright © Transparency Market Research, Inc. All Rights reserved
Trust Online

Gas Turbine Upgrades For Performance Enhancement Market