
Reports
Reports
Global Food Hydrocolloids Market: Snapshot
Stiff competition and fragmentation prevail in the global food hydrocolloids market. In this market with a large number of local and regional players, key players have resorted to product innovation, investments, and acquisitions to gain competitive advantage.
The food industry has been displaying a surging demand for food hydrocolloids predominantly on account of its functional properties. The increasing uptake of ready-to-eat meals is the key factor having a positive impact on the food hydrocolloids market. In present times, the increasing complexity in consumer dynamics due to professional and personal commitments does not leave adequate time for fresh cooking on a regular basis. This, in turn, is displaying an increased demand for ingredients used in food products such as hydrocolloids.
Proving a roadblock to the growth of the food hydrocolloids market is the use of conventional ingredients from the regional food industry.
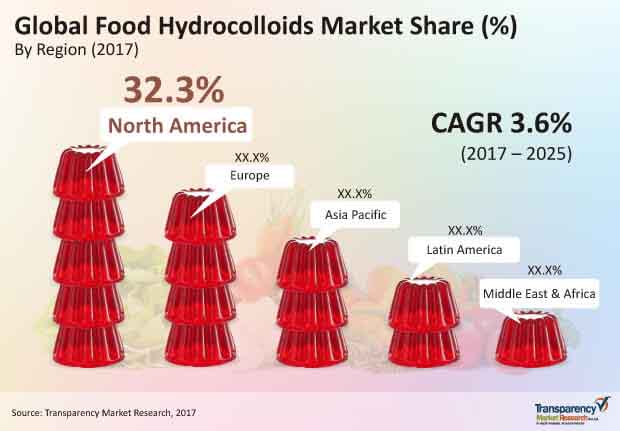
As per a report by Transparency Market Research, the global food hydrocolloids market is likely to expand at a CAGR of 3.6% between 2017 and 2025, for the market to be valued at US$7,634.0 mn by the end of 2025.
Bakery and Confectionery Application Segment to Display Leading Growth Rate
The segments into which the global food hydrocolloids market is classified based on source type are plant source, microbial source, seaweed source, animal, and synthetic. Amongst all, the segment of plant source is expected to hold 37.4% of the overall market by the end of 2017.
In terms of function, the segments of the global food hydrocolloids market include thickener, stabilizer, emulsifier, gelling, coating, and others. Thickener, amongst all, is expected to lead the market over the forecast period.
The segments of the global food hydrocolloids market based on application that are covered in this report are bakery and confectionery, meat & poultry, sauces & dressings, beverages, dairy products, and others. Amongst all, bakery and confectionery is anticipated to display the leading CAGR of 4.8% between 2017 and 2025. This will be followed by meat and poultry at a CAGR of 3.6% over the forecast period.
Increasing Uptake of Ready-to-eat Meals Makes Asia Pacific Significant Market
The key segments into which the global food hydrocolloids market is divided based upon geography are North America, Europe, Latin America, Asia Pacific excluding Japan, Oceania, Japan, and the Middle East and Africa.
North America presently holds supremacy in the global food hydrocolloids market. The regional market of North America is expected to expand at a CAGR of 4.0% between 2017 and 2025. Progressing at this pace, the region is expected to gain significantly vis-à-vis revenue by the end of 2025.
Asia Pacific is expected to display 3.6% CAGR between 2017 and 2025. The increased concentration of product manufacturers in the developing countries of Asia Pacific accounts as one of the key factors for the growth of this region. The rising working class population in the region that is increasingly adopting convenience foods to match their busy lifestyle is displaying demand for functional ingredients that are used in these foods. Thus, the market for food hydrocolloids is benefitted.
Latin America and the Middle East and Africa are expected to trail Europe with respect to growth rate over the forecast period.
Some of the prominent participants in the global food hydrocolloids market include De Pont De Nemours & Company, Cargill Incorporated, Darling Ingredients, Kerry Group plc, CP Kelco, Fuerst Day Lawson, Ingredion Incorporated, Ashland Inc., Koninklijke DSM N.V., Rico Carrageenan, Archer Daniels Midland Company, Hispanagar, S.A, CEAMSA, FMC Corporation, Lubrizol Corporation, Jungbunzlauer, B&V SRL, Tate and Lyle PLC and Fiberstar, Inc.
Multiple Applications in the Food and Beverage Industry to Boost Food Hydrocolloids Market
Food hydrocolloids refer to various food additives utilized in the food processing method to increase shelf life and better its quality. Hydrocolloids are made of finely divided particles that are dispersed in water and these are colloidal in nature. They exist in two different forms, such as gels/sols but it depends on the quantity of the water in which particles are spread and they come out in just one single form. Rising use of these products in the food and beverage sector are likely to foster development of the global food hydrocolloids market in the forthcoming years.
Augmented Demand for Healthy Food Products to Propel Growth of the Market
Food and beverage sector is one of the leading end users of hydrocolloids, thanks to their ability to alter rheology of the system they have been added to. In addition to that, food hydrocolloids act as important ingredients in the food and beverage sector. Some important uses of the additive comprise gelling agents, thickening agents, emulsifying agents, and many others. These hydrocolloids are extracted from microbial, animals, and plants in the nature. They can be easily synthesized through a chemical reaction, and then used for a wide range of applications. As such, food hydrocolloids come with both chemical and natural sources. Riding on the back of its rising demand, the global food hydrocolloids market is expected to register considerable growth over the timeframe of analysis.
There has been a rising demand for healthy food items, which plays an important role in bolstering the expansion of the food and beverage sector. With the flourishing business of this industry, it is expected that new growth opportunities are likely to emerge for the global food hydrocolloids market in the near future. Consumers are now more than willing to spend extra on food items that are healthy, which is likely to augur well for the global food hydrocolloids market.
1. Global Food Hydrocolloids Market - Executive Summary
1.1. Global Food Hydrocolloids Market Country Analysis
1.2. Vertical Specific Market Penetration
1.3. Application – Product Mapping
1.4. Competition Blueprint
1.5. TMR Analysis and Recommendations
2. Market Overview
2.1. Market Introduction
2.2. Market Definition
2.3. Market Taxonomy
3. Market Dynamics
3.1. Macro-economic Factors
3.1.1. Global GDP Growth Outlook
3.1.2. Regional Production Vs. Consumption
3.1.3. Per Capita Disposable Income
3.1.4. Global Retail Dynamics
3.1.5. Business Environment Outlook
3.1.6. Economic Outlook
3.1.7. Political Outlook
3.2. Drivers
3.2.1. Expansion of Ready Meal and Convenience Food Market- Catalyzing Food Hydrocolloids Demand
3.2.2. Associated Health Benefits of Food Hydrocolloids
3.2.3. Increasing Food and Beverage Industry
3.3. Market Restraints
3.3.1. Potential Market Predominantly Using Conventional Ingredient, Inhibiting Growth
3.3.2. Limited Consumer Awareness and Product Positioning
3.3.3. Increasing Awareness for Animal Feed and Feed Additives
3.4. Market Trends
3.4.1. Fluctuating Input Costs
3.4.2. Adoption of RFID technology
3.4.3. Technology Advancements
3.5. Trend Analysis- Impact on Time Line (2018-2026)
3.6. Forecast Factors – Relevance and Impact
3.7. Key Regulations and Claims
3.7.1. Food Packaging Claims
3.7.2. Labeling and Claims
3.7.3. Import/Export Regulations
3.8. List of Market Participants
4. Associated Industry and Key Indicator Assessment
4.1. Parent Industry Overview
4.1.1. Market Size and Forecast
4.1.2. Market Size and Y-o-Y Growth
4.1.3. Absolute $ Opportunity
5. Supply Chain Analysis
5.1. Profitability and Gross Margin Analysis By Competition
5.2. List of Active Participants- By Region
5.2.1. Raw Material Suppliers
5.2.2. Key Manufacturers
5.2.3. Key Distributor/Retailers
5.2.4. Operating Margins
6. Global Food Hydrocolloids Market Pricing Analysis
6.1. Price Point Assessment by Product Type
6.2. Regional Average Pricing Analysis
6.2.1. North America
6.2.2. Latin America
6.2.3. Europe
6.2.4. Asia Pacific Ex. Japan (APEJ)
6.2.5. Japan
6.2.6. Oceania
6.2.7. Middle East and Africa
6.3. Price Forecast till 2027
6.4. Factors Influencing Pricing
7. Global Food Hydrocolloids Market Analysis and Forecast
7.1. Market Size Analysis (2013-2017) and Forecast (2018-2026)
7.1.1. Market Value (US$ Mn) and Volume (Tons) and Y-o-Y Growth
7.1.2. Absolute $ Opportunity
7.2. Global Food Hydrocolloids Market Scenario Forecast (Optimistic, Likely and Conservative Market Conditions)
7.2.1. Forecast Factors and Relevance of Impact
7.2.2. Regional Food Hydrocolloids Market Business Performance Summary
8. Global Food Hydrocolloids Market Analysis By Source
8.1. Introduction
8.1.1. Y-o-Y Growth Comparison By Source
8.1.2. Basis Point Share (BPS) Analysis By Source
8.2. Food Hydrocolloids Market Size (US$ Mn) and Volume (MT) Analysis (2013-2017) & Forecast (2018-2026) By Source
8.2.1. Plant Hydrocolloids
8.2.2. Seaweed Hydrocolloid
8.2.3. Microbial Hydrocolloid
8.2.4. Animal Hydrocolloid
8.2.5. Chemically Modified Hydrocolloid
8.3. Market Attractiveness Analysis By Source
9. Global Food Hydrocolloids Market Analysis By Type
9.1. Introduction
9.1.1. Y-o-Y Growth Comparison By Type
9.1.2. Basis Point Share (BPS) Analysis By Type
9.2. Food Hydrocolloids Market Size (US$ Mn) and Volume (MT) Analysis (2013-2017) & Forecast (2018-2026) By Type
9.2.1. Cellulose and Derivatives
9.2.2. Hemicellulose
9.2.3. Pectin
9.2.4. Exudate Gums
9.2.5. Mucilage Gum
9.2.6. Fructan
9.2.7. Carrageenan
9.2.8. Agar
9.2.9. Xanthan Gum
9.2.10. Pullulan
9.2.11. Gellan Gum
9.2.12. Chitin and Chitosan
9.2.13. Gelatin
9.2.14. Others
9.3. Market Attractiveness Analysis By Type
10. Global Food Hydrocolloids Market Analysis By Application
10.1. Introduction
10.1.1. Y-o-Y Growth Comparison By Application
10.1.2. Basis Point Share (BPS) Analysis By Application
10.2. Food Hydrocolloids Market Size (US$ Mn) and Volume (MT) Analysis (2013-2017) & Forecast (2018-2026) By Application
10.2.1. Bakery and Confectionery
10.2.2. Meat and Poultry
10.2.3. Sauces and Dressings
10.2.4. Beverages
10.2.5. Dairy Products
10.2.6. Frozen Products
10.2.7. Others
10.3. Market Attractiveness Analysis By Application
11. Global Food Hydrocolloids Market Analysis By Function
11.1. Introduction
11.1.1. Y-o-Y Growth Comparison By Function
11.1.2. Basis Point Share (BPS) Analysis By Function
11.2. Food Hydrocolloids Market Size (US$ Mn) and Volume (MT) Analysis (2013-2017) & Forecast (2018-2026) By Function
11.2.1. Thickening
11.2.2. Stabilization
11.2.3. Emulsification
11.2.4. Gelling
11.2.5. Coating
11.2.6. Others
11.3. Market Attractiveness Analysis By Function
12. Global Food Hydrocolloids Market Analysis and Forecast, By Region
12.1. Introduction
12.1.1. Basis Point Share (BPS) Analysis By Region
12.1.2. Y-o-Y Growth Projections By Region
12.2. Food Hydrocolloids Market Size (US$ Mn) and Volume (MT) & Forecast (2018-2026) Analysis By Region
12.2.1. North America
12.2.2. Europe
12.2.3. APEJ
12.2.4. Japan
12.2.5. Oceania
12.2.6. Latin America
12.2.7. Middle East and Africa
12.3. Market Attractiveness Analysis By Region
13. North America Food Hydrocolloids Market Analysis and Forecast
13.1. Introduction
13.1.1. Basis Point Share (BPS) Analysis By Country
13.1.2. Y-o-Y Growth Projections By Country
13.2. Food Hydrocolloids Market Size (Value (US$) and Volume (MT) Analysis (2013-2018) and Forecast (2018-2026)
13.2.1. Market Attractiveness By Country
13.2.1.1. U.S.
13.2.1.2. Canada
13.2.2. By Source
13.2.3. By Type
13.2.4. By Application
13.2.5. By Function
13.3. Market Attractiveness Analysis
13.3.1. By Country
13.3.2. By Source
13.3.3. By Type
13.3.4. By Application
13.3.5. By Function
13.4. Drivers and Restraints: Impact Analysis
14. Latin America Food Hydrocolloids Market Analysis and Forecast
14.1. Introduction
14.1.1. Basis Point Share (BPS) Analysis By Country
14.1.2. Y-o-Y Growth Projections By Country
14.1.3. Key Regulations
14.2. Food Hydrocolloids Market Size (Value (US$) and Volume (MT) Analysis (2013-2018) and Forecast (2018-2026)
14.2.1. By Country
14.2.1.1. Brazil
14.2.1.2. Mexico
14.2.1.3. Chile
14.2.1.4. Peru
14.2.1.5. Argentina
14.2.1.6. Rest of Latin America
14.2.2. By Source
14.2.3. By Type
14.2.4. By Application
14.2.5. By Function
14.3. Market Attractiveness Analysis
14.3.1. By Country
14.3.2. By Source
14.3.3. By Type
14.3.4. By Application
14.3.5. By Function
14.4. Drivers and Restraints: Impact Analysis
15. Europe Food Hydrocolloids Market Analysis and Forecast
15.1. Introduction
15.1.1. Basis Point Share (BPS) Analysis By Country
15.1.2. Y-o-Y Growth Projections By Country
15.1.3. Key Regulations
15.2. Food Hydrocolloids Market Size (Value (US$) and Volume (MT) Analysis (2013-2018) and Forecast (2018-2026)
15.2.1. By Country
15.2.1.1. EU-4 (Germany, France, Italy, Spain)
15.2.1.2. U.K.
15.2.1.3. BENELUX
15.2.1.4. Nordic
15.2.1.5. Russia
15.2.1.6. Poland
15.2.1.7. Rest of Europe
15.2.2. By Source
15.2.3. By Type
15.2.4. By Application
15.2.5. By Function
15.3. Market Attractiveness Analysis
15.3.1. By Country
15.3.2. By Source
15.3.3. By Type
15.3.4. By Application
15.3.5. By Function
15.4. Drivers and Restraints: Impact Analysis
16. APEJ Food Hydrocolloids Market Analysis and Forecast
16.1. Introduction
16.1.1. Basis Point Share (BPS) Analysis By Country
16.1.2. Y-o-Y Growth Projections By Country
16.1.3. Key Regulations
16.2. Food Hydrocolloids Market Size (Value (US$) and Volume (MT) Analysis (2013-2018) and Forecast (2018-2026)
16.2.1. By Country
16.2.1.1. China
16.2.1.2. India
16.2.1.3. South Korea
16.2.1.4. ASEAN
16.2.2. By Source
16.2.3. By Type
16.2.4. By Application
16.2.5. By Function
16.3. Market Attractiveness Analysis
16.3.1. By Country
16.3.2. By Source
16.3.3. By Type
16.3.4. By Application
16.3.5. By Function
16.4. Drivers and Restraints: Impact Analysis
17. Japan Food Hydrocolloids Market Analysis and Forecast
17.1. Introduction
17.1.1. Basis Point Share (BPS) Analysis By Country
17.1.2. Y-o-Y Growth Projections By Country
17.1.3. Key Regulations
17.2. Food Hydrocolloids Market Size (Value (US$) and Volume (MT) Analysis (2013-2018) and Forecast (2018-2026)
17.2.1. By Source
17.2.2. By Type
17.2.3. By Application
17.2.4. By Function
17.3. Market Attractiveness Analysis
17.3.1. By Source
17.3.2. By Type
17.3.3. By Application
17.3.4. By Function
17.4. Drivers and Restraints: Impact Analysis
18. Oceania Food Hydrocolloids Market Analysis and Forecast
18.1. Introduction
18.1.1. Basis Point Share (BPS) Analysis By Country
18.1.2. Y-o-Y Growth Projections By Country
18.1.3. Key Regulations
18.2. Food Hydrocolloids Market Size (Value (US$) and Volume (MT) Analysis (2013-2018) and Forecast (2018-2026)
18.2.1. By Source
18.2.2. By Type
18.2.3. By Application
18.2.4. By Function
18.3. Market Attractiveness Analysis
18.3.1. By Source
18.3.2. By Type
18.3.3. By Application
18.3.4. By Function
18.4. Drivers and Restraints: Impact Analysis
19. Middle East and Africa (MEA) Food Hydrocolloids Market Analysis and Forecast
19.1. Introduction
19.1.1. Basis Point Share (BPS) Analysis By Country
19.1.2. Y-o-Y Growth Projections By Country
19.1.3. Key Regulations
19.2. Food Hydrocolloids Market Size (Value (US$) and Volume (MT) Analysis (2013-2018) and Forecast (2018-2026)
19.2.1. By Country
19.2.1.1. GCC Countries
19.2.1.2. South Africa
19.2.1.3. North Africa
19.2.1.4. Rest of MEA
19.2.2. By Source
19.2.3. By Type
19.2.4. By Application
19.2.5. By Function
19.3. Market Attractiveness Analysis
19.3.1. By Country
19.3.2. By Source
19.3.3. By Type
19.3.4. By Application
19.3.5. By Function
19.4. Drivers and Restraints: Impact Analysis
20. Competition Assessment
20.1. Global Food Hydrocolloids Market Competition - a Dashboard View
20.2. Global Food Hydrocolloids Market Structure Analysis
20.3. Global Food Hydrocolloids Market Company Share Analysis
20.3.1. For Tier 1 Market Players, 2017
20.3.2. Company Market Share Analysis of Top 10 Players
20.4. Key Participants Market Presence (Intensity Mapping) by Region
21. Brand Assessment
21.1. Brand Identity (Brand as Product, Brand as Organization, Brand as Person, Brand as Symbol)
21.2. Food Hydrocolloids Audience and Positioning (Demographic Segmentation, Geographic Segmentation, Psychographic Segmentation, Situational Segmentation)
21.3. Brand Strategy
22. Competition Deep-dive (Manufacturers/Suppliers)
22.1. Dupont De Nemours and Company
22.1.1. Overview
22.1.2. Product Portfolio
22.1.3. Sales Footprint
22.1.4. Channel Footprint
22.1.4.1. Distributors List
22.1.4.2. Sales Channel (Clients)
22.1.5. Strategy Overview
22.1.5.1. Marketing Strategy
22.1.5.2. Culture Strategy
22.1.5.3. Channel Strategy
22.1.6. SWOT Analysis
22.1.7. Financial Analysis
22.1.8. Revenue Share
22.1.8.1. By Type
22.1.8.2. By Region
22.1.9. Key Clients
22.1.10. Analyst Comments
22.2. Cargill, Incorporated.
22.3. Darling Ingredients Inc.
22.4. Kerry Group PLC
22.5. CP Kelco.
22.6. Ashland Inc.
22.7. Fuerst Day Lawson
22.8. Ingredion Incorporated
22.9. Koninklijke DSM N.V.
22.10. Rico Carrageenan (W Hydrocolloids, Inc.)
22.11. Archer Daniels Midland Company.
22.12. Hispanagar, S.A
22.13. CEAMSA
22.14. FMC Corporation
22.15. Lubrizol Corporation
22.16. Jungbunzlauer
22.17. B&V SRL
22.18. Tate and Lyle PLC
22.19. Fiberstar, Inc.
22.20. Others (On Request)
23. Recommendation- Critical Success Factors
24. Research Methodology
25. Assumptions & Acronyms Used
Table 1: Global Food Hydrocolloids Market Value (US$ Mn) Analysis and Forecast by Region, 2017-2026
Table 2: Global Food Hydrocolloids Market Volume (MT) Analysis and Forecast by Region, 2017-2026
Table 3: Global Food Hydrocolloids Market Value (US$ Mn) Analysis and Forecast by Source, 2017-2026
Table 4: Global Food Hydrocolloids Market Volume (MT) Analysis and Forecast by Source, 2017-2026
Table 5: Global Food Hydrocolloids Market Value (US$ Mn) Analysis and Forecast by Function, 2017-2026
Table 6: Global Food Hydrocolloids Market Volume (MT) Analysis and Forecast by Function, 2017-2026
Table 7: Global Food Hydrocolloids Market Value (US$ Mn) Analysis and Forecast by Type 2017-2026
Table 8: Global Food Hydrocolloids Market Volume (MT) Analysis and Forecast by Type, 2017-2026
Table 9: Global Food Hydrocolloids Market Value (US$) Analysis and Forecast by Application, 2017-2026
Table 10: Global Food Hydrocolloids Market Volume (MT) Analysis and Forecast by Application, 2017-2026
Table 11: North America Food Hydrocolloids Market Value (US$ Mn) Analysis and Forecast by Country, 2017-2026
Table 12: North America Food Hydrocolloids Market Volume (MT) Analysis and Forecast by Country, 2017-2026
Table 13: North America Food Hydrocolloids Market Value (US$ Mn) Analysis and Forecast by Source, 2017-2026
Table 14: North America Food Hydrocolloids Market Volume (MT) Analysis and Forecast by Source, 2017-2026
Table 15: North America Food Hydrocolloids Market Value (US$) Analysis and Forecast by Function, 2017-2026
Table 16: North America Food Hydrocolloids Market Volume (MT) Analysis and Forecast by Function, 2017-2026
Table 17: North America Food Hydrocolloids Market Value (US$ Mn) Analysis and Forecast by Type, 2017-2026
Table 18: North America Food Hydrocolloids Market Volume (MT) Analysis and Forecast by Type, 2017-2026
Table 19: North America Food Hydrocolloids Market Value (US$ Mn) Analysis and Forecast by Application, 2017-2026
Table 20: North America Food Hydrocolloids Market Volume (MT) Analysis and Forecast by Application, 2017-2026
Table 21: Latin America Food Hydrocolloids Market Value (US$ Mn) Analysis and Forecast by Country, 2017-2026
Table 22: Latin America Food Hydrocolloids Market Volume (MT) Analysis and Forecast by Country, 2017-2026
Table 23: Latin America Food Hydrocolloids Market Value (US$ Mn) Analysis and Forecast by Source, 2017-2026
Table 24: Latin America Food Hydrocolloids Market Volume (MT) Analysis and Forecast by Source, 2017-2026
Table 25: Latin America Food Hydrocolloids Market Value (US$) Analysis and Forecast by Function, 2017-2026
Table 26: Latin America Food Hydrocolloids Market Volume (MT) Analysis and Forecast by Function, 2017-2026
Table 27: Latin America Food Hydrocolloids Market Value (US$ Mn) Analysis and Forecast by Type, 2017-2026
Table 28: Latin America Food Hydrocolloids Market Volume (MT) Analysis and Forecast by Type, 2017-2026
Table 29: Latin America Food Hydrocolloids Market Value (US$ Mn) Analysis and Forecast by Application, 2017-2026
Table 30: Latin America Food Hydrocolloids Market Volume (MT) Analysis and Forecast by Application, 2017-2026
Table 31: Europe Food Hydrocolloids Market Value (US$ Mn) Analysis and Forecast by Country, 2017-2026
Table 32: Europe Food Hydrocolloids Market Volume (MT) Analysis and Forecast by Country, 2017-2026
Table 33: Europe Food Hydrocolloids Market Value (US$ Mn) Analysis and Forecast by Source, 2017-2026
Table 34: Europe Food Hydrocolloids Market Volume (MT) Analysis and Forecast by Source, 2017-2026
Table 35: Europe Food Hydrocolloids Market Value (US$) Analysis and Forecast by Function, 2017-2026
Table 36: Europe Food Hydrocolloids Market Volume (MT) Analysis and Forecast by Function, 2017-2026
Table 37: Europe Food Hydrocolloids Market Value (US$ Mn) Analysis and Forecast by Type, 2017-2026
Table 38: Europe Food Hydrocolloids Market Volume (MT) Analysis and Forecast by Type, 2017-2026
Table 39: Europe Food Hydrocolloids Market Value (US$ Mn) Analysis and Forecast by Application, 2017-2026
Table 40: Europe Food Hydrocolloids Market Volume (MT) Analysis and Forecast by Application, 2017-2026
Table 41: APEJ Food Hydrocolloids Market Value (US$ Mn) Analysis and Forecast by Country, 2017-2026
Table 42: APEJ Food Hydrocolloids Market Volume (MT) Analysis and Forecast by Country, 2017-2026
Table 43: APEJ Food Hydrocolloids Market Value (US$ Mn) Analysis and Forecast by Source, 2017-2026
Table 44: APEJ Food Hydrocolloids Market Volume (MT) Analysis and Forecast by Source, 2017-2026
Table 45: APEJ Food Hydrocolloids Market Value (US$) Analysis and Forecast by Function, 2017-2026
Table 46: APEJ Food Hydrocolloids Market Volume (MT) Analysis and Forecast by Function, 2017-2026
Table 47: APEJ Food Hydrocolloids Market Value (US$ Mn) Analysis and Forecast by Type, 2017-2026
Table 48: APEJ Food Hydrocolloids Market Volume (MT) Analysis and Forecast by Type, 2017-2026
Table 49: APEJ Food Hydrocolloids Market Value (US$ Mn) Analysis and Forecast by Application, 2017-2026
Table 50: APEJ Food Hydrocolloids Market Volume (MT) Analysis and Forecast by Application, 2017-2026
Table 51: MEA Food Hydrocolloids Market Value (US$ Mn) Analysis and Forecast by Country, 2017-2026
Table 52: MEA Food Hydrocolloids Market Volume (MT) Analysis and Forecast by Country, 2017-2026
Table 53: MEA Food Hydrocolloids Market Value (US$ Mn) Analysis and Forecast by Source, 2017-2026
Table 54: MEA Food Hydrocolloids Market Volume (MT) Analysis and Forecast by Source, 2017-2026
Table 55: MEA Food Hydrocolloids Market Value (US$) Analysis and Forecast by Function, 2017-2026
Table 56: MEA Food Hydrocolloids Market Volume (MT) Analysis and Forecast by Function, 2017-2026
Table 57: MEA Food Hydrocolloids Market Value (US$ Mn) Analysis and Forecast by Type, 2017-2026
Table 58: MEA Food Hydrocolloids Market Volume (MT) Analysis and Forecast by Type, 2017-2026
Table 59: MEA Food Hydrocolloids Market Value (US$ Mn) Analysis and Forecast by Application, 2017-2026
Table 60: MEA Food Hydrocolloids Market Volume (MT) Analysis and Forecast by Application, 2017-2026
Table 61: Oceania Food Hydrocolloids Market Value (US$ Mn) Analysis and Forecast by Source, 2017-2026
Table 62: Oceania Food Hydrocolloids Market Volume (MT) Analysis and Forecast by Source, 2017-2026
Table 63: Oceania Food Hydrocolloids Market Value (US$) Analysis and Forecast by Function, 2017-2026
Table 64: Oceania Food Hydrocolloids Market Volume (MT) Analysis and Forecast by Function, 2017-2026
Table 65: Oceania Food Hydrocolloids Market Value (US$ Mn) Analysis and Forecast by Type, 2017-2026
Table 66: Oceania Food Hydrocolloids Market Volume (MT) Analysis and Forecast by Type, 2017-2026
Table 67: Oceania Food Hydrocolloids Market Value (US$ Mn) Analysis and Forecast by Application, 2017-2026
Table 68: Oceania Food Hydrocolloids Market Volume (MT) Analysis and Forecast by Application, 2017-2026
Table 69: Japan Food Hydrocolloids Market Value (US$ Mn) Analysis and Forecast by Source, 2017-2026
Table 70: Japan Food Hydrocolloids Market Volume (MT) Analysis and Forecast by Source, 2017-2026
Table 71: Japan Food Hydrocolloids Market Value (US$) Analysis and Forecast by Function, 2017-2026
Table 72: Japan Food Hydrocolloids Market Volume (MT) Analysis and Forecast by Function, 2017-2026
Table 73: Japan Food Hydrocolloids Market Value (US$ Mn) Analysis and Forecast by Type, 2017-2026
Table 74: Japan Food Hydrocolloids Market Volume (MT) Analysis and Forecast by Type, 2017-2026
Table 75: Japan Food Hydrocolloids Market Value (US$ Mn) Analysis and Forecast by Application, 2017-2026
Table 76: Japan Food Hydrocolloids Market Volume (MT) Analysis and Forecast by Application, 2017-2026
Figure 1: Global Food Hydrocolloids Market Value (US$ Mn) and Volume (MT) Forecast, 2018–2026
Figure 2: Global Food Hydrocolloids Market Absolute $ Opportunity (US$ Mn), 2018–2026
Figure 3: Global Food Hydrocolloids Market Share (%) & BPS Analysis by Region, 2018 & 2026
Figure 4: Global Food Hydrocolloids Market Y-o-Y Growth Rate (%) by Region, 2018-2026
Figure 5: Global Food Hydrocolloids Market Value (US$ Mn) Analysis & Forecast by Region, 2018–2026
Figure 6: Global Food Hydrocolloids Market Attractiveness Index by Region, 2018-2026
Figure 7: Global Food Hydrocolloids Market Share (%) & BPS Analysis by Source, 2018 & 2026
Figure 8: Global Food Hydrocolloids Market Y-o-Y Growth Rate (%) by Source, 2018-2026
Figure 9: Global Food Hydrocolloids Market Value (US$ Mn) Analysis & Forecast by Source, 2018–2026
Figure 10: Global Food Hydrocolloids Market Attractiveness Index by Source, 2018-2026
Figure 11: Global Food Hydrocolloids Market Share (%) & BPS Analysis by Function, 2018 & 2026
Figure 12: Global Food Hydrocolloids Market Y-o-Y Growth Rate (%) by Function, 2018-2026
Figure 13: Global Food Hydrocolloids Market Value (US$ Mn) Analysis & Forecast by Function, 2018–2026
Figure 14: Global Food Hydrocolloids Market Attractiveness Index by Function, 2018-2026
Figure 15: Global Food Hydrocolloids Market Share (%) & BPS Analysis by Type, 2018 & 2026
Figure 16: Global Food Hydrocolloids Market Y-o-Y Growth Rate (%) by Type, 2018-2026
Figure 17: Global Food Hydrocolloids Market Value (US$ Mn) Analysis & Forecast by Type, 2018–2026
Figure 18: Global Food Hydrocolloids Market Attractiveness Index by Type, 2018-2026
Figure 19: Global Food Hydrocolloids Market Share (%) & BPS Analysis by Application, 2018 & 2026
Figure 20: Global Food Hydrocolloids Market Y-o-Y Growth Rate (%) by Application, 2018-2026
Figure 21: Global Food Hydrocolloids Market Value (US$ Mn) Analysis & Forecast by Application, 2018–2026
Figure 22: Global Food Hydrocolloids Market Attractiveness Index by Application, 2018-2026
Figure 23: North America Food Hydrocolloids Market Share (%) & BPS Analysis by Country, 2018 & 2026
Figure 24: North America Food Hydrocolloids Market Y-o-Y Growth Rate (%) by Country, 2018-2026
Figure 25: North America Food Hydrocolloids Market Attractiveness Index by Country, 2018-2026
Figure 26: North America Food Hydrocolloids Market Share (%) & BPS Analysis by Source, 2018 & 2026
Figure 27: North America Food Hydrocolloids Market Y-o-Y Growth Rate (%) by Source, 2018-2026
Figure 28: North America Food Hydrocolloids Market Attractiveness Index by Source, 2018-2026
Figure 29: North America Food Hydrocolloids Market Share (%) & BPS Analysis by Function, 2018 & 2026
Figure 30: North America Food Hydrocolloids Market Y-o-Y Growth Rate (%) by Function, 2018-2026
Figure 31: North America Food Hydrocolloids Market Attractiveness Index by Function, 2018-2026
Figure 32: North America Food Hydrocolloids Market Share (%) & BPS Analysis by Type, 2018 & 2026
Figure 33: North America Food Hydrocolloids Market Y-o-Y Growth Rate (%) by Type, 2018-2026
Figure 34: North America Food Hydrocolloids Market Attractiveness Index by Type, 2018-2026
Figure 35: North America Food Hydrocolloids Market Share (%) & BPS Analysis by Application, 2018 & 2026
Figure 36: North America Food Hydrocolloids Market Y-o-Y Growth Rate (%) by Application, 2018-2026
Figure 37: North America Food Hydrocolloids Market Attractiveness Index by Application, 2018-2026
Figure 38: Latin America Food Hydrocolloids Market Share (%) & BPS Analysis by Country, 2018 & 2026
Figure 39: Latin America Food Hydrocolloids Market Y-o-Y Growth Rate (%) by Country, 2018-2026
Figure 40: Latin America Food Hydrocolloids Market Attractiveness Index by Country, 2018-2026
Figure 41: Latin America Food Hydrocolloids Market Share (%) & BPS Analysis by Source, 2018 & 2026
Figure 42: Latin America Food Hydrocolloids Market Y-o-Y Growth Rate (%) by Source, 2018-2026
Figure 43: Latin America Food Hydrocolloids Market Attractiveness Index by Source, 2018-2026
Figure 44: Latin America Food Hydrocolloids Market Share (%) & BPS Analysis by Function, 2018 & 2026
Figure 45: Latin America Food Hydrocolloids Market Y-o-Y Growth Rate (%) by Function, 2018-2026
Figure 46: Latin America Food Hydrocolloids Market Attractiveness Index by Function, 2018-2026
Figure 47: Latin America Food Hydrocolloids Market Share (%) & BPS Analysis by Type, 2018 & 2026
Figure 48: Latin America Food Hydrocolloids Market Y-o-Y Growth Rate (%) by Type, 2018-2026
Figure 49: Latin America Food Hydrocolloids Market Attractiveness Index by Type, 2018-2026
Figure 50: Latin America Food Hydrocolloids Market Share (%) & BPS Analysis by Application, 2018 & 2026
Figure 51: Latin America Food Hydrocolloids Market Y-o-Y Growth Rate (%) by Application, 2018-2026
Figure 52: Latin America Food Hydrocolloids Market Attractiveness Index by Application, 2018-2026
Figure 53: Europe Food Hydrocolloids Market Share (%) & BPS Analysis by Country, 2018 & 2026
Figure 54: Europe Food Hydrocolloids Market Y-o-Y Growth Rate (%) by Country, 2018-2026
Figure 55: Europe Food Hydrocolloids Market Attractiveness Index by Country, 2018-2026
Figure 56: Europe Food Hydrocolloids Market Share (%) & BPS Analysis by Source, 2018 & 2026
Figure 57: Europe Food Hydrocolloids Market Y-o-Y Growth Rate (%) by Source, 2018-2026
Figure 58: Europe Food Hydrocolloids Market Attractiveness Index by Source, 2018-2026
Figure 59: Europe Food Hydrocolloids Market Share (%) & BPS Analysis by Function, 2018 & 2026
Figure 60: Europe Food Hydrocolloids Market Y-o-Y Growth Rate (%) by Function, 2018-2026
Figure 61: Europe Food Hydrocolloids Market Attractiveness Index by Function, 2018-2026
Figure 62: Europe Food Hydrocolloids Market Share (%) & BPS Analysis by Type, 2018 & 2026
Figure 63: Europe Food Hydrocolloids Market Y-o-Y Growth Rate (%) by Type, 2018-2026
Figure 64: Europe Food Hydrocolloids Market Attractiveness Index by Type, 2018-2026
Figure 65: Europe Food Hydrocolloids Market Share (%) & BPS Analysis by Application, 2018 & 2026
Figure 66: Europe Food Hydrocolloids Market Y-o-Y Growth Rate (%) by Application, 2018-2026
Figure 67: Europe Food Hydrocolloids Market Attractiveness Index by Application, 2018-2026
Figure 68: APEJ Food Hydrocolloids Market Share (%) & BPS Analysis by Country, 2018 & 2026
Figure 69: APEJ Food Hydrocolloids Market Y-o-Y Growth Rate (%) by Country, 2018-2026
Figure 70: APEJ Food Hydrocolloids Market Attractiveness Index by Country, 2018-2026
Figure 71: APEJ Food Hydrocolloids Market Share (%) & BPS Analysis by Source, 2018 & 2026
Figure 72: APEJ Food Hydrocolloids Market Y-o-Y Growth Rate (%) by Source, 2018-2026
Figure 73: APEJ Food Hydrocolloids Market Attractiveness Index by Source, 2018-2026
Figure 74: APEJ Food Hydrocolloids Market Share (%) & BPS Analysis by Function, 2018 & 2026
Figure 75: APEJ Food Hydrocolloids Market Y-o-Y Growth Rate (%) by Function, 2018-2026
Figure 76: APEJ Food Hydrocolloids Market Attractiveness Index by Function, 2018-2026
Figure 77: APEJ Food Hydrocolloids Market Share (%) & BPS Analysis by Type, 2018 & 2026
Figure 78: APEJ Food Hydrocolloids Market Y-o-Y Growth Rate (%) by Type, 2018-2026
Figure 79: APEJ Food Hydrocolloids Market Attractiveness Index by Type, 2018-2026
Figure 80: APEJ Food Hydrocolloids Market Share (%) & BPS Analysis by Application, 2018 & 2026
Figure 81: APEJ Food Hydrocolloids Market Y-o-Y Growth Rate (%) by Application, 2018-2026
Figure 82: APEJ Food Hydrocolloids Market Attractiveness Index by Application, 2018-2026
Figure 83: MEA Food Hydrocolloids Market Share (%) & BPS Analysis by Country, 2018 & 2026
Figure 84: MEA Food Hydrocolloids Market Y-o-Y Growth Rate (%) by Country, 2018-2026
Figure 85: MEA Food Hydrocolloids Market Attractiveness Index by Country, 2018-2026
Figure 86: MEA Food Hydrocolloids Market Share (%) & BPS Analysis by Source, 2018 & 2026
Figure 87: MEA Food Hydrocolloids Market Y-o-Y Growth Rate (%) by Source, 2018-2026
Figure 88: MEA Food Hydrocolloids Market Attractiveness Index by Source, 2018-2026
Figure 89: MEA Food Hydrocolloids Market Share (%) & BPS Analysis by Function, 2018 & 2026
Figure 90: MEA Food Hydrocolloids Market Y-o-Y Growth Rate (%) by Function, 2018-2026
Figure 91: MEA Food Hydrocolloids Market Attractiveness Index by Function, 2018-2026
Figure 92: MEA Food Hydrocolloids Market Share (%) & BPS Analysis by Type, 2018 & 2026
Figure 93: MEA Food Hydrocolloids Market Y-o-Y Growth Rate (%) by Type, 2018-2026
Figure 94: MEA Food Hydrocolloids Market Attractiveness Index by Type, 2018-2026
Figure 95: MEA Food Hydrocolloids Market Share (%) & BPS Analysis by Application, 2018 & 2026
Figure 96: MEA Food Hydrocolloids Market Y-o-Y Growth Rate (%) by Application, 2018-2026
Figure 97: MEA Food Hydrocolloids Market Attractiveness Index by Application, 2018-2026
Figure 98: Oceania Food Hydrocolloids Market Share (%) & BPS Analysis by Source, 2018 & 2026
Figure 99: Oceania Food Hydrocolloids Market Y-o-Y Growth Rate (%) by Source, 2018-2026
Figure 100: Oceania Food Hydrocolloids Market Attractiveness Index by Source, 2018-2026
Figure 101: Oceania Food Hydrocolloids Market Share (%) & BPS Analysis by Function, 2018 & 2026
Figure 102: Oceania Food Hydrocolloids Market Y-o-Y Growth Rate (%) by Function, 2018-2026
Figure 103: Oceania Food Hydrocolloids Market Attractiveness Index by Function, 2018-2026
Figure 104: Oceania Food Hydrocolloids Market Share (%) & BPS Analysis by Type, 2018 & 2026
Figure 105: Oceania Food Hydrocolloids Market Y-o-Y Growth Rate (%) by Type, 2018-2026
Figure 106: Oceania Food Hydrocolloids Market Attractiveness Index by Type, 2018-2026
Figure 107: Oceania Food Hydrocolloids Market Share (%) & BPS Analysis by Application, 2018 & 2026
Figure 108: Oceania Food Hydrocolloids Market Y-o-Y Growth Rate (%) by Application, 2018-2026
Figure 109: Oceania Food Hydrocolloids Market Attractiveness Index by Application, 2018-2026
Figure 110: Japan Food Hydrocolloids Market Share (%) & BPS Analysis by Source, 2018 & 2026
Figure 111: Japan Food Hydrocolloids Market Y-o-Y Growth Rate (%) by Source, 2018-2026
Figure 112: Japan Food Hydrocolloids Market Attractiveness Index by Source, 2018-2026
Figure 113: Japan Food Hydrocolloids Market Share (%) & BPS Analysis by Function, 2018 & 2026
Figure 114: Japan Food Hydrocolloids Market Y-o-Y Growth Rate (%) by Function, 2018-2026
Figure 115: Japan Food Hydrocolloids Market Attractiveness Index by Function, 2018-2026
Figure 116: Japan Food Hydrocolloids Market Share (%) & BPS Analysis by Type, 2018 & 2026
Figure 117: Japan Food Hydrocolloids Market Y-o-Y Growth Rate (%) by Type, 2018-2026
Figure 118: Japan Food Hydrocolloids Market Attractiveness Index by Type, 2018-2026
Figure 119: Japan Food Hydrocolloids Market Share (%) & BPS Analysis by Application, 2018 & 2026
Figure 120: Japan Food Hydrocolloids Market Y-o-Y Growth Rate (%) by Application, 2018-2026
Figure 121: Japan Food Hydrocolloids Market Attractiveness Index by Application, 2018-2026
Copyright © Transparency Market Research, Inc. All Rights reserved
Trust Online

Food Hydrocolloids Market