
Reports
Reports
Customization Key Trend in Floor POP Display Market
Floor point-of-purchase (POP) displays are gaining traction in brand messaging. They have largely emerged as a versatile and cost-effective customer engagement option over the past few years. An array of in-store POP displays have come to the fore in various shapes and sizes to meet the various retail requirements and the strategic leanings of the brand. They must meet various requirements such as preventing toppling over and floor vibrations. This is a key pivot on the expansion of the floor POP display market. Growing demand for customized floor POP displays in retail floor and at events is a key trend bolstering the prospects of the floor POP display market.
Floor POP displays are gaining significance in driving impulsive consumer demand in supermarkets and groceries. The rapid strides of the retail sector in the emerging economies have spurred the need for such brand messaging. Focus of players to develop floor displays that are suitable for printing in finer details has extended the scope of customization, thus opening several lucrative avenues for manufacturers.
A number of materials are used for corrugating, MDF wood, and PVC are propelling the prospects of the floor POP display market. The demand for corrugated POP floor displays is growing. Furthermore, the demand for products and services high-quality floor displays for retail sector in developing and developed regions is propelling the prospects of the floor POP display market.
The demand for multi-tiered POP or corrugated floor displays is expected to open new avenues in the floor POP display market. Furthermore, personalized cardboard floor displays are expected to open new frontiers for various stakeholders. The demand for such products in displaying messaged for beverages, cosmetics, brochures, and technology products is a key trend. Over the years, custom packaging and packaging services are attracting customers in the global floor POP display market.
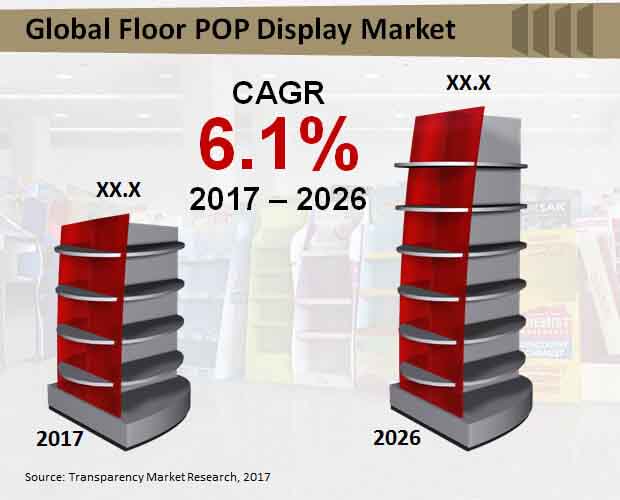
The global floor POP display market has exhibited an upward trend in recent years and this is likely to continue beyond 2017. Floor POP displays are emerging as an effective product merchandising solution in modern retail stores, supermarkets and hypermarkets. The aggressive marketing strategies implemented by brands for reaching out to consumers has led to development of various types of POP displays. Brands are allocating more budgets to their marketing departments, especially for new products, which is creating a need for innovative merchandising solutions. According to a recent report published by Transparency Market Research (TMR), the global floor POP display market is set to soar at an above-average CAGR of 6.1% during the forecast period (2017-2026). Preference for POP display among companies that are engaged in manufacturing and supplying of consumer goods (grocery, food, beverage, electronics, etc.) is significantly high. Floor POP displays are extremely effective when it comes to expediting product visibility.
It is observed that floor POP displays are appealing more to the millennial consumers. Such displays are allowing brands to make the most out of the limited-timed engagement from young consumers with a product in retail outlets. At the same time, POP displays are more convenient for consumers as they give an instantaneous visibility to a product along with information and latest offers. Floor POP displays convey accurate information regarding a product and enable brands to remain consistently in vision. This, in turn, has made it popular in hypermarkets, supermarket, departmental store, specialty store and convenience store. Development of organized retail outlets particularly in emerging economies is anticipated to reflect favourably on the market. Floor POP displays are easy to recycle and thereby have a higher preference as compared to other merchandising solutions. However, factors such as limited reach, changing consumer perception and product orientation is likely to impact the floor POP displays market during the forecast period.
North America Will Continue to Be the Most Attractive Market for Floor POP Display Over 2026
North America is anticipated to retain its predominant position in the global floor POP display market in 2017 and beyond. In terms of revenue, the region continues to make major contributions to the global market. During the forecast period, the North America floor POP display market is projected to exhibit a CAGR of 5.7%. Meanwhile, regions such as Europe, Asia Pacific excluding Japan (APEJ), Latin America, Japan and the Middle East & Africa (MEA) are also expect to witness a considerable rise in product merchandising through floor POP displays.
Preference for Floor POP Display Made of Corrugated Boards will Remain High
Most brands show are higher preference for corrugated board based floor pop display owing to their superior functionally and high convenience. Global sales of corrugated board based floor pop display currently command for nearly 62% market share in terms of revenue. Towards the end 2026, more than US$ 3,400 Mn worth corrugated board based floor pop displays are estimated to be sold worldwide.
Plastic sheet based floor pop displays are also expected gain further popularity during the forecast period. By 2017-end, global sales of plastic sheet based floor pop displays are estimated to account for a sizable revenue share of the global floor POP display market.
Competitive Analysis
Top companies operating in the global floor POP display include Sonoco Products Company, DS Smith Plc, Smurfit Kappa Group PLC, Georgia-Pacific LLC, WestRock Company, FFR Merchandising Company, U.S. Corrugated, Inc., Marketing Alliance Group, Creative Displays Now and Pratt Industries Inc.
Chapter 1 Global Economic Outlook
1.1 Global Packaging Outlook
Chapter 2 Global Floor POP Display Market - Executive Summary
Chapter 3 Global Floor POP Display Market Overview
3.1 Introduction
3.1.1 Global Floor POP Display Market Taxonomy
3.1.2 Global Floor POP Display Market Definition
3.2 Global Floor POP Display Market Size (US$ Mn) and Forecast, 2012-2026
3.2.1 Global Floor POP Display Market Y-o-Y Growth
3.3 Global Floor POP Display Market Dynamics
3.4 Retail Industry- Top 250 Players Quick Statistics
3.5 Top 10 Retailers (2016)
3.6 Geographic Analysis- Retail Industry Analysis
3.7 Retail revenue growth and profitability by region/country, FY2016
3.8 Product Sector Analysis
3.9 Retail revenue growth and profitability by primary product sector, FY2016
3.10 Top 10 Upcoming Retail Outlets
3.11 Global Retail Development Index 2016
3.12 Supply Chain of Floor POP Display Market
3.13 Cost Structure of Floor POP Display Market
3.14 Porter’s Five Forces analysis
3.15 Product Life Cycle of Pallet Display Market
3.16 Consumer Survey
Chapter 4 Global Floor POP Display Market Analysis and Forecast 2012-2026
4.1 Global Floor POP Display Market Size and Forecast By Material Type, 2012-2026
4.1.1 Corrugated Board Market Size and Forecast, 2012-2026
4.1.1.1 Revenue (US$ Mn) Comparison, By Region
4.1.1.2 Market Share Comparison, By Region
4.1.1.3 Y-o-Y growth Comparison, By Region
4.1.2 Foam Board Market Size and Forecast, 2012-2026
4.1.2.1 Revenue (US$ Mn) Comparison, By Region
4.1.2.2 Market Share Comparison, By Region
4.1.2.3 Y-o-Y growth Comparison, By Region
4.1.3 Plastic Sheet Market Size and Forecast, 2012-2026
4.1.3.1 Revenue (US$ Mn) Comparison, By Region
4.1.3.2 Market Share Comparison, By Region
4.1.3.3 Y-o-Y growth Comparison, By Region
4.1.4 Glass Market Size and Forecast, 2012-2026
4.1.4.1 Revenue (US$ Mn) Comparison, By Region
4.1.4.2 Market Share Comparison, By Region
4.1.4.3 Y-o-Y growth Comparison, By Region
4.1.5 Metal Market Size and Forecast, 2012-2026
4.1.5.1 Revenue (US$ Mn) Comparison, By Region
4.1.5.2 Market Share Comparison, By Region
4.1.5.3 Y-o-Y growth Comparison, By Region
4.2 Global Floor POP Display Market Size and Forecast By Application , 2012-2026
4.2.1 Hyper Market Market Size and Forecast, 2012-2026
4.2.1.1 Revenue (US$ Mn) Comparison, By Region
4.2.1.2 Market Share Comparison, By Region
4.2.1.3 Y-o-Y growth Comparison, By Region
4.2.2 Supermarket Market Size and Forecast, 2012-2026
4.2.2.1 Revenue (US$ Mn) Comparison, By Region
4.2.2.2 Market Share Comparison, By Region
4.2.2.3 Y-o-Y growth Comparison, By Region
4.2.3 Departmental store Market Size and Forecast, 2012-2026
4.2.3.1 Revenue (US$ Mn) Comparison, By Region
4.2.3.2 Market Share Comparison, By Region
4.2.3.3 Y-o-Y growth Comparison, By Region
4.2.4 Specialty Store Market Size and Forecast, 2012-2026
4.2.4.1 Revenue (US$ Mn) Comparison, By Region
4.2.4.2 Market Share Comparison, By Region
4.2.4.3 Y-o-Y growth Comparison, By Region
4.2.5 Convenience Store Market Size and Forecast, 2012-2026
4.2.5.1 Revenue (US$ Mn) Comparison, By Region
4.2.5.2 Market Share Comparison, By Region
4.2.5.3 Y-o-Y growth Comparison, By Region
4.2.6 Other Retail Formats Market Size and Forecast, 2012-2026
4.2.6.1 Revenue (US$ Mn) Comparison, By Region
4.2.6.2 Market Share Comparison, By Region
4.2.6.3 Y-o-Y growth Comparison, By Region
4.3 Global Floor POP Display Market Size and Forecast By Packaging Format, 2012-2026
4.3.1 Food & Beverages Market Size and Forecast, 2012-2026
4.3.1.1 Revenue (US$ Mn) Comparison, By Region
4.3.1.2 Market Share Comparison, By Region
4.3.1.3 Y-o-Y growth Comparison, By Region
4.3.2 Cosmetics & Personal Care Market Size and Forecast, 2012-2026
4.3.2.1 Revenue (US$ Mn) Comparison, By Region
4.3.2.2 Market Share Comparison, By Region
4.3.2.3 Y-o-Y growth Comparison, By Region
4.3.3 Pharmaceuticals Market Size and Forecast, 2012-2026
4.3.3.1 Revenue (US$ Mn) Comparison, By Region
4.3.3.2 Market Share Comparison, By Region
4.3.3.3 Y-o-Y growth Comparison, By Region
4.3.4 Printing & Stationary Market Size and Forecast, 2012-2026
4.3.4.1 Revenue (US$ Mn) Comparison, By Region
4.3.4.2 Market Share Comparison, By Region
4.3.4.3 Y-o-Y growth Comparison, By Region
4.3.5 Electronics Market Size and Forecast, 2012-2026
4.3.5.1 Revenue (US$ Mn) Comparison, By Region
4.3.5.2 Market Share Comparison, By Region
4.3.5.3 Y-o-Y growth Comparison, By Region
4.3.6 Automotive Market Size and Forecast, 2012-2026
4.3.6.1 Revenue (US$ Mn) Comparison, By Region
4.3.6.2 Market Share Comparison, By Region
4.3.6.3 Y-o-Y growth Comparison, By Region
4.3.7 Others Market Size and Forecast, 2012-2026
4.3.7.1 Revenue (US$ Mn) Comparison, By Region
4.3.7.2 Market Share Comparison, By Region
4.3.7.3 Y-o-Y growth Comparison, By Region
Chapter 5 North America Floor POP Display Market Size and Forecast, 2012-2026
5.1 Revenue (US$ Mn) Comparison, By Country
5.2 Revenue (US$ Mn) Comparison, By Material Type
5.3 Revenue (US$ Mn) Comparison, By Application
5.4 Revenue (US$ Mn) Comparison, By Packaging Format
Chapter 6 Latin America Floor POP Display Market Size and Forecast, 2012-2026
6.1 Revenue (US$ Mn) Comparison, By Country
6.2 Revenue (US$ Mn) Comparison, By Material Type
6.3 Revenue (US$ Mn) Comparison, By Application
6.4 Revenue (US$ Mn) Comparison, By Packaging Format
Chapter 7 Europe Floor POP Display Market Size and Forecast, 2012-2026
7.1 Revenue (US$ Mn) Comparison, By Country
7.2 Revenue (US$ Mn) Comparison, By Material Type
7.3 Revenue (US$ Mn) Comparison, By Application
7.4 Revenue (US$ Mn) Comparison, By Packaging Format
Chapter 8 Japan Floor POP Display Market Size and Forecast, 2012-2026
8.1 Revenue (US$ Mn) Comparison, By Country
8.2 Revenue (US$ Mn) Comparison, By Material Type
8.3 Revenue (US$ Mn) Comparison, By Application
8.4 Revenue (US$ Mn) Comparison, By Packaging Format
Chapter 9 APEJ Floor POP Display Market Size and Forecast, 2012-2026
9.1 Revenue (US$ Mn) Comparison, By Country
9.2 Revenue (US$ Mn) Comparison, By Material Type
9.3 Revenue (US$ Mn) Comparison, By Application
9.4 Revenue (US$ Mn) Comparison, By Packaging Format
Chapter 10 9. MEA Floor POP Display Market Size and Forecast, 2012-2026
10.1 Revenue (US$ Mn) Comparison, By Country
10.2 Revenue (US$ Mn) Comparison, By Material Type
10.3 Revenue (US$ Mn) Comparison, By Application
10.4 Revenue (US$ Mn) Comparison, By Packaging Format
Chapter 11 Global Floor POP Display Market, Competition Landscape and Company Profiles
11.1 Company Share Analysis for Floor POP Display Market
11.2 Competitive Dashboard for Floor POP Display Market
11.3 Company Profiles for Floor POP Display Market
11.3.1 Sonoco Products Company
11.3.1.1 Company Overview
11.3.1.2 Product Overview
11.3.1.3 Key Financials
11.3.1.4 Key Developments
11.3.1.5 SWOT Analysis
11.3.2 DS Smith PLC
11.3.2.1 Company Overview
11.3.2.2 Product Overview
11.3.2.3 Key Financials
11.3.2.4 Key Developments
11.3.2.5 SWOT Analysis
11.3.3 Smurfit Kappa Group PLC
11.3.3.1 Company Overview
11.3.3.2 Product Overview
11.3.3.3 Key Financials
11.3.3.4 Key Developments
11.3.3.5 SWOT Analysis
11.3.4 Georgia-Pacific LLC
11.3.4.1 Company Overview
11.3.4.2 Product Overview
11.3.4.3 Key Developments
11.3.4.4 SWOT Analysis
11.3.5 WestRock Company
11.3.5.1 Company Overview
11.3.5.2 Product Overview
11.3.5.3 Key Financials
11.3.6 FFR Merchandising Company
11.3.6.1 Company Overview
11.3.6.2 Product Overview
11.3.7 U.S. Corrugated, Inc.
11.3.7.1 Company Overview
11.3.7.2 Product Overview
11.3.8 Marketing Alliance Group
11.3.8.1 Company Overview
11.3.8.2 Product Overview
11.3.9 Creative Displays Now
11.3.9.1 Company Overview
11.3.9.2 Product Overview
11.3.10 Pratt Industries Inc
11.3.10.1 Company Overview
11.3.10.2 Product Overview
Chapter 12 TMR Research Methodology
Chapter 13 Disclaimer and Contact information
List of Tables
TABLE 1 Global Floor POP Display Market Value (US$ Mn), 2012-2017
TABLE 2 Global Floor POP Display Market Value (US$ Mn), 2018-2026
TABLE 3 Global Floor POP Display Market Value (US$ Mn) and Y-o-Y, 2017-2026
TABLE 4 Global Corrugated Board Segment Value (US$ Mn), By Region 2012-2017
TABLE 5 Global Corrugated Board Segment Value (US$ Mn), By Region 2018-2026
TABLE 6 Global Corrugated Board Segment Market Share, By Region 2012-2017
TABLE 7 Global Corrugated Board Segment Market Share, By Region 2018-2026
TABLE 8 Global Corrugated Board Segment Y-o-Y, By Region 2017-2026
TABLE 9 Global Foam Board Segment Value (US$ Mn), By Region 2012-2017
TABLE 10 Global Foam Board Segment Value (US$ Mn), By Region 2018-2026
TABLE 11 Global Foam Board Segment Market Share, By Region 2012-2017
TABLE 12 Global Foam Board Segment Market Share, By Region 2018-2026
TABLE 13 Global Foam Board Segment Y-o-Y, By Region 2017-2026
TABLE 14 Global Plastic Sheet Segment Value (US$ Mn), By Region 2012-2017
TABLE 15 Global Plastic Sheet Segment Value (US$ Mn), By Region 2018-2026
TABLE 16 Global Plastic Sheet Segment Market Share, By Region 2012-2017
TABLE 17 Global Plastic Sheet Segment Market Share, By Region 2018-2026
TABLE 18 Global Plastic Sheet Segment Y-o-Y, By Region 2017-2026
TABLE 19 Global Glass Segment Value (US$ Mn), By Region 2012-2017
TABLE 20 Global Glass Segment Value (US$ Mn), By Region 2018-2026
TABLE 21 Global Glass Segment Market Share, By Region 2012-2017
TABLE 22 Global Glass Segment Market Share, By Region 2018-2026
TABLE 23 Global Glass Segment Y-o-Y, By Region 2017-2026
TABLE 24 Global Metal Segment Value (US$ Mn), By Region 2012-2017
TABLE 25 Global Metal Segment Value (US$ Mn), By Region 2018-2026
TABLE 26 Global Metal Segment Market Share, By Region 2012-2017
TABLE 27 Global Metal Segment Market Share, By Region 2018-2026
TABLE 28 Global Metal Segment Y-o-Y, By Region 2017-2026
TABLE 29 Global Hyper Market Segment Value (US$ Mn), By Region 2012-2017
TABLE 30 Global Hyper Market Segment Value (US$ Mn), By Region 2018-2026
TABLE 31 Global Hyper Market Segment Market Share, By Region 2012-2017
TABLE 32 Global Hyper Market Segment Market Share, By Region 2018-2026
TABLE 33 Global Hyper Market Segment Y-o-Y, By Region 2017-2026
TABLE 34 Global Supermarket Segment Value (US$ Mn), By Region 2012-2017
TABLE 35 Global Supermarket Segment Value (US$ Mn), By Region 2018-2026
TABLE 36 Global Supermarket Segment Market Share, By Region 2012-2017
TABLE 37 Global Supermarket Segment Market Share, By Region 2018-2026
TABLE 38 Global Supermarket Segment Y-o-Y, By Region 2017-2026
TABLE 39 Global Departmental store Segment Value (US$ Mn), By Region 2012-2017
TABLE 40 Global Departmental store Segment Value (US$ Mn), By Region 2018-2026
TABLE 41 Global Departmental store Segment Market Share, By Region 2012-2017
TABLE 42 Global Departmental store Segment Market Share, By Region 2018-2026
TABLE 43 Global Departmental store Segment Y-o-Y, By Region 2017-2026
TABLE 44 Global Speciality Store Segment Value (US$ Mn), By Region 2012-2017
TABLE 45 Global Speciality Store Segment Value (US$ Mn), By Region 2018-2026
TABLE 46 Global Speciality Store Segment Market Share, By Region 2012-2017
TABLE 47 Global Speciality Store Segment Market Share, By Region 2018-2026
TABLE 48 Global Speciality Store Segment Y-o-Y, By Region 2017-2026
TABLE 49 Global Convinience Store Segment Value (US$ Mn), By Region 2012-2017
TABLE 50 Global Convinience Store Segment Value (US$ Mn), By Region 2018-2026
TABLE 51 Global Convinience Store Segment Market Share, By Region 2012-2017
TABLE 52 Global Convinience Store Segment Market Share, By Region 2018-2026
TABLE 53 Global Convinience Store Segment Y-o-Y, By Region 2017-2026
TABLE 54 Global Other Retail Formats Segment Value (US$ Mn), By Region 2012-2017
TABLE 55 Global Other Retail Formats Segment Value (US$ Mn), By Region 2018-2026
TABLE 56 Global Other Retail Formats Segment Market Share, By Region 2012-2017
TABLE 57 Global Other Retail Formats Segment Market Share, By Region 2018-2026
TABLE 58 Global Other Retail Formats Segment Y-o-Y, By Region 2017-2026
TABLE 59 Global Food & Beverages Segment Value (US$ Mn), By Region 2012-2017
TABLE 60 Global Food & Beverages Segment Value (US$ Mn), By Region 2018-2026
TABLE 61 Global Food & Beverages Segment Market Share, By Region 2012-2017
TABLE 62 Global Food & Beverages Segment Market Share, By Region 2018-2026
TABLE 63 Global Food & Beverages Segment Y-o-Y, By Region 2017-2026
TABLE 64 Global Cosmetics & Personal Care Segment Value (US$ Mn), By Region 2012-2017
TABLE 65 Global Cosmetics & Personal Care Segment Value (US$ Mn), By Region 2018-2026
TABLE 66 Global Cosmetics & Personal Care Segment Market Share, By Region 2012-2017
TABLE 67 Global Cosmetics & Personal Care Segment Market Share, By Region 2018-2026
TABLE 68 Global Cosmetics & Personal Care Segment Y-o-Y, By Region 2017-2026
TABLE 69 Global Pharmaceuticals Segment Value (US$ Mn), By Region 2012-2017
TABLE 70 Global Pharmaceuticals Segment Value (US$ Mn), By Region 2018-2026
TABLE 71 Global Pharmaceuticals Segment Market Share, By Region 2012-2017
TABLE 72 Global Pharmaceuticals Segment Market Share, By Region 2018-2026
TABLE 73 Global Pharmaceuticals Segment Y-o-Y, By Region 2017-2026
TABLE 74 Global Printing & Stationary Segment Value (US$ Mn), By Region 2012-2017
TABLE 75 Global Printing & Stationary Segment Value (US$ Mn), By Region 2018-2026
TABLE 76 Global Printing & Stationary Segment Market Share, By Region 2012-2017
TABLE 77 Global Printing & Stationary Segment Market Share, By Region 2018-2026
TABLE 78 Global Printing & Stationary Segment Y-o-Y, By Region 2017-2026
TABLE 79 Global Electronics Segment Value (US$ Mn), By Region 2012-2017
TABLE 80 Global Electronics Segment Value (US$ Mn), By Region 2018-2026
TABLE 81 Global Electronics Segment Market Share, By Region 2012-2017
TABLE 82 Global Electronics Segment Market Share, By Region 2018-2026
TABLE 83 Global Electronics Segment Y-o-Y, By Region 2017-2026
TABLE 84 Global Automotive Segment Value (US$ Mn), By Region 2012-2017
TABLE 85 Global Automotive Segment Value (US$ Mn), By Region 2018-2026
TABLE 86 Global Automotive Segment Market Share, By Region 2012-2017
TABLE 87 Global Automotive Segment Market Share, By Region 2018-2026
TABLE 88 Global Automotive Segment Y-o-Y, By Region 2017-2026
TABLE 89 Global Others Segment Value (US$ Mn), By Region 2012-2017
TABLE 90 Global Others Segment Value (US$ Mn), By Region 2018-2026
TABLE 91 Global Others Segment Market Share, By Region 2012-2017
TABLE 92 Global Others Segment Market Share, By Region 2018-2026
TABLE 93 Global Others Segment Y-o-Y, By Region 2017-2026
TABLE 94 North America Floor POP Display Market Value (US$ Mn), By Country 2012-2017
TABLE 95 North America Floor POP Display Market Value (US$ Mn), By Country 2018-2026
TABLE 96 North America Floor POP Display Market Value (US$ Mn), By Material Type 2012-2017
TABLE 97 North America Floor POP Display Market Value (US$ Mn), By Material Type 2018-2026
TABLE 98 North America Floor POP Display Market Value (US$ Mn), By Sales Channel 2012-2017
TABLE 99 North America Floor POP Display Market Value (US$ Mn), By Sales Channel 2018-2026
TABLE 100 North America Floor POP Display Market Value (US$ Mn), By Packaging Format 2012-2017
TABLE 101 North America Floor POP Display Market Value (US$ Mn), By Packaging Format 2018-2026
TABLE 102 Latin America Floor POP Display Market Value (US$ Mn), By Country 2012-2017
TABLE 103 Latin America Floor POP Display Market Value (US$ Mn), By Country 2018-2026
TABLE 104 Latin America Floor POP Display Market Value (US$ Mn), By Material Type 2012-2017
TABLE 105 Latin America Floor POP Display Market Value (US$ Mn), By Material Type 2018-2026
TABLE 106 Latin America Floor POP Display Market Value (US$ Mn), By Sales Channel 2012-2017
TABLE 107 Latin America Floor POP Display Market Value (US$ Mn), By Sales Channel 2018-2026
TABLE 108 Latin America Floor POP Display Market Value (US$ Mn), By Packaging Format 2012-2017
TABLE 109 Latin America Floor POP Display Market Value (US$ Mn), By Packaging Format 2018-2026
TABLE 110 Europe Floor POP Display Market Value (US$ Mn), By Country 2012-2017
TABLE 111 Europe Floor POP Display Market Value (US$ Mn), By Country 2018-2026
TABLE 112 Europe Floor POP Display Market Value (US$ Mn), By Material Type 2012-2017
TABLE 113 Europe Floor POP Display Market Value (US$ Mn), By Material Type 2018-2026
TABLE 114 Europe Floor POP Display Market Value (US$ Mn), By Sales Channel 2012-2017
TABLE 115 Europe Floor POP Display Market Value (US$ Mn), By Sales Channel 2018-2026
TABLE 116 Europe Floor POP Display Market Value (US$ Mn), By Packaging Format 2012-2017
TABLE 117 Europe Floor POP Display Market Value (US$ Mn), By Packaging Format 2018-2026
TABLE 118 Japan Floor POP Display Market Value (US$ Mn), By Country 2012-2017
TABLE 119 Japan Floor POP Display Market Value (US$ Mn), By Country 2018-2026
TABLE 120 Japan Floor POP Display Market Value (US$ Mn), By Material Type 2012-2017
TABLE 121 Japan Floor POP Display Market Value (US$ Mn), By Material Type 2018-2026
TABLE 122 Japan Floor POP Display Market Value (US$ Mn), By Sales Channel 2012-2017
TABLE 123 Japan Floor POP Display Market Value (US$ Mn), By Sales Channel 2018-2026
TABLE 124 Japan Floor POP Display Market Value (US$ Mn), By Packaging Format 2012-2017
TABLE 125 Japan Floor POP Display Market Value (US$ Mn), By Packaging Format 2018-2026
TABLE 126 APEJ Floor POP Display Market Value (US$ Mn), By Country 2012-2017
TABLE 127 APEJ Floor POP Display Market Value (US$ Mn), By Country 2018-2026
TABLE 128 APEJ Floor POP Display Market Value (US$ Mn), By Material Type 2012-2017
TABLE 129 APEJ Floor POP Display Market Value (US$ Mn), By Material Type 2018-2026
TABLE 130 APEJ Floor POP Display Market Value (US$ Mn), By Sales Channel 2012-2017
TABLE 131 APEJ Floor POP Display Market Value (US$ Mn), By Sales Channel 2018-2026
TABLE 132 APEJ Floor POP Display Market Value (US$ Mn), By Packaging Format 2012-2017
TABLE 133 APEJ Floor POP Display Market Value (US$ Mn), By Packaging Format 2018-2026
TABLE 134 MEA Floor POP Display Market Value (US$ Mn), By Country 2012-2017
TABLE 135 MEA Floor POP Display Market Value (US$ Mn), By Country 2018-2026
TABLE 136 MEA Floor POP Display Market Value (US$ Mn), By Material Type 2012-2017
TABLE 137 MEA Floor POP Display Market Value (US$ Mn), By Material Type 2018-2026
TABLE 138 MEA Floor POP Display Market Value (US$ Mn), By Sales Channel 2012-2017
TABLE 139 MEA Floor POP Display Market Value (US$ Mn), By Sales Channel 2018-2026
TABLE 140 MEA Floor POP Display Market Value (US$ Mn), By Packaging Format 2012-2017
TABLE 141 MEA Floor POP Display Market Value (US$ Mn), By Packaging Format 2018-2026
List of Figures
FIG. 1 Global Floor POP Display Market Value (US$ Mn), 2012-2017
FIG. 2 Global Floor POP Display Market Value (US$ Mn) Forecast, 2018-2026
FIG. 3 Global Floor POP Display Market Value (US$ Mn) and Y-o-Y, 2017-2026
FIG. 4 Global Corrugated Board Segment Market Value (US$ Mn) By Region, 2012-2017
FIG. 5 Global Corrugated Board Segment Market Value (US$ Mn) By Region, 2018-2026
FIG. 6 Global Corrugated Board Segment Y-o-Y Growth Rate, By Region, 2017-2026
FIG. 7 Global Foam Board Segment Market Value (US$ Mn) By Region, 2012-2017
FIG. 8 Global Foam Board Segment Market Value (US$ Mn) By Region, 2018-2026
FIG. 9 Global Foam Board Segment Y-o-Y Growth Rate, By Region, 2017-2026
FIG. 10 Global Plastic Sheet Segment Market Value (US$ Mn) By Region, 2012-2017
FIG. 11 Global Plastic Sheet Segment Market Value (US$ Mn) By Region, 2018-2026
FIG. 12 Global Plastic Sheet Segment Y-o-Y Growth Rate, By Region, 2017-2026
FIG. 13 Global Glass Segment Market Value (US$ Mn) By Region, 2012-2017
FIG. 14 Global Glass Segment Market Value (US$ Mn) By Region, 2018-2026
FIG. 15 Global Glass Segment Y-o-Y Growth Rate, By Region, 2017-2026
FIG. 16 Global Metal Segment Market Value (US$ Mn) By Region, 2012-2017
FIG. 17 Global Metal Segment Market Value (US$ Mn) By Region, 2018-2026
FIG. 18 Global Metal Segment Y-o-Y Growth Rate, By Region, 2017-2026
FIG. 19 Global Hyper Market Segment Market Value (US$ Mn) By Region, 2012-2017
FIG. 20 Global Hyper Market Segment Market Value (US$ Mn) By Region, 2018-2026
FIG. 21 Global Hyper Market Segment Y-o-Y Growth Rate, By Region, 2017-2026
FIG. 22 Global Supermarket Segment Market Value (US$ Mn) By Region, 2012-2017
FIG. 23 Global Supermarket Segment Market Value (US$ Mn) By Region, 2018-2026
FIG. 24 Global Supermarket Segment Y-o-Y Growth Rate, By Region, 2017-2026
FIG. 25 Global Departmental store Segment Market Value (US$ Mn) By Region, 2012-2017
FIG. 26 Global Departmental store Segment Market Value (US$ Mn) By Region, 2018-2026
FIG. 27 Global Departmental store Segment Y-o-Y Growth Rate, By Region, 2017-2026
FIG. 28 Global Speciality Store Segment Market Value (US$ Mn) By Region, 2012-2017
FIG. 29 Global Speciality Store Segment Market Value (US$ Mn) By Region, 2018-2026
FIG. 30 Global Speciality Store Segment Y-o-Y Growth Rate, By Region, 2017-2026
FIG. 31 Global Convinience Store Segment Market Value (US$ Mn) By Region, 2012-2017
FIG. 32 Global Convinience Store Segment Market Value (US$ Mn) By Region, 2018-2026
FIG. 33 Global Convinience Store Segment Y-o-Y Growth Rate, By Region, 2017-2026
FIG. 34 Global Other Retail Formats Segment Market Value (US$ Mn) By Region, 2012-2017
FIG. 35 Global Other Retail Formats Segment Market Value (US$ Mn) By Region, 2018-2026
FIG. 36 Global Other Retail Formats Segment Y-o-Y Growth Rate, By Region, 2017-2026
FIG. 37 Global Food & Beverages Segment Market Value (US$ Mn) By Region, 2012-2017
FIG. 38 Global Food & Beverages Segment Market Value (US$ Mn) By Region, 2018-2026
FIG. 39 Global Food & Beverages Segment Y-o-Y Growth Rate, By Region, 2017-2026
FIG. 40 Global Cosmetics & Personal Care Segment Market Value (US$ Mn) By Region, 2012-2017
FIG. 41 Global Cosmetics & Personal Care Segment Market Value (US$ Mn) By Region, 2018-2026
FIG. 42 Global Cosmetics & Personal Care Segment Y-o-Y Growth Rate, By Region, 2017-2026
FIG. 43 Global Pharmaceuticals Segment Market Value (US$ Mn) By Region, 2012-2017
FIG. 44 Global Pharmaceuticals Segment Market Value (US$ Mn) By Region, 2018-2026
FIG. 45 Global Pharmaceuticals Segment Y-o-Y Growth Rate, By Region, 2017-2026
FIG. 46 Global Printing & Stationary Segment Market Value (US$ Mn) By Region, 2012-2017
FIG. 47 Global Printing & Stationary Segment Market Value (US$ Mn) By Region, 2018-2026
FIG. 48 Global Printing & Stationary Segment Y-o-Y Growth Rate, By Region, 2017-2026
FIG. 49 Global Electronics Segment Market Value (US$ Mn) By Region, 2012-2017
FIG. 50 Global Electronics Segment Market Value (US$ Mn) By Region, 2018-2026
FIG. 51 Global Electronics Segment Y-o-Y Growth Rate, By Region, 2017-2026
FIG. 52 Global Automotive Segment Market Value (US$ Mn) By Region, 2012-2017
FIG. 53 Global Automotive Segment Market Value (US$ Mn) By Region, 2018-2026
FIG. 54 Global Automotive Segment Y-o-Y Growth Rate, By Region, 2017-2026
FIG. 55 Global Others Segment Market Value (US$ Mn) By Region, 2012-2017
FIG. 56 Global Others Segment Market Value (US$ Mn) By Region, 2018-2026
FIG. 57 Global Others Segment Y-o-Y Growth Rate, By Region, 2017-2026
FIG. 58 North America Floor POP Display Market Value (US$ Mn), By Country 2012-2017
FIG. 59 North America Floor POP Display Market Value (US$ Mn), By Country 2018-2026
FIG. 60 North America Floor POP Display Market Value (US$ Mn), By Material Type 2012-2017
FIG. 61 North America Floor POP Display Market Value (US$ Mn), By Material Type 2018-2026
FIG. 62 North America Floor POP Display Market Value (US$ Mn), By Sales Channel 2012-2017
FIG. 63 North America Floor POP Display Market Value (US$ Mn), By Sales Channel 2018-2026
FIG. 64 North America Floor POP Display Market Value (US$ Mn), By Packaging Format 2012-2017
FIG. 65 North America Floor POP Display Market Value (US$ Mn), By Packaging Format 2018-2026
FIG. 66 Latin America Floor POP Display Market Value (US$ Mn), By Country 2012-2017
FIG. 67 Latin America Floor POP Display Market Value (US$ Mn), By Country 2018-2026
FIG. 68 Latin America Floor POP Display Market Value (US$ Mn), By Material Type 2012-2017
FIG. 69 Latin America Floor POP Display Market Value (US$ Mn), By Material Type 2018-2026
FIG. 70 Latin America Floor POP Display Market Value (US$ Mn), By Sales Channel 2012-2017
FIG. 71 Latin America Floor POP Display Market Value (US$ Mn), By Sales Channel 2018-2026
FIG. 72 Latin America Floor POP Display Market Value (US$ Mn), By Packaging Format 2012-2017
FIG. 73 Latin America Floor POP Display Market Value (US$ Mn), By Packaging Format 2018-2026
FIG. 74 Europe Floor POP Display Market Value (US$ Mn), By Country 2012-2017
FIG. 75 Europe Floor POP Display Market Value (US$ Mn), By Country 2018-2026
FIG. 76 Europe Floor POP Display Market Value (US$ Mn), By Material Type 2012-2017
FIG. 77 Europe Floor POP Display Market Value (US$ Mn), By Material Type 2018-2026
FIG. 78 Europe Floor POP Display Market Value (US$ Mn), By Sales Channel 2012-2017
FIG. 79 Europe Floor POP Display Market Value (US$ Mn), By Sales Channel 2018-2026
FIG. 80 Europe Floor POP Display Market Value (US$ Mn), By Packaging Format 2012-2017
FIG. 81 Europe Floor POP Display Market Value (US$ Mn), By Packaging Format 2018-2026
FIG. 82 Japan Floor POP Display Market Value (US$ Mn), By Country 2012-2017
FIG. 83 Japan Floor POP Display Market Value (US$ Mn), By Country 2018-2026
FIG. 84 Japan Floor POP Display Market Value (US$ Mn), By Material Type 2012-2017
FIG. 85 Japan Floor POP Display Market Value (US$ Mn), By Material Type 2018-2026
FIG. 86 Japan Floor POP Display Market Value (US$ Mn), By Packaging Format 2012-2017
FIG. 87 Japan Floor POP Display Market Value (US$ Mn), By Sales Channel 2018-2026
FIG. 88 Japan Floor POP Display Market Value (US$ Mn), By Packaging Format 2012-2017
FIG. 89 Japan Floor POP Display Market Value (US$ Mn), By Packaging Format 2018-2026
FIG. 90 APEJ Floor POP Display Market Value (US$ Mn), By Country 2012-2017
FIG. 91 APEJ Floor POP Display Market Value (US$ Mn), By Country 2018-2026
FIG. 92 APEJ Floor POP Display Market Value (US$ Mn), By Material Type 2012-2017
FIG. 93 APEJ Floor POP Display Market Value (US$ Mn), By Material Type 2018-2026
FIG. 94 APEJ Floor POP Display Market Value (US$ Mn), By Sales Channel 2012-2017
FIG. 95 APEJ Floor POP Display Market Value (US$ Mn), By Sales Channel 2018-2026
FIG. 96 APEJ Floor POP Display Market Value (US$ Mn), By Packaging Format 2012-2017
FIG. 97 APEJ Floor POP Display Market Value (US$ Mn), By Packaging Format 2018-2026
FIG. 98 MEA Floor POP Display Market Value (US$ Mn), By Country 2012-2017
FIG. 99 MEA Floor POP Display Market Value (US$ Mn), By Country 2018-2026
FIG. 100 MEA Floor POP Display Market Value (US$ Mn), By Material Type 2012-2017
FIG. 101 MEA Floor POP Display Market Value (US$ Mn), By Material Type 2018-2026
FIG. 102 MEA Floor POP Display Market Value (US$ Mn), By Sales Channel 2012-2017
FIG. 103 MEA Floor POP Display Market Value (US$ Mn), By Sales Channel 2018-2026
FIG. 104 MEA Floor POP Display Market Value (US$ Mn), By Packaging Format 2012-2017
FIG. 105 MEA Floor POP Display Market Value (US$ Mn), By Packaging Format 2018-2026
Copyright © Transparency Market Research, Inc. All Rights reserved
Trust Online

Floor POP Display Market