
Reports
Reports
The global electrostatic discharge (ESD) foam packaging market is prognosticated to attract favorable growth prospects while riding on the growing adoption of internet of things (IoT) across different regions of the world. ESD foam packaging could up its demand in the foreseeable future due to the engagement of integrated circuits for the launch of novel technological products in consumer markets and implementation of IoT in consumer offerings.
Higher dimensional stability of ESD foam compared to other packaging materials for electronic equipment could be a key marker for the rising demand in the global ESD foam packaging market. Furthermore, the ability of ESD foam to be cut into any shape to seamlessly sync with that of electronic equipment is foreseen to be another factor driving the growth of the market.
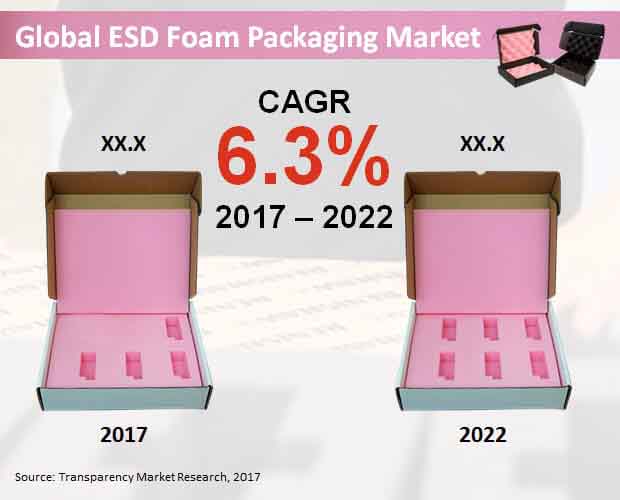
The global ESD foam packaging market is envisioned to rise at a CAGR of 6.3% during the forecast timeframe 2017–2022 to reach a valuation of US$233.8 mn by the closing forecast year. In 2017, the market held a valuation of US$172.5 mn.
The world ESD foam packaging market is anticipated to be classified according to three categories, viz. application, material and additive, and end-use industry. On the basis of application, the market could be segmented into electrical and electronic component and others. As per the report, the star performer among the application segments could be electrical and electronic component with a US$217.8 mn revenue predicted to be earned by 2022 end. The annual absolute growth exhibited by this segment could be larger than that of any other in the application category.
In terms of material and additive type, the world ESD foam packaging market is projected to be segmented into conductive and dissipative polymer, metal, and additive. By end-use industry, there could be crucial segments taking shape in the market, such as aerospace, manufacturing, defense and military, automobile, electrical and electronics, and other end-use industries.
With respect to regional segmentation, the international ESD foam packaging market is prophesied to observe the domination of Asia Pacific except Japan (APEJ), which could be valued at a US$105.8 mn by the end of the forecast period. This region could also be counted among the most attractive ones for years to come. North America and Europe are also forecast to showcase a strong revenue growth in the near future. The former could expand at a CAGR of 6.7% while the latter is expected to gain 47 basis points (BPS) between 2017 and 2022.
However, the Middle East and Africa (MEA) and Japan could embrace a slower growth pace during the course of the forecast period. The MEA is envisaged to create an absolute revenue prospect of US$3.9 mn by 2022 over 2017. Japan could be valued at an only US$17.4 mn by the end of 2022.
Some of the important companies operating in the worldwide ESD foam packaging market could be Statclean Technology (S) Pte Ltd., Electrotek Static Controls Pvt. Ltd., Helios Packaging, Conductive Containers, Inc., Botron Company, Inc., GWP Group Limited, Elcom U.K. Ltd., Tekins Limited, and Nefab AB.
ESD Foam Packaging Market Gains from Growth in Consumer Electronics Manufacturing
ESD foam packaging is a type of anti-static packaging used extensively for the storage and shipping of electronics and semiconductor components to prevent damage from ESD damage. They are incorporated with anti-static agents for ESD components. Rise in volumes of semiconductors stored and shipped nationally and internationally is a key driver for growth in the ESD foam packaging market. Packaging companies have been formulating foams of different density and vibration control capabilities to meet the various demands of shipping of electronics components. The growing use of wafer foam separator is a key factor spurring the sales in the ESD foam packaging market. The electronics packaging has made continuous strides on the back of rise in demands for consumer electronics across the world. Online sales of these have also contributed to the swelling demand. Various types of formulations for the packaging foam has come to the fore, essentially by varying the methods of crosslinking. Efforts have also gained momentum to make ESD foam packaging environmental-friendly and of different designs to suit the sizes of large ESD-sensitive electronics equipment.
The COVID-19 pandemic has brought massive downturns in the semiconductor manufacturing, forcing stakeholders to pay attention to new normals. This also changed the short-term goals of ESD foam packaging manufacturers. In particularly, players in the ESD foam packaging have focused on securing raw material supply chains. In the last few months, optimism in the manufacturing sector has also added new growth impetus to the market. Further, there has been increase in semiconductor wafer fabrication, positively boosting the demand for ESD foam packaging some key markets. Also, the demand for consumer electronics is gathering pace in some developing economies, which will play a key role in shaping the growth dynamics of the ESD foam packaging market. Investments by governments in numerous countries in boosting telecommunication technologies will also spur the ESD foam packaging manufacturing.
1. Global ESD Foam Packaging Market - Executive Summary
2. Global ESD Foam Packaging Market Overview
2.1. Introduction
2.1.1. Global ESD Foam Packaging Market Taxonomy
2.1.2. Global ESD Foam Packaging Market Definition
2.2. Global ESD Foam Packaging Market Size (US$ Mn) and Forecast, 2012-2022
2.2.1. Global ESD Foam Packaging Market Y-o-Y Growth
2.3. Global ESD Foam Packaging Market Dynamics
2.4. Supply Chain
2.5. Cost Structure
2.6. Pricing Analysis
2.7. Raw Material Sourcing Strategy and Analysis
2.8. List of Distributors
2.9. Key Participants Market Presence (Intensity Map) By Region
3. Global ESD Foam Packaging Market Analysis and Forecast By Application Type
3.1. Global ESD Foam Packaging Market Size and Forecast By Application Type, 2012-2022
3.1.1. Electrical & Electronic Component Market Size and Forecast, 2012-2022
3.1.1.1. Revenue (US$ Mn) Comparison, By Region
3.1.1.2. Market Share Comparison, By Region
3.1.1.3. Y-o-Y growth Comparison, By Region
3.1.2. Others Market Size and Forecast, 2012-2022
3.1.2.1. Revenue (US$ Mn) Comparison, By Region
3.1.2.2. Market Share Comparison, By Region
3.1.2.3. Y-o-Y growth Comparison, By Region
4. Global ESD Foam Packaging Market Analysis and Forecast By Material & Additive Type
4.1. Global ESD Foam Packaging Market Size and Forecast By Material & Additive Type, 2012-2022
4.1.1. Conductive & Dissipative Polymers Market Size and Forecast, 2012-2022
4.1.1.1. Revenue (US$ Mn) Comparison, By Region
4.1.1.2. Market Share Comparison, By Region
4.1.1.3. Y-o-Y growth Comparison, By Region
4.1.2. Metal Market Size and Forecast, 2012-2022
4.1.2.1. Revenue (US$ Mn) Comparison, By Region
4.1.2.2. Market Share Comparison, By Region
4.1.2.3. Y-o-Y growth Comparison, By Region
4.1.3. Additive Market Size and Forecast, 2012-2022
4.1.3.1. Revenue (US$ Mn) Comparison, By Region
4.1.3.2. Market Share Comparison, By Region
4.1.3.3. Y-o-Y growth Comparison, By Region
5. Global ESD Foam Packaging Market Analysis and Forecast By End Use Industry
5.1. Global ESD Foam Packaging Market Size and Forecast By End Use Industry, 2012-2022
5.1.1. Electrical & Electronics Market Size and Forecast, 2012-2022
5.1.1.1. Revenue (US$ Mn) Comparison, By Region
5.1.1.2. Market Share Comparison, By Region
5.1.1.3. Y-o-Y growth Comparison, By Region
5.1.2. Automobile Market Size and Forecast, 2012-2022
5.1.2.1. Revenue (US$ Mn) Comparison, By Region
5.1.2.2. Market Share Comparison, By Region
5.1.2.3. Y-o-Y growth Comparison, By Region
5.1.3. Defence & Military Market Size and Forecast, 2012-2022
5.1.3.1. Revenue (US$ Mn) Comparison, By Region
5.1.3.2. Market Share Comparison, By Region
5.1.3.3. Y-o-Y growth Comparison, By Region
5.1.4. Manufacturing Market Size and Forecast, 2012-2022
5.1.4.1. Revenue (US$ Mn) Comparison, By Region
5.1.4.2. Market Share Comparison, By Region
5.1.4.3. Y-o-Y growth Comparison, By Region
5.1.5. Aerospace Market Size and Forecast, 2012-2022
5.1.5.1. Revenue (US$ Mn) Comparison, By Region
5.1.5.2. Market Share Comparison, By Region
5.1.5.3. Y-o-Y growth Comparison, By Region
5.1.6. Other End Use Market Size and Forecast, 2012-2022
5.1.6.1. Revenue (US$ Mn) Comparison, By Region
5.1.6.2. Market Share Comparison, By Region
5.1.6.3. Y-o-Y growth Comparison, By Region
6. Global ESD Foam Packaging Market Analysis and Forecast By Region
6.1. Global ESD Foam Packaging Market Size and Forecast, 2012-2022
6.1.1. North America ESD Foam Packaging Market Size and Forecast, 2012-2022
6.1.1.1. Revenue (US$ Mn) Comparison, By Application Type
6.1.1.2. Revenue (US$ Mn) Comparison, By Material & Additive Type
6.1.1.3. Revenue (US$ Mn) Comparison, By End Use Industry
6.1.2. Latin America ESD Foam Packaging Market Size and Forecast, 2012-2022
6.1.2.1. Revenue (US$ Mn) Comparison, By Application Type
6.1.2.2. Revenue (US$ Mn) Comparison, By Material & Additive Type
6.1.2.3. Revenue (US$ Mn) Comparison, By End Use Industry
6.1.3. Europe ESD Foam Packaging Market Size and Forecast, 2012-2022
6.1.3.1. Revenue (US$ Mn) Comparison, By Application Type
6.1.3.2. Revenue (US$ Mn) Comparison, By Material & Additive Type
6.1.3.3. Revenue (US$ Mn) Comparison, By End Use Industry
6.1.4. Japan ESD Foam Packaging Market Size and Forecast, 2012-2022
6.1.4.1. Revenue (US$ Mn) Comparison, By Application Type
6.1.4.2. Revenue (US$ Mn) Comparison, By Material & Additive Type
6.1.4.3. Revenue (US$ Mn) Comparison, By End Use Industry
6.1.5. APEJ ESD Foam Packaging Market Size and Forecast, 2012-2022
6.1.5.1. Revenue (US$ Mn) Comparison, By Application Type
6.1.5.2. Revenue (US$ Mn) Comparison, By Material & Additive Type
6.1.5.3. Revenue (US$ Mn) Comparison, By End Use Industry
6.1.6. MEA ESD Foam Packaging Market Size and Forecast, 2012-2022
6.1.6.1. Revenue (US$ Mn) Comparison, By Application Type
6.1.6.2. Revenue (US$ Mn) Comparison, By Material & Additive Type
6.1.6.3. Revenue (US$ Mn) Comparison, By End Use Industry
7. North America ESD Foam Packaging Market Analysis and Forecast, By Country, 2012-2022
7.1. US ESD Foam Packaging Market Size and Forecast, 2012-2022
7.1.1. Revenue (US$ Mn) Comparison, By Application Type
7.1.2. Revenue (US$ Mn) Comparison, By Material & Additive Type
7.1.3. Revenue (US$ Mn) Comparison, By End Use Industry
7.2. Canada ESD Foam Packaging Market Size and Forecast, 2012-2022
7.2.1. Revenue (US$ Mn) Comparison, By Application Type
7.2.2. Revenue (US$ Mn) Comparison, By Material & Additive Type
7.2.3. Revenue (US$ Mn) Comparison, By End Use Industry
8. Latin America ESD Foam Packaging Market Analysis and Forecast, By Country, 2012-2022
8.1. Brazil ESD Foam Packaging Market Size and Forecast, 2012-2022
8.1.1. Revenue (US$ Mn) Comparison, By Application Type
8.1.2. Revenue (US$ Mn) Comparison, By Material & Additive Type
8.1.3. Revenue (US$ Mn) Comparison, By End Use Industry
8.2. Mexico ESD Foam Packaging Market Size and Forecast, 2012-2022
8.2.1. Revenue (US$ Mn) Comparison, By Application Type
8.2.2. Revenue (US$ Mn) Comparison, By Material & Additive Type
8.2.3. Revenue (US$ Mn) Comparison, By End Use Industry
8.3. Argentina ESD Foam Packaging Market Size and Forecast, 2012-2022
8.3.1. Revenue (US$ Mn) Comparison, By Application Type
8.3.2. Revenue (US$ Mn) Comparison, By Material & Additive Type
8.3.3. Revenue (US$ Mn) Comparison, By End Use Industry
9. Europe ESD Foam Packaging Market Analysis and Forecast, By Country, 2012-2022
9.1. Germany ESD Foam Packaging Market Size and Forecast, 2012-2022
9.1.1. Revenue (US$ Mn) Comparison, By Application Type
9.1.2. Revenue (US$ Mn) Comparison, By Material & Additive Type
9.1.3. Revenue (US$ Mn) Comparison, By End Use Industry
9.2. UK ESD Foam Packaging Market Size and Forecast, 2012-2022
9.2.1. Revenue (US$ Mn) Comparison, By Application Type
9.2.2. Revenue (US$ Mn) Comparison, By Material & Additive Type
9.2.3. Revenue (US$ Mn) Comparison, By End Use Industry
9.3. France ESD Foam Packaging Market Size and Forecast, 2012-2022
9.3.1. Revenue (US$ Mn) Comparison, By Application Type
9.3.2. Revenue (US$ Mn) Comparison, By Material & Additive Type
9.3.3. Revenue (US$ Mn) Comparison, By End Use Industry
9.4. Spain ESD Foam Packaging Market Size and Forecast, 2012-2022
9.4.1. Revenue (US$ Mn) Comparison, By Application Type
9.4.2. Revenue (US$ Mn) Comparison, By Material & Additive Type
9.4.3. Revenue (US$ Mn) Comparison, By End Use Industry
9.5. Italy ESD Foam Packaging Market Size and Forecast, 2012-2022
9.5.1. Revenue (US$ Mn) Comparison, By Application Type
9.5.2. Revenue (US$ Mn) Comparison, By Material & Additive Type
9.5.3. Revenue (US$ Mn) Comparison, By End Use Industry
9.6. Russia ESD Foam Packaging Market Size and Forecast, 2012-2022
9.6.1. Revenue (US$ Mn) Comparison, By Application Type
9.6.2. Revenue (US$ Mn) Comparison, By Material & Additive Type
9.6.3. Revenue (US$ Mn) Comparison, By End Use Industry
10. Japan ESD Foam Packaging Market Analysis and Forecast, By Country, 2012-2022
10.1. Japan ESD Foam Packaging Market Size and Forecast, 2012-2022
10.1.1. Revenue (US$ Mn) Comparison, By Application Type
10.1.2. Revenue (US$ Mn) Comparison, By Material & Additive Type
10.1.3. Revenue (US$ Mn) Comparison, By End Use Industry
11. APEJ ESD Foam Packaging Market Analysis and Forecast, By Country, 2012-2022
11.1. China ESD Foam Packaging Market Size and Forecast, 2012-2022
11.1.1. Revenue (US$ Mn) Comparison, By Application Type
11.1.2. Revenue (US$ Mn) Comparison, By Material & Additive Type
11.1.3. Revenue (US$ Mn) Comparison, By End Use Industry
11.2. India ESD Foam Packaging Market Size and Forecast, 2012-2022
11.2.1. Revenue (US$ Mn) Comparison, By Application Type
11.2.2. Revenue (US$ Mn) Comparison, By Material & Additive Type
11.2.3. Revenue (US$ Mn) Comparison, By End Use Industry
11.3. Malaysia ESD Foam Packaging Market Size and Forecast, 2012-2022
11.3.1. Revenue (US$ Mn) Comparison, By Application Type
11.3.2. Revenue (US$ Mn) Comparison, By Material & Additive Type
11.3.3. Revenue (US$ Mn) Comparison, By End Use Industry
11.4. Thailand ESD Foam Packaging Market Size and Forecast, 2012-2022
11.4.1. Revenue (US$ Mn) Comparison, By Application Type
11.4.2. Revenue (US$ Mn) Comparison, By Material & Additive Type
11.4.3. Revenue (US$ Mn) Comparison, By End Use Industry
11.5. Singapore ESD Foam Packaging Market Size and Forecast, 2012-2022
11.5.1. Revenue (US$ Mn) Comparison, By Application Type
11.5.2. Revenue (US$ Mn) Comparison, By Material & Additive Type
11.5.3. Revenue (US$ Mn) Comparison, By End Use Industry
11.6. Australia ESD Foam Packaging Market Size and Forecast, 2012-2022
11.6.1. Revenue (US$ Mn) Comparison, By Application Type
11.6.2. Revenue (US$ Mn) Comparison, By Material & Additive Type
11.6.3. Revenue (US$ Mn) Comparison, By End Use Industry
12. MEA ESD Foam Packaging Market Analysis and Forecast, By Country, 2012-2022
12.1. GCC Countries ESD Foam Packaging Market Size and Forecast, 2012-2022
12.1.1. Revenue (US$ Mn) Comparison, By Application Type
12.1.2. Revenue (US$ Mn) Comparison, By Material & Additive Type
12.1.3. Revenue (US$ Mn) Comparison, By End Use Industry
12.2. South Africa ESD Foam Packaging Market Size and Forecast, 2012-2022
12.2.1. Revenue (US$ Mn) Comparison, By Application Type
12.2.2. Revenue (US$ Mn) Comparison, By Material & Additive Type
12.2.3. Revenue (US$ Mn) Comparison, By End Use Industry
12.3. Nigeria ESD Foam Packaging Market Size and Forecast, 2012-2022
12.3.1. Revenue (US$ Mn) Comparison, By Application Type
12.3.2. Revenue (US$ Mn) Comparison, By Material & Additive Type
12.3.3. Revenue (US$ Mn) Comparison, By End Use Industry
12.4. Israel ESD Foam Packaging Market Size and Forecast, 2012-2022
12.4.1. Revenue (US$ Mn) Comparison, By Application Type
12.4.2. Revenue (US$ Mn) Comparison, By Material & Additive Type
12.4.3. Revenue (US$ Mn) Comparison, By End Use Industry
13. Global ESD Foam Packaging Market Company Share, Competition Landscape and Company Profiles
13.1. Company Share Analysis
13.2. Competition Landscape
13.3. Company Profiles
13.3.1. Nefab AB
13.3.2. Tekins Limited
13.3.3. Elcom U.K. Ltd
13.3.4. GWP Group Limited
13.3.5. Botron Company Inc
13.3.6. Conductive Containers, Inc
13.3.7. Helios Packaging
13.3.8. Electrotek Static Controls Pvt Ltd
13.3.9. Statclean Technology (S) Pte Ltd
14. Research Methodology
15. Secondary and Primary Sources
16. Assumptions and Acronyms
17. Disclaimer
List of Tables
TABLE 1 Global ESD Foam Packaging Market Value (US$ Mn), 2012-2016
TABLE 2 Global ESD Foam Packaging Market Value (US$ Mn), 2017-2022
TABLE 3 Global ESD Foam Packaging Market Value (US$ Mn) and Y-o-Y, 2015-2022
TABLE 4 Global Electrical & Electronic Component Segment Value (US$ Mn), By Region 2012-2016
TABLE 5 Global Electrical & Electronic Component Segment Value (US$ Mn), By Region 2017-2022
TABLE 6 Global Electrical & Electronic Component Segment Market Share, By Region 2012-2016
TABLE 7 Global Electrical & Electronic Component Segment Market Share, By Region 2017-2022
TABLE 8 Global Electrical & Electronic Component Segment Y-o-Y, By Region 2015-2022
TABLE 9 Global Others Segment Value (US$ Mn), By Region 2012-2016
TABLE 10 Global Others Segment Value (US$ Mn), By Region 2017-2022
TABLE 11 Global Others Segment Market Share, By Region 2012-2016
TABLE 12 Global Others Segment Market Share, By Region 2017-2022
TABLE 13 Global Others Segment Y-o-Y, By Region 2015-2022
TABLE 14 Global Conductive & Dissipative Polymers Segment Value (US$ Mn), By Region 2012-2016
TABLE 15 Global Conductive & Dissipative Polymers Segment Value (US$ Mn), By Region 2017-2022
TABLE 16 Global Conductive & Dissipative Polymers Segment Market Share, By Region 2012-2016
TABLE 17 Global Conductive & Dissipative Polymers Segment Market Share, By Region 2017-2022
TABLE 18 Global Conductive & Dissipative Polymers Segment Y-o-Y, By Region 2015-2022
TABLE 19 Global Metal Segment Value (US$ Mn), By Region 2012-2016
TABLE 20 Global Metal Segment Value (US$ Mn), By Region 2017-2022
TABLE 21 Global Metal Segment Market Share, By Region 2012-2016
TABLE 22 Global Metal Segment Market Share, By Region 2017-2022
TABLE 23 Global Metal Segment Y-o-Y, By Region 2015-2022
TABLE 24 Global Additive Segment Value (US$ Mn), By Region 2012-2016
TABLE 25 Global Additive Segment Value (US$ Mn), By Region 2017-2022
TABLE 26 Global Additive Segment Market Share, By Region 2012-2016
TABLE 27 Global Additive Segment Market Share, By Region 2017-2022
TABLE 28 Global Additive Segment Y-o-Y, By Region 2015-2022
TABLE 29 Global Electrical & Electronics Segment Value (US$ Mn), By Region 2012-2016
TABLE 30 Global Electrical & Electronics Segment Value (US$ Mn), By Region 2017-2022
TABLE 31 Global Electrical & Electronics Segment Market Share, By Region 2012-2016
TABLE 32 Global Electrical & Electronics Segment Market Share, By Region 2017-2022
TABLE 33 Global Electrical & Electronics Segment Y-o-Y, By Region 2015-2022
TABLE 34 Global Automobile Segment Value (US$ Mn), By Region 2012-2016
TABLE 35 Global Automobile Segment Value (US$ Mn), By Region 2017-2022
TABLE 36 Global Automobile Segment Market Share, By Region 2012-2016
TABLE 37 Global Automobile Segment Market Share, By Region 2017-2022
TABLE 38 Global Automobile Segment Y-o-Y, By Region 2015-2022
TABLE 39 Global Defence & Military Segment Value (US$ Mn), By Region 2012-2016
TABLE 40 Global Defence & Military Segment Value (US$ Mn), By Region 2017-2022
TABLE 41 Global Defence & Military Segment Market Share, By Region 2012-2016
TABLE 42 Global Defence & Military Segment Market Share, By Region 2017-2022
TABLE 43 Global Defence & Military Segment Y-o-Y, By Region 2015-2022
TABLE 44 Global Manufacturing Segment Value (US$ Mn), By Region 2012-2016
TABLE 45 Global Manufacturing Segment Value (US$ Mn), By Region 2017-2022
TABLE 46 Global Manufacturing Segment Market Share, By Region 2012-2016
TABLE 47 Global Manufacturing Segment Market Share, By Region 2017-2022
TABLE 48 Global Manufacturing Segment Y-o-Y, By Region 2015-2022
TABLE 49 Global Aerospace Segment Value (US$ Mn), By Region 2012-2016
TABLE 50 Global Aerospace Segment Value (US$ Mn), By Region 2017-2022
TABLE 51 Global Aerospace Segment Market Share, By Region 2012-2016
TABLE 52 Global Aerospace Segment Market Share, By Region 2017-2022
TABLE 53 Global Aerospace Segment Y-o-Y, By Region 2015-2022
TABLE 54 Global Other End Use Segment Value (US$ Mn), By Region 2012-2016
TABLE 55 Global Other End Use Segment Value (US$ Mn), By Region 2017-2022
TABLE 56 Global Other End Use Segment Market Share, By Region 2012-2016
TABLE 57 Global Other End Use Segment Market Share, By Region 2017-2022
TABLE 58 Global Other End Use Segment Y-o-Y, By Region 2015-2022
TABLE 59 North America ESD Foam Packaging Market Value (US$ Mn), By Application Type 2012-2016
TABLE 60 North America ESD Foam Packaging Market Value (US$ Mn), By Application Type 2017-2022
TABLE 61 North America ESD Foam Packaging Market Value (US$ Mn), By Material & Additive Type 2012-2016
TABLE 62 North America ESD Foam Packaging Market Value (US$ Mn), By Material & Additive Type 2017-2022
TABLE 63 North America ESD Foam Packaging Market Value (US$ Mn), By End Use Industry 2012-2016
TABLE 64 North America ESD Foam Packaging Market Value (US$ Mn), By End Use Industry 2017-2022
TABLE 65 Latin America ESD Foam Packaging Market Value (US$ Mn), By Application Type 2012-2016
TABLE 66 Latin America ESD Foam Packaging Market Value (US$ Mn), By Application Type 2017-2022
TABLE 67 Latin America ESD Foam Packaging Market Value (US$ Mn), By Material & Additive Type 2012-2016
TABLE 68 Latin America ESD Foam Packaging Market Value (US$ Mn), By Material & Additive Type 2017-2022
TABLE 69 Latin America ESD Foam Packaging Market Value (US$ Mn), By End Use Industry 2012-2016
TABLE 70 Latin America ESD Foam Packaging Market Value (US$ Mn), By End Use Industry 2017-2022
TABLE 71 Europe ESD Foam Packaging Market Value (US$ Mn), By Application Type 2012-2016
TABLE 72 Europe ESD Foam Packaging Market Value (US$ Mn), By Application Type 2017-2022
TABLE 73 Europe ESD Foam Packaging Market Value (US$ Mn), By Material & Additive Type 2012-2016
TABLE 74 Europe ESD Foam Packaging Market Value (US$ Mn), By Material & Additive Type 2017-2022
TABLE 75 Europe ESD Foam Packaging Market Value (US$ Mn), By End Use Industry 2012-2016
TABLE 76 Europe ESD Foam Packaging Market Value (US$ Mn), By End Use Industry 2017-2022
TABLE 77 Japan ESD Foam Packaging Market Value (US$ Mn), By Application Type 2012-2016
TABLE 78 Japan ESD Foam Packaging Market Value (US$ Mn), By Application Type 2017-2022
TABLE 79 Japan ESD Foam Packaging Market Value (US$ Mn), By Material & Additive Type 2012-2016
TABLE 80 Japan ESD Foam Packaging Market Value (US$ Mn), By Material & Additive Type 2017-2022
TABLE 81 Japan ESD Foam Packaging Market Value (US$ Mn), By End Use Industry 2012-2016
TABLE 82 Japan ESD Foam Packaging Market Value (US$ Mn), By End Use Industry 2017-2022
TABLE 83 APEJ ESD Foam Packaging Market Value (US$ Mn), By Application Type 2012-2016
TABLE 84 APEJ ESD Foam Packaging Market Value (US$ Mn), By Application Type 2017-2022
TABLE 85 APEJ ESD Foam Packaging Market Value (US$ Mn), By Material & Additive Type 2012-2016
TABLE 86 APEJ ESD Foam Packaging Market Value (US$ Mn), By Material & Additive Type 2017-2022
TABLE 87 APEJ ESD Foam Packaging Market Value (US$ Mn), By End Use Industry 2012-2016
TABLE 88 APEJ ESD Foam Packaging Market Value (US$ Mn), By End Use Industry 2017-2022
TABLE 89 MEA ESD Foam Packaging Market Value (US$ Mn), By Application Type 2012-2016
TABLE 90 MEA ESD Foam Packaging Market Value (US$ Mn), By Application Type 2017-2022
TABLE 91 MEA ESD Foam Packaging Market Value (US$ Mn), By Material & Additive Type 2012-2016
TABLE 92 MEA ESD Foam Packaging Market Value (US$ Mn), By Material & Additive Type 2017-2022
TABLE 93 MEA ESD Foam Packaging Market Value (US$ Mn), By End Use Industry 2012-2016
TABLE 94 MEA ESD Foam Packaging Market Value (US$ Mn), By End Use Industry 2017-2022
TABLE 95 US ESD Foam Packaging Market Value (US$ Mn), By Application Type 2012-2016
TABLE 96 US ESD Foam Packaging Market Value (US$ Mn), By Application Type 2017-2022
TABLE 97 US ESD Foam Packaging Market Value (US$ Mn), By Material & Additive Type 2012-2016
TABLE 98 US ESD Foam Packaging Market Value (US$ Mn), By Material & Additive Type 2017-2022
TABLE 99 US ESD Foam Packaging Market Value (US$ Mn), By End Use Industry 2012-2016
TABLE 100 US ESD Foam Packaging Market Value (US$ Mn), By End Use Industry 2017-2022
TABLE 101 Canada ESD Foam Packaging Market Value (US$ Mn), By Application Type 2012-2016
TABLE 102 Canada ESD Foam Packaging Market Value (US$ Mn), By Application Type 2017-2022
TABLE 103 Canada ESD Foam Packaging Market Value (US$ Mn), By Material & Additive Type 2012-2016
TABLE 104 Canada ESD Foam Packaging Market Value (US$ Mn), By Material & Additive Type 2017-2022
TABLE 105 Canada ESD Foam Packaging Market Value (US$ Mn), By End Use Industry 2012-2016
TABLE 106 Canada ESD Foam Packaging Market Value (US$ Mn), By End Use Industry 2017-2022
TABLE 107 Brazil ESD Foam Packaging Market Value (US$ Mn), By Application Type 2012-2016
TABLE 108 Brazil ESD Foam Packaging Market Value (US$ Mn), By Application Type 2017-2022
TABLE 109 Brazil ESD Foam Packaging Market Value (US$ Mn), By Material & Additive Type 2012-2016
TABLE 110 Brazil ESD Foam Packaging Market Value (US$ Mn), By Material & Additive Type 2017-2022
TABLE 111 Brazil ESD Foam Packaging Market Value (US$ Mn), By End Use Industry 2012-2016
TABLE 112 Brazil ESD Foam Packaging Market Value (US$ Mn), By End Use Industry 2017-2022
TABLE 113 Mexico ESD Foam Packaging Market Value (US$ Mn), By Application Type 2012-2016
TABLE 114 Mexico ESD Foam Packaging Market Value (US$ Mn), By Application Type 2017-2022
TABLE 115 Mexico ESD Foam Packaging Market Value (US$ Mn), By Material & Additive Type 2012-2016
TABLE 116 Mexico ESD Foam Packaging Market Value (US$ Mn), By Material & Additive Type 2017-2022
TABLE 117 Mexico ESD Foam Packaging Market Value (US$ Mn), By End Use Industry 2012-2016
TABLE 118 Mexico ESD Foam Packaging Market Value (US$ Mn), By End Use Industry 2017-2022
TABLE 119 Argentina ESD Foam Packaging Market Value (US$ Mn), By Application Type 2012-2016
TABLE 120 Argentina ESD Foam Packaging Market Value (US$ Mn), By Application Type 2017-2022
TABLE 121 Argentina ESD Foam Packaging Market Value (US$ Mn), By Material & Additive Type 2012-2016
TABLE 122 Argentina ESD Foam Packaging Market Value (US$ Mn), By Material & Additive Type 2017-2022
TABLE 123 Argentina ESD Foam Packaging Market Value (US$ Mn), By End Use Industry 2012-2016
TABLE 124 Argentina ESD Foam Packaging Market Value (US$ Mn), By End Use Industry 2017-2022
TABLE 125 Germany ESD Foam Packaging Market Value (US$ Mn), By Application Type 2012-2016
TABLE 126 Germany ESD Foam Packaging Market Value (US$ Mn), By Application Type 2017-2022
TABLE 127 Germany ESD Foam Packaging Market Value (US$ Mn), By Material & Additive Type 2012-2016
TABLE 128 Germany ESD Foam Packaging Market Value (US$ Mn), By Material & Additive Type 2017-2022
TABLE 129 Germany ESD Foam Packaging Market Value (US$ Mn), By End Use Industry 2012-2016
TABLE 130 Germany ESD Foam Packaging Market Value (US$ Mn), By End Use Industry 2017-2022
TABLE 131 UK ESD Foam Packaging Market Value (US$ Mn), By Application Type 2012-2016
TABLE 132 UK ESD Foam Packaging Market Value (US$ Mn), By Application Type 2017-2022
TABLE 133 UK ESD Foam Packaging Market Value (US$ Mn), By Material & Additive Type 2012-2016
TABLE 134 UK ESD Foam Packaging Market Value (US$ Mn), By Material & Additive Type 2017-2022
TABLE 135 UK ESD Foam Packaging Market Value (US$ Mn), By End Use Industry 2012-2016
TABLE 136 UK ESD Foam Packaging Market Value (US$ Mn), By End Use Industry 2017-2022
TABLE 137 France ESD Foam Packaging Market Value (US$ Mn), By Application Type 2012-2016
TABLE 138 France ESD Foam Packaging Market Value (US$ Mn), By Application Type 2017-2022
TABLE 139 France ESD Foam Packaging Market Value (US$ Mn), By Material & Additive Type 2012-2016
TABLE 140 France ESD Foam Packaging Market Value (US$ Mn), By Material & Additive Type 2017-2022
TABLE 141 France ESD Foam Packaging Market Value (US$ Mn), By End Use Industry 2012-2016
TABLE 142 France ESD Foam Packaging Market Value (US$ Mn), By End Use Industry 2017-2022
TABLE 143 Spain ESD Foam Packaging Market Value (US$ Mn), By Application Type 2012-2016
TABLE 144 Spain ESD Foam Packaging Market Value (US$ Mn), By Application Type 2017-2022
TABLE 145 Spain ESD Foam Packaging Market Value (US$ Mn), By Material & Additive Type 2012-2016
TABLE 146 Spain ESD Foam Packaging Market Value (US$ Mn), By Material & Additive Type 2017-2022
TABLE 147 Spain ESD Foam Packaging Market Value (US$ Mn), By End Use Industry 2012-2016
TABLE 148 Spain ESD Foam Packaging Market Value (US$ Mn), By End Use Industry 2017-2022
TABLE 149 Italy ESD Foam Packaging Market Value (US$ Mn), By Application Type 2012-2016
TABLE 150 Italy ESD Foam Packaging Market Value (US$ Mn), By Application Type 2017-2022
TABLE 151 Italy ESD Foam Packaging Market Value (US$ Mn), By Material & Additive Type 2012-2016
TABLE 152 Italy ESD Foam Packaging Market Value (US$ Mn), By Material & Additive Type 2017-2022
TABLE 153 Italy ESD Foam Packaging Market Value (US$ Mn), By End Use Industry 2012-2016
TABLE 154 Italy ESD Foam Packaging Market Value (US$ Mn), By End Use Industry 2017-2022
TABLE 155 Russia ESD Foam Packaging Market Value (US$ Mn), By Application Type 2012-2016
TABLE 156 Russia ESD Foam Packaging Market Value (US$ Mn), By Application Type 2017-2022
TABLE 157 Russia ESD Foam Packaging Market Value (US$ Mn), By Material & Additive Type 2012-2016
TABLE 158 Russia ESD Foam Packaging Market Value (US$ Mn), By Material & Additive Type 2017-2022
TABLE 159 Russia ESD Foam Packaging Market Value (US$ Mn), By End Use Industry 2012-2016
TABLE 160 Russia ESD Foam Packaging Market Value (US$ Mn), By End Use Industry 2017-2022
TABLE 161 Japan ESD Foam Packaging Market Value (US$ Mn), By Application Type 2012-2016
TABLE 162 Japan ESD Foam Packaging Market Value (US$ Mn), By Application Type 2017-2022
TABLE 163 Japan ESD Foam Packaging Market Value (US$ Mn), By Material & Additive Type 2012-2016
TABLE 164 Japan ESD Foam Packaging Market Value (US$ Mn), By Material & Additive Type 2017-2022
TABLE 165 Japan ESD Foam Packaging Market Value (US$ Mn), By End Use Industry 2012-2016
TABLE 166 Japan ESD Foam Packaging Market Value (US$ Mn), By End Use Industry 2017-2022
TABLE 167 China ESD Foam Packaging Market Value (US$ Mn), By Application Type 2012-2016
TABLE 168 China ESD Foam Packaging Market Value (US$ Mn), By Application Type 2017-2022
TABLE 169 China ESD Foam Packaging Market Value (US$ Mn), By Material & Additive Type 2012-2016
TABLE 170 China ESD Foam Packaging Market Value (US$ Mn), By Material & Additive Type 2017-2022
TABLE 171 China ESD Foam Packaging Market Value (US$ Mn), By End Use Industry 2012-2016
TABLE 172 China ESD Foam Packaging Market Value (US$ Mn), By End Use Industry 2017-2022
TABLE 173 India ESD Foam Packaging Market Value (US$ Mn), By Application Type 2012-2016
TABLE 174 India ESD Foam Packaging Market Value (US$ Mn), By Application Type 2017-2022
TABLE 175 India ESD Foam Packaging Market Value (US$ Mn), By Material & Additive Type 2012-2016
TABLE 176 India ESD Foam Packaging Market Value (US$ Mn), By Material & Additive Type 2017-2022
TABLE 177 India ESD Foam Packaging Market Value (US$ Mn), By End Use Industry 2012-2016
TABLE 178 India ESD Foam Packaging Market Value (US$ Mn), By End Use Industry 2017-2022
TABLE 179 Malaysia ESD Foam Packaging Market Value (US$ Mn), By Application Type 2012-2016
TABLE 180 Malaysia ESD Foam Packaging Market Value (US$ Mn), By Application Type 2017-2022
TABLE 181 Malaysia ESD Foam Packaging Market Value (US$ Mn), By Material & Additive Type 2012-2016
TABLE 182 Malaysia ESD Foam Packaging Market Value (US$ Mn), By Material & Additive Type 2017-2022
TABLE 183 Malaysia ESD Foam Packaging Market Value (US$ Mn), By End Use Industry 2012-2016
TABLE 184 Malaysia ESD Foam Packaging Market Value (US$ Mn), By End Use Industry 2017-2022
TABLE 185 Thailand ESD Foam Packaging Market Value (US$ Mn), By Application Type 2012-2016
TABLE 186 Thailand ESD Foam Packaging Market Value (US$ Mn), By Application Type 2017-2022
TABLE 187 Thailand ESD Foam Packaging Market Value (US$ Mn), By Material & Additive Type 2012-2016
TABLE 188 Thailand ESD Foam Packaging Market Value (US$ Mn), By Material & Additive Type 2017-2022
TABLE 189 Thailand ESD Foam Packaging Market Value (US$ Mn), By End Use Industry 2012-2016
TABLE 190 Thailand ESD Foam Packaging Market Value (US$ Mn), By End Use Industry 2017-2022
TABLE 191 Singapore ESD Foam Packaging Market Value (US$ Mn), By Application Type 2012-2016
TABLE 192 Singapore ESD Foam Packaging Market Value (US$ Mn), By Application Type 2017-2022
TABLE 193 Singapore ESD Foam Packaging Market Value (US$ Mn), By Material & Additive Type 2012-2016
TABLE 194 Singapore ESD Foam Packaging Market Value (US$ Mn), By Material & Additive Type 2017-2022
TABLE 195 Singapore ESD Foam Packaging Market Value (US$ Mn), By End Use Industry 2012-2016
TABLE 196 Singapore ESD Foam Packaging Market Value (US$ Mn), By End Use Industry 2017-2022
TABLE 197 Australia ESD Foam Packaging Market Value (US$ Mn), By Application Type 2012-2016
TABLE 198 Australia ESD Foam Packaging Market Value (US$ Mn), By Application Type 2017-2022
TABLE 199 Australia ESD Foam Packaging Market Value (US$ Mn), By Material & Additive Type 2012-2016
TABLE 200 Australia ESD Foam Packaging Market Value (US$ Mn), By Material & Additive Type 2017-2022
TABLE 201 Australia ESD Foam Packaging Market Value (US$ Mn), By End Use Industry 2012-2016
TABLE 202 Australia ESD Foam Packaging Market Value (US$ Mn), By End Use Industry 2017-2022
TABLE 203 GCC Countries ESD Foam Packaging Market Value (US$ Mn), By Application Type 2012-2016
TABLE 204 GCC Countries ESD Foam Packaging Market Value (US$ Mn), By Application Type 2017-2022
TABLE 205 GCC Countries ESD Foam Packaging Market Value (US$ Mn), By Material & Additive Type 2012-2016
TABLE 206 GCC Countries ESD Foam Packaging Market Value (US$ Mn), By Material & Additive Type 2017-2022
TABLE 207 GCC Countries ESD Foam Packaging Market Value (US$ Mn), By End Use Industry 2012-2016
TABLE 208 GCC Countries ESD Foam Packaging Market Value (US$ Mn), By End Use Industry 2017-2022
TABLE 209 South Africa ESD Foam Packaging Market Value (US$ Mn), By Application Type 2012-2016
TABLE 210 South Africa ESD Foam Packaging Market Value (US$ Mn), By Application Type 2017-2022
TABLE 211 South Africa ESD Foam Packaging Market Value (US$ Mn), By Material & Additive Type 2012-2016
TABLE 212 South Africa ESD Foam Packaging Market Value (US$ Mn), By Material & Additive Type 2017-2022
TABLE 213 South Africa ESD Foam Packaging Market Value (US$ Mn), By End Use Industry 2012-2016
TABLE 214 South Africa ESD Foam Packaging Market Value (US$ Mn), By End Use Industry 2017-2022
TABLE 215 Nigeria ESD Foam Packaging Market Value (US$ Mn), By Application Type 2012-2016
TABLE 216 Nigeria ESD Foam Packaging Market Value (US$ Mn), By Application Type 2017-2022
TABLE 217 Nigeria ESD Foam Packaging Market Value (US$ Mn), By Material & Additive Type 2012-2016
TABLE 218 Nigeria ESD Foam Packaging Market Value (US$ Mn), By Material & Additive Type 2017-2022
TABLE 219 Nigeria ESD Foam Packaging Market Value (US$ Mn), By End Use Industry 2012-2016
TABLE 220 Nigeria ESD Foam Packaging Market Value (US$ Mn), By End Use Industry 2017-2022
TABLE 221 Israel ESD Foam Packaging Market Value (US$ Mn), By Application Type 2012-2016
TABLE 222 Israel ESD Foam Packaging Market Value (US$ Mn), By Application Type 2017-2022
TABLE 223 Israel ESD Foam Packaging Market Value (US$ Mn), By Material & Additive Type 2012-2016
TABLE 224 Israel ESD Foam Packaging Market Value (US$ Mn), By Material & Additive Type 2017-2022
TABLE 225 Israel ESD Foam Packaging Market Value (US$ Mn), By End Use Industry 2012-2016
TABLE 226 Israel ESD Foam Packaging Market Value (US$ Mn), By End Use Industry 2017-2022
List of Figures
FIG. 1 Global ESD Foam Packaging Market Value (US$ Mn), 2012-2016
FIG. 2 Global ESD Foam Packaging Market Value (US$ Mn) Forecast, 2017-2022
FIG. 3 Global ESD Foam Packaging Market Value (US$ Mn) and Y-o-Y, 2015-2022
FIG. 4 Global Electrical & Electronic Component Segment Market Value (US$ Mn) By Region, 2012-2016
FIG. 5 Global Electrical & Electronic Component Segment Market Value (US$ Mn) By Region, 2017-2022
FIG. 6 Global Electrical & Electronic Component Segment Y-o-Y Growth Rate, By Region, 2015-2022
FIG. 7 Global Others Segment Market Value (US$ Mn) By Region, 2012-2016
FIG. 8 Global Others Segment Market Value (US$ Mn) By Region, 2017-2022
FIG. 9 Global Others Segment Y-o-Y Growth Rate, By Region, 2015-2022
FIG. 10 Global Conductive & Dissipative Polymers Segment Market Value (US$ Mn) By Region, 2012-2016
FIG. 11 Global Conductive & Dissipative Polymers Segment Market Value (US$ Mn) By Region, 2017-2022
FIG. 12 Global Conductive & Dissipative Polymers Segment Y-o-Y Growth Rate, By Region, 2015-2022
FIG. 13 Global Metal Segment Market Value (US$ Mn) By Region, 2012-2016
FIG. 14 Global Metal Segment Market Value (US$ Mn) By Region, 2017-2022
FIG. 15 Global Metal Segment Y-o-Y Growth Rate, By Region, 2015-2022
FIG. 16 Global Additive Segment Market Value (US$ Mn) By Region, 2012-2016
FIG. 17 Global Additive Segment Market Value (US$ Mn) By Region, 2017-2022
FIG. 18 Global Additive Segment Y-o-Y Growth Rate, By Region, 2015-2022
FIG. 19 Global Electrical & Electronics Segment Market Value (US$ Mn) By Region, 2012-2016
FIG. 20 Global Electrical & Electronics Segment Market Value (US$ Mn) By Region, 2017-2022
FIG. 21 Global Electrical & Electronics Segment Y-o-Y Growth Rate, By Region, 2015-2022
FIG. 22 Global Automobile Segment Market Value (US$ Mn) By Region, 2012-2016
FIG. 23 Global Automobile Segment Market Value (US$ Mn) By Region, 2017-2022
FIG. 24 Global Automobile Segment Y-o-Y Growth Rate, By Region, 2015-2022
FIG. 25 Global Defence & Military Segment Market Value (US$ Mn) By Region, 2012-2016
FIG. 26 Global Defence & Military Segment Market Value (US$ Mn) By Region, 2017-2022
FIG. 27 Global Defence & Military Segment Y-o-Y Growth Rate, By Region, 2015-2022
FIG. 28 Global Manufacturing Segment Market Value (US$ Mn) By Region, 2012-2016
FIG. 29 Global Manufacturing Segment Market Value (US$ Mn) By Region, 2017-2022
FIG. 30 Global Manufacturing Segment Y-o-Y Growth Rate, By Region, 2015-2022
FIG. 31 Global Aerospace Segment Market Value (US$ Mn) By Region, 2012-2016
FIG. 32 Global Aerospace Segment Market Value (US$ Mn) By Region, 2017-2022
FIG. 33 Global Aerospace Segment Y-o-Y Growth Rate, By Region, 2015-2022
FIG. 34 Global Other End Use Segment Market Value (US$ Mn) By Region, 2012-2016
FIG. 35 Global Other End Use Segment Market Value (US$ Mn) By Region, 2017-2022
FIG. 36 Global Other End Use Segment Y-o-Y Growth Rate, By Region, 2015-2022
FIG. 37 North America ESD Foam Packaging Market Value (US$ Mn), By Application Type 2012-2016
FIG. 38 North America ESD Foam Packaging Market Value (US$ Mn), By Application Type 2017-2022
FIG. 39 North America ESD Foam Packaging Market Value (US$ Mn), By Material & Additive Type 2012-2016
FIG. 40 North America ESD Foam Packaging Market Value (US$ Mn), By Material & Additive Type 2017-2022
FIG. 41 North America ESD Foam Packaging Market Value (US$ Mn), By End Use Industry 2012-2016
FIG. 42 North America ESD Foam Packaging Market Value (US$ Mn), By End Use Industry 2017-2022
FIG. 43 Latin America ESD Foam Packaging Market Value (US$ Mn), By Application Type 2012-2016
FIG. 44 Latin America ESD Foam Packaging Market Value (US$ Mn), By Application Type 2017-2022
FIG. 45 Latin America ESD Foam Packaging Market Value (US$ Mn), By Material & Additive Type 2012-2016
FIG. 46 Latin America ESD Foam Packaging Market Value (US$ Mn), By Material & Additive Type 2017-2022
FIG. 47 Latin America ESD Foam Packaging Market Value (US$ Mn), By End Use Industry 2012-2016
FIG. 48 Latin America ESD Foam Packaging Market Value (US$ Mn), By End Use Industry 2017-2022
FIG. 49 Europe ESD Foam Packaging Market Value (US$ Mn), By Application Type 2012-2016
FIG. 50 Europe ESD Foam Packaging Market Value (US$ Mn), By Application Type 2017-2022
FIG. 51 Europe ESD Foam Packaging Market Value (US$ Mn), By Material & Additive Type 2012-2016
FIG. 52 Europe ESD Foam Packaging Market Value (US$ Mn), By Material & Additive Type 2017-2022
FIG. 53 Europe ESD Foam Packaging Market Value (US$ Mn), By End Use Industry 2012-2016
FIG. 54 Europe ESD Foam Packaging Market Value (US$ Mn), By End Use Industry 2017-2022
FIG. 55 Japan ESD Foam Packaging Market Value (US$ Mn), By Application Type 2012-2016
FIG. 56 Japan ESD Foam Packaging Market Value (US$ Mn), By Application Type 2017-2022
FIG. 57 Japan ESD Foam Packaging Market Value (US$ Mn), By Material & Additive Type 2012-2016
FIG. 58 Japan ESD Foam Packaging Market Value (US$ Mn), By Material & Additive Type 2017-2022
FIG. 59 Japan ESD Foam Packaging Market Value (US$ Mn), By End Use Industry 2012-2016
FIG. 60 Japan ESD Foam Packaging Market Value (US$ Mn), By End Use Industry 2017-2022
FIG. 61 APEJ ESD Foam Packaging Market Value (US$ Mn), By Application Type 2012-2016
FIG. 62 APEJ ESD Foam Packaging Market Value (US$ Mn), By Application Type 2017-2022
FIG. 63 APEJ ESD Foam Packaging Market Value (US$ Mn), By Material & Additive Type 2012-2016
FIG. 64 APEJ ESD Foam Packaging Market Value (US$ Mn), By Material & Additive Type 2017-2022
FIG. 65 APEJ ESD Foam Packaging Market Value (US$ Mn), By End Use Industry 2012-2016
FIG. 66 APEJ ESD Foam Packaging Market Value (US$ Mn), By End Use Industry 2017-2022
FIG. 67 MEA ESD Foam Packaging Market Value (US$ Mn), By Application Type 2012-2016
FIG. 68 MEA ESD Foam Packaging Market Value (US$ Mn), By Application Type 2017-2022
FIG. 69 MEA ESD Foam Packaging Market Value (US$ Mn), By Material & Additive Type 2012-2016
FIG. 70 MEA ESD Foam Packaging Market Value (US$ Mn), By Material & Additive Type 2017-2022
FIG. 71 MEA ESD Foam Packaging Market Value (US$ Mn), By End Use Industry 2012-2016
FIG. 72 MEA ESD Foam Packaging Market Value (US$ Mn), By End Use Industry 2017-2022
Copyright © Transparency Market Research, Inc. All Rights reserved
Trust Online

ESD Foam Packaging Market