
Reports
Reports
The global eco friendly bottles market has risen at a rapid pace in recent years in response to the growing support to environmental causes from governments and the masses alike. The eco friendly bottles market has been driven by the eagerness of key competitors to cash in on the growing support to environmentalism, which has led to consistent innovation, as well as steady government support. The steady prevalence of these drivers is likely to enable rapid growth of the eco friendly bottles market in the coming years.
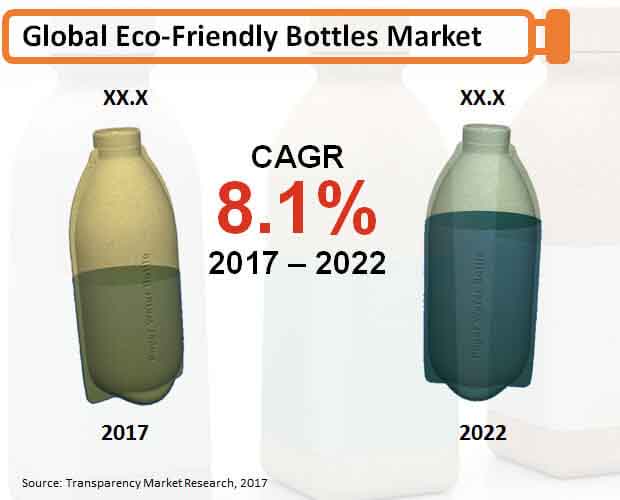
According to Transparency Market Research, the global eco friendly bottles market was valued at US$2.5 bn in 2017 and is likely to rise to US$3.7 bn by 2022, exhibiting a strong 8.1% CAGR therein.
The global eco friendly bottles market employs a number of materials in order to produce high-quality eco friendly bottles. Currently, polylactic acid is the dominant material segment of the global eco friendly bottles market and is likely to dominate the market’s proceedings in the coming years due to its widespread usage. Polylactic acid accounted for 35.3% of the global eco friendly bottles market in 2017 with a valuation of US$902.3 mn. The segment is expected to rise to US$1,322.8 mn by 2022 at a strong CAGR of 8%. The mechanical properties of polylactic acid make it favorable for use in the production of bottles, which is likely to ensure steady growth of the segment in the global eco friendly bottles market in the coming years.
The leading regional contributor to the global eco friendly bottles market is North America, which is likely to retain its dominance through the forecast period thanks to the widespread distribution of environment-friendly infrastructure in the developed region and the steady government support for expansion of the same. The eco friendly bottles market in North America was valued at US$617.2 mn in 2017 and is expected to rise to US$1,123.4 mn by 2022, exhibiting a solid 12.7% CAGR from 2017 to 2022.
Europe is also an important contributor to the global eco friendly bottles market and is likely to remain a key region for technological development as well as sales expansion for the eco friendly bottles market. Like in North America, the eco friendly bottles market enjoys solid government support in Europe, where environmental conservation has been a valued tenet of most governments. The Europe market for eco friendly bottles accounted for more than 32% of the global market’s revenue in 2017.
The Asia Pacific except Japan market for eco friendly bottles could emerge as a significant player in the coming years, with the market expected to create an absolute opportunity of US$252.2 mn over the 2017-2022 forecast period. The Japan market for eco friendly bottles is also set to rise to a strong valuation of US$228.2 mn by 2022, exhibiting a steady 6.2% CAGR upon its 2017 valuation.
Leading players in the global eco friendly bottles market include EcoXpac A/S, One Green Bottle, Earthlust, Ecologic Brands Inc., SKS Bottle and Packaging Inc., Cascade Designs Inc., Pachamama, and Pepsi-Cola Metropolitan Bottling Company.
Inclination of a Considerable Populace toward Environment Conservation to Influence the Growth Opportunities across the Eco Friendly Bottles Market
Environment conservation has become an important aspect across the globe. The rising awareness about using eco-friendly products and the growing concerns of environmental pollution will boost the growth to a great extent. The rate of plastic bottles being dropped in landfills has increased phenomenally over the years. This aspect has led to an increase in pollution levels considerably. Eco friendly bottles act as a feasible alternative for plastic bottles, eventually leading to an increased growth rate.
1. Global Eco-Friendly Bottles Market - Executive Summary
2. Global Eco-Friendly Bottles Market Overview
2.1. Introduction
2.1.1. Global Eco-Friendly Bottles Market Taxonomy
2.1.2. Global Eco-Friendly Bottles Market Definition
2.2. Global Eco-Friendly Bottles Market Size (US$ Mn) and Forecast, 2012-2022
2.2.1. Global Eco-Friendly Bottles Market Y-o-Y Growth
2.3. Global Eco-Friendly Bottles Market Dynamics
2.4. Value Chain
2.5. Cost Structure
2.6. Product Innovations
2.7. Market Opportunities
2.8.Region Wise Market Positioning Assessment
3. Global Eco-Friendly Bottles Market Analysis and Forecast By Material
3.1. Global Eco-Friendly Bottles Market Size and Forecast By Material, 2012-2022
3.1.1. Polylactic Acid Market Size and Forecast, 2012-2022
3.1.1.1. Revenue (US$ Mn) Comparison, By Region
3.1.1.2. Market Share Comparison, By Region
3.1.1.3. Y-o-Y growth Comparison, By Region
3.1.2. Starch Market Size and Forecast, 2012-2022
3.1.2.1. Revenue (US$ Mn) Comparison, By Region
3.1.2.2. Market Share Comparison, By Region
3.1.2.3. Y-o-Y growth Comparison, By Region
3.1.3. Water Soluble Polymer Market Size and Forecast, 2012-2022
3.1.3.1. Revenue (US$ Mn) Comparison, By Region
3.1.3.2. Market Share Comparison, By Region
3.1.3.3. Y-o-Y growth Comparison, By Region
3.1.4. Cellulose Market Size and Forecast, 2012-2022
3.1.4.1. Revenue (US$ Mn) Comparison, By Region
3.1.4.2. Market Share Comparison, By Region
3.1.4.3. Y-o-Y growth Comparison, By Region
3.1.5. Aliphatic/aromatic co-polyesters Market Size and Forecast, 2012-2022
3.1.5.1. Revenue (US$ Mn) Comparison, By Region
3.1.5.2. Market Share Comparison, By Region
3.1.5.3. Y-o-Y growth Comparison, By Region
3.1.6. Moulded Fibre Market Size and Forecast, 2012-2022
3.1.6.1. Revenue (US$ Mn) Comparison, By Region
3.1.6.2. Market Share Comparison, By Region
3.1.6.3. Y-o-Y growth Comparison, By Region
3.1.7. Polyhydroxyalkanoates Market Size and Forecast, 2012-2022
3.1.7.1. Revenue (US$ Mn) Comparison, By Region
3.1.7.2. Market Share Comparison, By Region
3.1.7.3. Y-o-Y growth Comparison, By Region
3.1.8. Bio-derived polyethylene Market Size and Forecast, 2012-2022
3.1.8.1. Revenue (US$ Mn) Comparison, By Region
3.1.8.2. Market Share Comparison, By Region
3.1.8.3. Y-o-Y growth Comparison, By Region
3.1.9. Other Materials Market Size and Forecast, 2012-2022
3.1.9.1. Revenue (US$ Mn) Comparison, By Region
3.1.9.2. Market Share Comparison, By Region
3.1.9.3. Y-o-Y growth Comparison, By Region
4. Global Eco-Friendly Bottles Market Analysis and Forecast By Application
4.1. Global Eco-Friendly Bottles Market Size and Forecast By Application, 2012-2022
4.1.1. Mineral Water Packaging Market Size and Forecast, 2012-2022
4.1.1.1. Revenue (US$ Mn) Comparison, By Region
4.1.1.2. Market Share Comparison, By Region
4.1.1.3. Y-o-Y growth Comparison, By Region
4.1.2. Non-Alcoholic Beverage Packaging Market Size and Forecast, 2012-2022
4.1.2.1. Revenue (US$ Mn) Comparison, By Region
4.1.2.2. Market Share Comparison, By Region
4.1.2.3. Y-o-Y growth Comparison, By Region
4.1.3. Household Product Market Size and Forecast, 2012-2022
4.1.3.1. Revenue (US$ Mn) Comparison, By Region
4.1.3.2. Market Share Comparison, By Region
4.1.3.3. Y-o-Y growth Comparison, By Region
4.1.4. Other Applications Market Size and Forecast, 2012-2022
4.1.4.1. Revenue (US$ Mn) Comparison, By Region
4.1.4.2. Market Share Comparison, By Region
4.1.4.3. Y-o-Y growth Comparison, By Region
5. Global Eco-Friendly Bottles Market Analysis and Forecast By Region
5.1. Global Eco-Friendly Bottles Market Size and Forecast, 2012-2022
5.1.1. North America Eco-Friendly Bottles Market Size and Forecast, 2012-2022
5.1.1.1. Revenue (US$ Mn) Comparison, By Material
5.1.1.2. Revenue (US$ Mn) Comparison, By Application
5.1.2. Latin America Eco-Friendly Bottles Market Size and Forecast, 2012-2022
5.1.2.1. Revenue (US$ Mn) Comparison, By Material
5.1.2.2. Revenue (US$ Mn) Comparison, By Application
5.1.3. Europe Eco-Friendly Bottles Market Size and Forecast, 2012-2022
5.1.3.1. Revenue (US$ Mn) Comparison, By Material
5.1.3.2. Revenue (US$ Mn) Comparison, By Application
5.1.4. Japan Eco-Friendly Bottles Market Size and Forecast, 2012-2022
5.1.4.1. Revenue (US$ Mn) Comparison, By Material
5.1.4.2. Revenue (US$ Mn) Comparison, By Application
5.1.5. APEJ Eco-Friendly Bottles Market Size and Forecast, 2012-2022
5.1.5.1. Revenue (US$ Mn) Comparison, By Material
5.1.5.2. Revenue (US$ Mn) Comparison, By Application
5.1.6. MEA Eco-Friendly Bottles Market Size and Forecast, 2012-2022
5.1.6.1. Revenue (US$ Mn) Comparison, By Material
5.1.6.2. Revenue (US$ Mn) Comparison, By Application
6. North America Eco-Friendly Bottles Market Analysis and Forecast, By Country, 2012-2022
6.1. US Eco-Friendly Bottles Market Size and Forecast, 2012-2022
6.1.1. Revenue (US$ Mn) Comparison, By Material
6.1.2. Revenue (US$ Mn) Comparison, By Application
6.2. Canada Eco-Friendly Bottles Market Size and Forecast, 2012-2022
6.2.1. Revenue (US$ Mn) Comparison, By Material
6.2.2. Revenue (US$ Mn) Comparison, By Application
7. Latin America Eco-Friendly Bottles Market Analysis and Forecast, By Country, 2012-2022
7.1. Brazil Eco-Friendly Bottles Market Size and Forecast, 2012-2022
7.1.1. Revenue (US$ Mn) Comparison, By Material
7.1.2. Revenue (US$ Mn) Comparison, By Application
7.2. Mexico Eco-Friendly Bottles Market Size and Forecast, 2012-2022
7.2.1. Revenue (US$ Mn) Comparison, By Material
7.2.2. Revenue (US$ Mn) Comparison, By Application
7.3. Argentina Eco-Friendly Bottles Market Size and Forecast, 2012-2022
7.3.1. Revenue (US$ Mn) Comparison, By Material
7.3.2. Revenue (US$ Mn) Comparison, By Application
8. Europe Eco-Friendly Bottles Market Analysis and Forecast, By Country, 2012-2022
8.1. Germany Eco-Friendly Bottles Market Size and Forecast, 2012-2022
8.1.1. Revenue (US$ Mn) Comparison, By Material
8.1.2. Revenue (US$ Mn) Comparison, By Application
8.2. UK Eco-Friendly Bottles Market Size and Forecast, 2012-2022
8.2.1. Revenue (US$ Mn) Comparison, By Material
8.2.2. Revenue (US$ Mn) Comparison, By Application
8.3. France Eco-Friendly Bottles Market Size and Forecast, 2012-2022
8.3.1. Revenue (US$ Mn) Comparison, By Material
8.3.2. Revenue (US$ Mn) Comparison, By Application
8.4. Spain Eco-Friendly Bottles Market Size and Forecast, 2012-2022
8.4.1. Revenue (US$ Mn) Comparison, By Material
8.4.2. Revenue (US$ Mn) Comparison, By Application
8.5. Italy Eco-Friendly Bottles Market Size and Forecast, 2012-2022
8.5.1. Revenue (US$ Mn) Comparison, By Material
8.5.2. Revenue (US$ Mn) Comparison, By Application
8.6. Nordic Eco-Friendly Bottles Market Size and Forecast, 2012-2022
8.6.1. Revenue (US$ Mn) Comparison, By Material
8.6.2. Revenue (US$ Mn) Comparison, By Application
9. Japan Eco-Friendly Bottles Market Analysis and Forecast, By Country, 2012-2022
9.1. Japan Eco-Friendly Bottles Market Size and Forecast, 2012-2022
9.1.1. Revenue (US$ Mn) Comparison, By Material
9.1.2. Revenue (US$ Mn) Comparison, By Application
10. APEJ Eco-Friendly Bottles Market Analysis and Forecast, By Country, 2012-2022
10.1. China Eco-Friendly Bottles Market Size and Forecast, 2012-2022
10.1.1. Revenue (US$ Mn) Comparison, By Material
10.1.2. Revenue (US$ Mn) Comparison, By Application
10.2. India Eco-Friendly Bottles Market Size and Forecast, 2012-2022
10.2.1. Revenue (US$ Mn) Comparison, By Material
10.2.2. Revenue (US$ Mn) Comparison, By Application
10.3. Malaysia Eco-Friendly Bottles Market Size and Forecast, 2012-2022
10.3.1. Revenue (US$ Mn) Comparison, By Material
10.3.2. Revenue (US$ Mn) Comparison, By Application
10.4. Thailand Eco-Friendly Bottles Market Size and Forecast, 2012-2022
10.4.1. Revenue (US$ Mn) Comparison, By Material
10.4.2. Revenue (US$ Mn) Comparison, By Application
10.5. Singapore Eco-Friendly Bottles Market Size and Forecast, 2012-2022
10.5.1. Revenue (US$ Mn) Comparison, By Material
10.5.2. Revenue (US$ Mn) Comparison, By Application
10.6. Australia Eco-Friendly Bottles Market Size and Forecast, 2012-2022
10.6.1. Revenue (US$ Mn) Comparison, By Material
10.6.2. Revenue (US$ Mn) Comparison, By Application
11. MEA Eco-Friendly Bottles Market Analysis and Forecast, By Country, 2012-2022
11.1. GCC Countries Eco-Friendly Bottles Market Size and Forecast, 2012-2022
11.1.1. Revenue (US$ Mn) Comparison, By Material
11.1.2. Revenue (US$ Mn) Comparison, By Application
11.2. South Africa Eco-Friendly Bottles Market Size and Forecast, 2012-2022
11.2.1. Revenue (US$ Mn) Comparison, By Material
11.2.2. Revenue (US$ Mn) Comparison, By Application
11.3. Nigeria Eco-Friendly Bottles Market Size and Forecast, 2012-2022
11.3.1. Revenue (US$ Mn) Comparison, By Material
11.3.2. Revenue (US$ Mn) Comparison, By Application
11.4. Israel Eco-Friendly Bottles Market Size and Forecast, 2012-2022
11.4.1. Revenue (US$ Mn) Comparison, By Material
11.4.2. Revenue (US$ Mn) Comparison, By Application
12. Global Eco-Friendly Bottles Market Company Share, Competition Landscape and Company Profiles
12.1. Company Profiles
12.1.1. EcoXpac A/S
12.1.2. Ecologic Brands Inc
12.1.3. One Green Bottle
12.1.4. Cascade Designs, Inc.
12.1.5. SKS Bottle and Packaging, Inc.
12.1.6. EarthLust
12.1.7.Pachamama
12.1.8. Pepsi-Cola Metropolitan Bottling Company, Inc.
12.1.9. Other Key Players
13. Research Methodology
14. Secondary and Primary Sources
15. Assumptions and Acronyms
16. Disclaimer
List of Tables
TABLE 1 Global Eco-Friendly Bottles Market Value (US$ Mn), 2012-2016
TABLE 2 Global Eco-Friendly Bottles Market Value (US$ Mn), 2017-2022
TABLE 3 Global Eco-Friendly Bottles Market Value (US$ Mn) and Y-o-Y, 2015-2022
TABLE 4 Global Polylactic Acid Segment Value (US$ Mn), By Region 2012-2016
TABLE 5 Global Polylactic Acid Segment Value (US$ Mn), By Region 2017-2022
TABLE 6 Global Polylactic Acid Segment Market Share, By Region 2012-2016
TABLE 7 Global Polylactic Acid Segment Market Share, By Region 2017-2022
TABLE 8 Global Polylactic Acid Segment Y-o-Y, By Region 2015-2022
TABLE 9 Global Starch Segment Value (US$ Mn), By Region 2012-2016
TABLE 10 Global Starch Segment Value (US$ Mn), By Region 2017-2022
TABLE 11 Global Starch Segment Market Share, By Region 2012-2016
TABLE 12 Global Starch Segment Market Share, By Region 2017-2022
TABLE 13 Global Starch Segment Y-o-Y, By Region 2015-2022
TABLE 14 Global Water Soluble Polymer Segment Value (US$ Mn), By Region 2012-2016
TABLE 15 Global Water Soluble Polymer Segment Value (US$ Mn), By Region 2017-2022
TABLE 16 Global Water Soluble Polymer Segment Market Share, By Region 2012-2016
TABLE 17 Global Water Soluble Polymer Segment Market Share, By Region 2017-2022
TABLE 18 Global Water Soluble Polymer Segment Y-o-Y, By Region 2015-2022
TABLE 19 Global Cellulose Segment Value (US$ Mn), By Region 2012-2016
TABLE 20 Global Cellulose Segment Value (US$ Mn), By Region 2017-2022
TABLE 21 Global Cellulose Segment Market Share, By Region 2012-2016
TABLE 22 Global Cellulose Segment Market Share, By Region 2017-2022
TABLE 23 Global Cellulose Segment Y-o-Y, By Region 2015-2022
TABLE 24 Global Aliphatic/aromatic co-polyesters Segment Value (US$ Mn), By Region 2012-2016
TABLE 25 Global Aliphatic/aromatic co-polyesters Segment Value (US$ Mn), By Region 2017-2022
TABLE 26 Global Aliphatic/aromatic co-polyesters Segment Market Share, By Region 2012-2016
TABLE 27 Global Aliphatic/aromatic co-polyesters Segment Market Share, By Region 2017-2022
TABLE 28 Global Aliphatic/aromatic co-polyesters Segment Y-o-Y, By Region 2015-2022
TABLE 29 Global Moulded Fibre Segment Value (US$ Mn), By Region 2012-2016
TABLE 30 Global Moulded Fibre Segment Value (US$ Mn), By Region 2017-2022
TABLE 31 Global Moulded Fibre Segment Market Share, By Region 2012-2016
TABLE 32 Global Moulded Fibre Segment Market Share, By Region 2017-2022
TABLE 33 Global Moulded Fibre Segment Y-o-Y, By Region 2015-2022
TABLE 34 Global Polyhydroxyalkanoates Segment Value (US$ Mn), By Region 2012-2016
TABLE 35 Global Polyhydroxyalkanoates Segment Value (US$ Mn), By Region 2017-2022
TABLE 36 Global Polyhydroxyalkanoates Segment Market Share, By Region 2012-2016
TABLE 37 Global Polyhydroxyalkanoates Segment Market Share, By Region 2017-2022
TABLE 38 Global Polyhydroxyalkanoates Segment Y-o-Y, By Region 2015-2022
TABLE 39 Global Bio-derived polyethylene Segment Value (US$ Mn), By Region 2012-2016
TABLE 40 Global Bio-derived polyethylene Segment Value (US$ Mn), By Region 2017-2022
TABLE 41 Global Bio-derived polyethylene Segment Market Share, By Region 2012-2016
TABLE 42 Global Bio-derived polyethylene Segment Market Share, By Region 2017-2022
TABLE 43 Global Bio-derived polyethylene Segment Y-o-Y, By Region 2015-2022
TABLE 44 Global Other Materials Segment Value (US$ Mn), By Region 2012-2016
TABLE 45 Global Other Materials Segment Value (US$ Mn), By Region 2017-2022
TABLE 46 Global Other Materials Segment Market Share, By Region 2012-2016
TABLE 47 Global Other Materials Segment Market Share, By Region 2017-2022
TABLE 48 Global Other Materials Segment Y-o-Y, By Region 2015-2022
TABLE 49 Global Mineral Water Packaging Segment Value (US$ Mn), By Region 2012-2016
TABLE 50 Global Mineral Water Packaging Segment Value (US$ Mn), By Region 2017-2022
TABLE 51 Global Mineral Water Packaging Segment Market Share, By Region 2012-2016
TABLE 52 Global Mineral Water Packaging Segment Market Share, By Region 2017-2022
TABLE 53 Global Mineral Water Packaging Segment Y-o-Y, By Region 2015-2022
TABLE 54 Global Non-Alcoholic Beverage Packaging Segment Value (US$ Mn), By Region 2012-2016
TABLE 55 Global Non-Alcoholic Beverage Packaging Segment Value (US$ Mn), By Region 2017-2022
TABLE 56 Global Non-Alcoholic Beverage Packaging Segment Market Share, By Region 2012-2016
TABLE 57 Global Non-Alcoholic Beverage Packaging Segment Market Share, By Region 2017-2022
TABLE 58 Global Non-Alcoholic Beverage Packaging Segment Y-o-Y, By Region 2015-2022
TABLE 59 Global Household Product Segment Value (US$ Mn), By Region 2012-2016
TABLE 60 Global Household Product Segment Value (US$ Mn), By Region 2017-2022
TABLE 61 Global Household Product Segment Market Share, By Region 2012-2016
TABLE 62 Global Household Product Segment Market Share, By Region 2017-2022
TABLE 63 Global Household Product Segment Y-o-Y, By Region 2015-2022
TABLE 64 Global Other Applications Segment Value (US$ Mn), By Region 2012-2016
TABLE 65 Global Other Applications Segment Value (US$ Mn), By Region 2017-2022
TABLE 66 Global Other Applications Segment Market Share, By Region 2012-2016
TABLE 67 Global Other Applications Segment Market Share, By Region 2017-2022
TABLE 68 Global Other Applications Segment Y-o-Y, By Region 2015-2022
TABLE 69 North America Eco-Friendly Bottles Market Value (US$ Mn), By Material 2012-2016
TABLE 70 North America Eco-Friendly Bottles Market Value (US$ Mn), By Material 2017-2022
TABLE 71 North America Eco-Friendly Bottles Market Value (US$ Mn), By Application 2012-2016
TABLE 72 North America Eco-Friendly Bottles Market Value (US$ Mn), By Application 2017-2022
TABLE 73 Latin America Eco-Friendly Bottles Market Value (US$ Mn), By Material 2012-2016
TABLE 74 Latin America Eco-Friendly Bottles Market Value (US$ Mn), By Material 2017-2022
TABLE 75 Latin America Eco-Friendly Bottles Market Value (US$ Mn), By Application 2012-2016
TABLE 76 Latin America Eco-Friendly Bottles Market Value (US$ Mn), By Application 2017-2022
TABLE 77 Europe Eco-Friendly Bottles Market Value (US$ Mn), By Material 2012-2016
TABLE 78 Europe Eco-Friendly Bottles Market Value (US$ Mn), By Material 2017-2022
TABLE 79 Europe Eco-Friendly Bottles Market Value (US$ Mn), By Application 2012-2016
TABLE 80 Europe Eco-Friendly Bottles Market Value (US$ Mn), By Application 2017-2022
TABLE 81 Japan Eco-Friendly Bottles Market Value (US$ Mn), By Material 2012-2016
TABLE 82 Japan Eco-Friendly Bottles Market Value (US$ Mn), By Material 2017-2022
TABLE 83 Japan Eco-Friendly Bottles Market Value (US$ Mn), By Application 2012-2016
TABLE 84 Japan Eco-Friendly Bottles Market Value (US$ Mn), By Application 2017-2022
TABLE 85 APEJ Eco-Friendly Bottles Market Value (US$ Mn), By Material 2012-2016
TABLE 86 APEJ Eco-Friendly Bottles Market Value (US$ Mn), By Material 2017-2022
TABLE 87 APEJ Eco-Friendly Bottles Market Value (US$ Mn), By Application 2012-2016
TABLE 88 APEJ Eco-Friendly Bottles Market Value (US$ Mn), By Application 2017-2022
TABLE 89 MEA Eco-Friendly Bottles Market Value (US$ Mn), By Material 2012-2016
TABLE 90 MEA Eco-Friendly Bottles Market Value (US$ Mn), By Material 2017-2022
TABLE 91 MEA Eco-Friendly Bottles Market Value (US$ Mn), By Application 2012-2016
TABLE 92 MEA Eco-Friendly Bottles Market Value (US$ Mn), By Application 2017-2022
TABLE 93 US Eco-Friendly Bottles Market Value (US$ Mn), By Material 2012-2016
TABLE 94 US Eco-Friendly Bottles Market Value (US$ Mn), By Material 2017-2022
TABLE 95 US Eco-Friendly Bottles Market Value (US$ Mn), By Application 2012-2016
TABLE 96 US Eco-Friendly Bottles Market Value (US$ Mn), By Application 2017-2022
TABLE 97 Canada Eco-Friendly Bottles Market Value (US$ Mn), By Material 2012-2016
TABLE 98 Canada Eco-Friendly Bottles Market Value (US$ Mn), By Material 2017-2022
TABLE 99 Canada Eco-Friendly Bottles Market Value (US$ Mn), By Application 2012-2016
TABLE 100 Canada Eco-Friendly Bottles Market Value (US$ Mn), By Application 2017-2022
TABLE 101 Brazil Eco-Friendly Bottles Market Value (US$ Mn), By Material 2012-2016
TABLE 102 Brazil Eco-Friendly Bottles Market Value (US$ Mn), By Material 2017-2022
TABLE 103 Brazil Eco-Friendly Bottles Market Value (US$ Mn), By Application 2012-2016
TABLE 104 Brazil Eco-Friendly Bottles Market Value (US$ Mn), By Application 2017-2022
TABLE 105 Mexico Eco-Friendly Bottles Market Value (US$ Mn), By Material 2012-2016
TABLE 106 Mexico Eco-Friendly Bottles Market Value (US$ Mn), By Material 2017-2022
TABLE 107 Mexico Eco-Friendly Bottles Market Value (US$ Mn), By Application 2012-2016
TABLE 108 Mexico Eco-Friendly Bottles Market Value (US$ Mn), By Application 2017-2022
TABLE 109 Argentina Eco-Friendly Bottles Market Value (US$ Mn), By Material 2012-2016
TABLE 110 Argentina Eco-Friendly Bottles Market Value (US$ Mn), By Material 2017-2022
TABLE 111 Argentina Eco-Friendly Bottles Market Value (US$ Mn), By Application 2012-2016
TABLE 112 Argentina Eco-Friendly Bottles Market Value (US$ Mn), By Application 2017-2022
TABLE 113 Germany Eco-Friendly Bottles Market Value (US$ Mn), By Material 2012-2016
TABLE 114 Germany Eco-Friendly Bottles Market Value (US$ Mn), By Material 2017-2022
TABLE 115 Germany Eco-Friendly Bottles Market Value (US$ Mn), By Application 2012-2016
TABLE 116 Germany Eco-Friendly Bottles Market Value (US$ Mn), By Application 2017-2022
TABLE 117 UK Eco-Friendly Bottles Market Value (US$ Mn), By Material 2012-2016
TABLE 118 UK Eco-Friendly Bottles Market Value (US$ Mn), By Material 2017-2022
TABLE 119 UK Eco-Friendly Bottles Market Value (US$ Mn), By Application 2012-2016
TABLE 120 UK Eco-Friendly Bottles Market Value (US$ Mn), By Application 2017-2022
TABLE 121 France Eco-Friendly Bottles Market Value (US$ Mn), By Material 2012-2016
TABLE 122 France Eco-Friendly Bottles Market Value (US$ Mn), By Material 2017-2022
TABLE 123 France Eco-Friendly Bottles Market Value (US$ Mn), By Application 2012-2016
TABLE 124 France Eco-Friendly Bottles Market Value (US$ Mn), By Application 2017-2022
TABLE 125 Spain Eco-Friendly Bottles Market Value (US$ Mn), By Material 2012-2016
TABLE 126 Spain Eco-Friendly Bottles Market Value (US$ Mn), By Material 2017-2022
TABLE 127 Spain Eco-Friendly Bottles Market Value (US$ Mn), By Application 2012-2016
TABLE 128 Spain Eco-Friendly Bottles Market Value (US$ Mn), By Application 2017-2022
TABLE 129 Italy Eco-Friendly Bottles Market Value (US$ Mn), By Material 2012-2016
TABLE 130 Italy Eco-Friendly Bottles Market Value (US$ Mn), By Material 2017-2022
TABLE 131 Italy Eco-Friendly Bottles Market Value (US$ Mn), By Application 2012-2016
TABLE 132 Italy Eco-Friendly Bottles Market Value (US$ Mn), By Application 2017-2022
TABLE 133 Nordic Eco-Friendly Bottles Market Value (US$ Mn), By Material 2012-2016
TABLE 134 Nordic Eco-Friendly Bottles Market Value (US$ Mn), By Material 2017-2022
TABLE 135 Nordic Eco-Friendly Bottles Market Value (US$ Mn), By Application 2012-2016
TABLE 136 Nordic Eco-Friendly Bottles Market Value (US$ Mn), By Application 2017-2022
TABLE 137 Japan Eco-Friendly Bottles Market Value (US$ Mn), By Material 2012-2016
TABLE 138 Japan Eco-Friendly Bottles Market Value (US$ Mn), By Material 2017-2022
TABLE 139 Japan Eco-Friendly Bottles Market Value (US$ Mn), By Application 2012-2016
TABLE 140 Japan Eco-Friendly Bottles Market Value (US$ Mn), By Application 2017-2022
TABLE 141 China Eco-Friendly Bottles Market Value (US$ Mn), By Material 2012-2016
TABLE 142 China Eco-Friendly Bottles Market Value (US$ Mn), By Material 2017-2022
TABLE 143 China Eco-Friendly Bottles Market Value (US$ Mn), By Application 2012-2016
TABLE 144 China Eco-Friendly Bottles Market Value (US$ Mn), By Application 2017-2022
TABLE 145 India Eco-Friendly Bottles Market Value (US$ Mn), By Material 2012-2016
TABLE 146 India Eco-Friendly Bottles Market Value (US$ Mn), By Material 2017-2022
TABLE 147 India Eco-Friendly Bottles Market Value (US$ Mn), By Application 2012-2016
TABLE 148 India Eco-Friendly Bottles Market Value (US$ Mn), By Application 2017-2022
TABLE 149 Malaysia Eco-Friendly Bottles Market Value (US$ Mn), By Material 2012-2016
TABLE 150 Malaysia Eco-Friendly Bottles Market Value (US$ Mn), By Material 2017-2022
TABLE 151 Malaysia Eco-Friendly Bottles Market Value (US$ Mn), By Application 2012-2016
TABLE 152 Malaysia Eco-Friendly Bottles Market Value (US$ Mn), By Application 2017-2022
TABLE 153 Thailand Eco-Friendly Bottles Market Value (US$ Mn), By Material 2012-2016
TABLE 154 Thailand Eco-Friendly Bottles Market Value (US$ Mn), By Material 2017-2022
TABLE 155 Thailand Eco-Friendly Bottles Market Value (US$ Mn), By Application 2012-2016
TABLE 156 Thailand Eco-Friendly Bottles Market Value (US$ Mn), By Application 2017-2022
TABLE 157 Singapore Eco-Friendly Bottles Market Value (US$ Mn), By Material 2012-2016
TABLE 158 Singapore Eco-Friendly Bottles Market Value (US$ Mn), By Material 2017-2022
TABLE 159 Singapore Eco-Friendly Bottles Market Value (US$ Mn), By Application 2012-2016
TABLE 160 Singapore Eco-Friendly Bottles Market Value (US$ Mn), By Application 2017-2022
TABLE 161 Australia Eco-Friendly Bottles Market Value (US$ Mn), By Material 2012-2016
TABLE 162 Australia Eco-Friendly Bottles Market Value (US$ Mn), By Material 2017-2022
TABLE 163 Australia Eco-Friendly Bottles Market Value (US$ Mn), By Application 2012-2016
TABLE 164 Australia Eco-Friendly Bottles Market Value (US$ Mn), By Application 2017-2022
TABLE 165 GCC Countries Eco-Friendly Bottles Market Value (US$ Mn), By Material 2012-2016
TABLE 166 GCC Countries Eco-Friendly Bottles Market Value (US$ Mn), By Material 2017-2022
TABLE 167 GCC Countries Eco-Friendly Bottles Market Value (US$ Mn), By Application 2012-2016
TABLE 168 GCC Countries Eco-Friendly Bottles Market Value (US$ Mn), By Application 2017-2022
TABLE 169 South Africa Eco-Friendly Bottles Market Value (US$ Mn), By Material 2012-2016
TABLE 170 South Africa Eco-Friendly Bottles Market Value (US$ Mn), By Material 2017-2022
TABLE 171 South Africa Eco-Friendly Bottles Market Value (US$ Mn), By Application 2012-2016
TABLE 172 South Africa Eco-Friendly Bottles Market Value (US$ Mn), By Application 2017-2022
TABLE 173 Nigeria Eco-Friendly Bottles Market Value (US$ Mn), By Material 2012-2016
TABLE 174 Nigeria Eco-Friendly Bottles Market Value (US$ Mn), By Material 2017-2022
TABLE 175 Nigeria Eco-Friendly Bottles Market Value (US$ Mn), By Application 2012-2016
TABLE 176 Nigeria Eco-Friendly Bottles Market Value (US$ Mn), By Application 2017-2022
TABLE 177 Israel Eco-Friendly Bottles Market Value (US$ Mn), By Material 2012-2016
TABLE 178 Israel Eco-Friendly Bottles Market Value (US$ Mn), By Material 2017-2022
TABLE 179 Israel Eco-Friendly Bottles Market Value (US$ Mn), By Application 2012-2016
TABLE 180 Israel Eco-Friendly Bottles Market Value (US$ Mn), By Application 2017-2022
List of Figures
FIG. 1 Global Eco-Friendly Bottles Market Value (US$ Mn), 2012-2016
FIG. 2 Global Eco-Friendly Bottles Market Value (US$ Mn) Forecast, 2017-2022
FIG. 3 Global Eco-Friendly Bottles Market Value (US$ Mn) and Y-o-Y, 2015-2022
FIG. 4 Global Polylactic Acid Segment Market Value (US$ Mn) By Region, 2012-2016
FIG. 5 Global Polylactic Acid Segment Market Value (US$ Mn) By Region, 2017-2022
FIG. 6 Global Polylactic Acid Segment Y-o-Y Growth Rate, By Region, 2015-2022
FIG. 7 Global Starch Segment Market Value (US$ Mn) By Region, 2012-2016
FIG. 8 Global Starch Segment Market Value (US$ Mn) By Region, 2017-2022
FIG. 9 Global Starch Segment Y-o-Y Growth Rate, By Region, 2015-2022
FIG. 10 Global Water Soluble Polymer Segment Market Value (US$ Mn) By Region, 2012-2016
FIG. 11 Global Water Soluble Polymer Segment Market Value (US$ Mn) By Region, 2017-2022
FIG. 12 Global Water Soluble Polymer Segment Y-o-Y Growth Rate, By Region, 2015-2022
FIG. 13 Global Cellulose Segment Market Value (US$ Mn) By Region, 2012-2016
FIG. 14 Global Cellulose Segment Market Value (US$ Mn) By Region, 2017-2022
FIG. 15 Global Cellulose Segment Y-o-Y Growth Rate, By Region, 2015-2022
FIG. 16 Global Aliphatic/aromatic co-polyesters Segment Market Value (US$ Mn) By Region, 2012-2016
FIG. 17 Global Aliphatic/aromatic co-polyesters Segment Market Value (US$ Mn) By Region, 2017-2022
FIG. 18 Global Aliphatic/aromatic co-polyesters Segment Y-o-Y Growth Rate, By Region, 2015-2022
FIG. 19 Global Moulded Fibre Segment Market Value (US$ Mn) By Region, 2012-2016
FIG. 20 Global Moulded Fibre Segment Market Value (US$ Mn) By Region, 2017-2022
FIG. 21 Global Moulded Fibre Segment Y-o-Y Growth Rate, By Region, 2015-2022
FIG. 22 Global Polyhydroxyalkanoates Segment Market Value (US$ Mn) By Region, 2012-2016
FIG. 23 Global Polyhydroxyalkanoates Segment Market Value (US$ Mn) By Region, 2017-2022
FIG. 24 Global Polyhydroxyalkanoates Segment Y-o-Y Growth Rate, By Region, 2015-2022
FIG. 25 Global Bio-derived polyethylene Segment Market Value (US$ Mn) By Region, 2012-2016
FIG. 26 Global Bio-derived polyethylene Segment Market Value (US$ Mn) By Region, 2017-2022
FIG. 27 Global Bio-derived polyethylene Segment Y-o-Y Growth Rate, By Region, 2015-2022
FIG. 28 Global Other Materials Segment Market Value (US$ Mn) By Region, 2012-2016
FIG. 29 Global Other Materials Segment Market Value (US$ Mn) By Region, 2017-2022
FIG. 30 Global Other Materials Segment Y-o-Y Growth Rate, By Region, 2015-2022
FIG. 31 Global Mineral Water Packaging Segment Market Value (US$ Mn) By Region, 2012-2016
FIG. 32 Global Mineral Water Packaging Segment Market Value (US$ Mn) By Region, 2017-2022
FIG. 33 Global Mineral Water Packaging Segment Y-o-Y Growth Rate, By Region, 2015-2022
FIG. 34 Global Non-Alcoholic Beverage Packaging Segment Market Value (US$ Mn) By Region, 2012-2016
FIG. 35 Global Non-Alcoholic Beverage Packaging Segment Market Value (US$ Mn) By Region, 2017-2022
FIG. 36 Global Non-Alcoholic Beverage Packaging Segment Y-o-Y Growth Rate, By Region, 2015-2022
FIG. 37 Global Household Product Segment Market Value (US$ Mn) By Region, 2012-2016
FIG. 38 Global Household Product Segment Market Value (US$ Mn) By Region, 2017-2022
FIG. 39 Global Household Product Segment Y-o-Y Growth Rate, By Region, 2015-2022
FIG. 40 Global Other Applications Segment Market Value (US$ Mn) By Region, 2012-2016
FIG. 41 Global Other Applications Segment Market Value (US$ Mn) By Region, 2017-2022
FIG. 42 Global Other Applications Segment Y-o-Y Growth Rate, By Region, 2015-2022
FIG. 43 North America Eco-Friendly Bottles Market Value (US$ Mn), By Material 2012-2016
FIG. 44 North America Eco-Friendly Bottles Market Value (US$ Mn), By Material 2017-2022
FIG. 45 North America Eco-Friendly Bottles Market Value (US$ Mn), By Application 2012-2016
FIG. 46 North America Eco-Friendly Bottles Market Value (US$ Mn), By Application 2017-2022
FIG. 47 Latin America Eco-Friendly Bottles Market Value (US$ Mn), By Material 2012-2016
FIG. 48 Latin America Eco-Friendly Bottles Market Value (US$ Mn), By Material 2017-2022
FIG. 49 Latin America Eco-Friendly Bottles Market Value (US$ Mn), By Application 2012-2016
FIG. 50 Latin America Eco-Friendly Bottles Market Value (US$ Mn), By Application 2017-2022
FIG. 51 Europe Eco-Friendly Bottles Market Value (US$ Mn), By Material 2012-2016
FIG. 52 Europe Eco-Friendly Bottles Market Value (US$ Mn), By Material 2017-2022
FIG. 53 Europe Eco-Friendly Bottles Market Value (US$ Mn), By Application 2012-2016
FIG. 54 Europe Eco-Friendly Bottles Market Value (US$ Mn), By Application 2017-2022
FIG. 55 Japan Eco-Friendly Bottles Market Value (US$ Mn), By Material 2012-2016
FIG. 56 Japan Eco-Friendly Bottles Market Value (US$ Mn), By Material 2017-2022
FIG. 57 Japan Eco-Friendly Bottles Market Value (US$ Mn), By Application 2012-2016
FIG. 58 Japan Eco-Friendly Bottles Market Value (US$ Mn), By Application 2017-2022
FIG. 59 APEJ Eco-Friendly Bottles Market Value (US$ Mn), By Material 2012-2016
FIG. 60 APEJ Eco-Friendly Bottles Market Value (US$ Mn), By Material 2017-2022
FIG. 61 APEJ Eco-Friendly Bottles Market Value (US$ Mn), By Application 2012-2016
FIG. 62 APEJ Eco-Friendly Bottles Market Value (US$ Mn), By Application 2017-2022
FIG. 63 MEA Eco-Friendly Bottles Market Value (US$ Mn), By Material 2012-2016
FIG. 64 MEA Eco-Friendly Bottles Market Value (US$ Mn), By Material 2017-2022
FIG. 65 MEA Eco-Friendly Bottles Market Value (US$ Mn), By Application 2012-2016
FIG. 66 MEA Eco-Friendly Bottles Market Value (US$ Mn), By Application 2017-2022
Copyright © Transparency Market Research, Inc. All Rights reserved
Trust Online

Eco Friendly Bottles Market