
Reports
Reports
Middle East Edible Oil Co-Products and By-Products Market: Snapshot
The edible oils industry in the Middle East has, over the years, witnessed considerable investment, which has resulted in a significant rise in workforce, number of factories, and total production capacity. The edible oil co-products and by-products market in the Middle East has benefited from these developments and from the growing affluence and rise in population in the region. In terms of value, the market is poised to expand at CAGR of 5.0% from 2016 to 2024. The demand for edible oil co-products and by-products is set to increase from 388,944.3 tonnes in 2015 to 559,775.89 tonnes, registering 4.2% CAGR therein.
Consumers in the Middle East are constantly seeking new tastes, flavors, and applications and companies in the edible oil co-products and by-products market have been devising strategies around this trend to stay competitive.
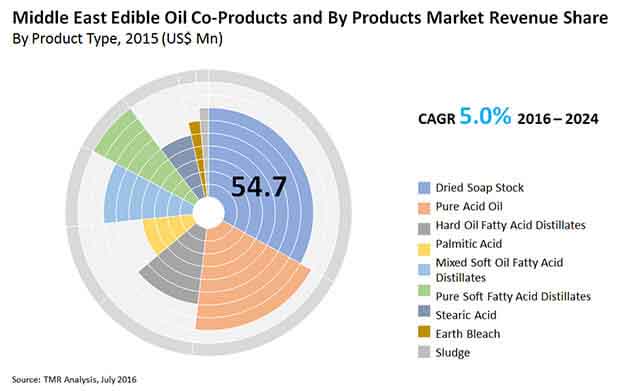
Dried Soap Stock Exhibits Strong Demand and Revenue
By product type, edible oil co-products and by-products are segmented into dried soap stock, hard oil fatty acid distillate, pure soft oil fatty acid distillate, mixed soft oil fatty acid distillate, pure acid oil, palmitic acid, stearic acid, sludge, and earth distillate.
Dried soap stock is projected to be the leading segment in the Middle East market for edible oil co-products and by-products in terms of value as well as volume. The market for dried soap stock in the Kingdom of Saudi Arabia is likely to grow considerably during the forecast period owing to the increasing utilization of this co-product in animal feed. The soap produced from dried soap stock is biodegradable and is widely used as anionic surfactant in powder detergents.
Mixed soft oil fatty acid distillates are anticipated to exhibit a strong CAGR by volume and value during the forecast period of 2016 to 2024.
Steady Demand Projected for Fatty Acid Distillates and Dried Soap Stock in Egypt
Based on country, the Middle East edible oil co-products and by-products market is segmented into the Kingdom of Saudi Arabia, Iran, Egypt, Sudan, Morocco, Algeria, and Turkey.
The oil and soap industry is one of the oldest and most important industries in Egypt. There is a high demand for dried soap stock in the country as it reduces the expense of raw material required for soap manufacturing and provides several economic benefits. Stearic acid acts as an emulsifying and thickening agent when used in cosmetics. With the growing middle-class population in Egypt, the demand for personal care products is rising, which is projected to push the demand for stearic acid in Egypt during the forecast period.
The market for dried soap stock in Saudi Arabia is set to rise over the course of the forecast period owing to the extensive use of this by-product for the production of soap and detergents and as an animal feed ingredient. Iran is a leading producer of soaps and detergents and there is immense potential for the growth of the dried soap stock and pure acid oil markets in the country. Egypt and Morocco are anticipated to witness considerable growth for fatty acid distillates in the Middle East. The demand for hard oil fatty acid is comparatively higher in Turkey than in any other country in the region, driven by the increasing production of soaps and detergents and the rising disposable income in the country.
Some of the prominent players in the Middle East edible oil co-products and by-products market are VVF L.L.C., Cayman Chemical Company, Rade Chemicals, Chemipakhsh Iran Co. Ltd., Mallinath Group, A & B Chemical Corporation, Iran Chemical Provider Co., Genome Specialities Fzc, Oleo Misr, and Arabian Environmental Protection Co. LLC.
Personal Care Industries Spurs Demand in Edible Oil Co-Products and By-Products Market
The production of edible oil renders several bi- and co-products of vast commercial and industrial significance. The Middle East edible oil co-products and by-products market is thus made a steady growth on the back of growing edible oil production in the region. Some of the prominent products attracting the attention of processors and the end-use industries are the fatty acid distillates and dried soap stock. Strides made in oil and soap production in Egypt over the past decades have spurred the prospects of the market. Two of the leading end-use industries witnessing extensive uptake of bi-products and co-products are cosmetics and personal care applications. Rise in demand for cost-efficient raw materials for the production of cosmetics in Egypt and other key economies of the Middle East has fuelled the demand for edible oil co-products and by-products. Advances made in processing and purification technologies reduce the wastage and improve the yield of desired co-products and bi-products. A burgeoning middle-class consumer segments is contributing to the demand for new products, thereby spurring the prospects in the Middle East edible oil co-products and by-products market. Apart from Egypt, personal care industries are extensively utilizing bi-products include Sudan, Algeria, Turkey, and Morocco.
The COVID-19 pandemic and the subsequent outbreaks across the world have been deadly, leading to unprecedented casualties, both in loss of lives and economic growth. The government-imposed lockdowns have been detrimental to the cash flows to factors of production, leading to economic downturns in various sectors. The pandemic still continues with new variants causing havoc in some countries. The Middle East has also witnessed high health morbidity and massive economic burden due to restrictions imposed to reduce the risk of transmission of the virus. Further, oil manufacturer are willing to adopt new production and operational frameworks to maintain their bottomline. All these factors and trends will shape the prospects in the Middle East edible oil co-products and by-products market in the next few years.
Chapter 1 Preface
1.1 Market Segmentation
1.2 Research scope
1.3 Research Methodology
Chapter 2 Global Edible Oil Co-Products and By Products Market : Global Demand
Chapter 3 Middle East Edible Oil Co-Products and By Products Market : By End Use (USD Mn) (Tonnes)
3.1 Key Trend Analysis
3.2 Dried Soap Stock Market : By End Use
3.2.1 Kingdom of Saudi Arabia
3.2.2 Iran
3.2.3 Egypt
3.2.4 Sudan
3.2.5 Morocco
3.2.6 Algeria
3.2.7 Turkey
3.3 Hard Oil FAtty Acid Distillates Market: By End USe
3.3.1 Kingdom of Saudi Arabia
3.3.2 Iran
3.3.3 Egypt
3.3.4 Sudan
3.3.5 Morocco
3.3.6 Algeria
3.3.7 Turkey
3.4 Pure Soft Oil Fatty Acid Distillates Market : By End Use
3.4.1 Kingdom of Saudi Arabia
3.4.2 Iran
3.4.3 Egypt
3.4.4 Sudan
3.4.5 Morocco
3.4.6 Algeria
3.4.7 Turkey
3.5 Mixed Soft Oil Fatty Acid Distillates Market : By End Use
3.5.1 Kingdom of Saudi Arabia
3.5.2 Iran
3.5.3 Egypt
3.5.4 Sudan
3.5.5 Morocco
3.5.6 Algeria
3.5.7 Turkey
3.6 Pure Acid Oil Market : By End Use
3.6.1 Kingdom of Saudi Arabia
3.6.2 Iran
3.6.3 Egypt
3.6.4 Sudan
3.6.5 Morocco
3.6.6 Algeria
3.6.7 Turkey
3.7 Palmitic Acid Oil Market : By End Use
3.7.1 Kingdom of Saudi Arabia
3.7.2 Iran
3.7.3 Egypt
3.7.4 Sudan
3.7.5 Morocco
3.7.6 Algeria
3.7.7 Turkey
3.8 Stearic Acid Oil Market : By End Use
3.8.1 Kingdom of Saudi Arabia
3.8.2 Iran
3.8.3 Egypt
3.8.4 Sudan
3.8.5 Morocco
3.8.6 Algeria
3.8.7 Turkey
3.9 Sludge Market : By End Use
3.9.1 Kingdom of Saudi Arabia
3.9.2 Iran
3.9.3 Egypt
3.9.4 Sudan
3.9.5 Morocco
3.9.6 Algeria
3.9.7 Turkey
3.10 Bleach Earth Market : By End Use
3.10.1 Kingdom of Saudi Arabia
3.10.2 Iran
3.10.3 Egypt
3.10.4 Sudan
3.10.5 Morocco
3.10.6 Algeria
3.10.7 Turkey
3.11 Market Outlook & Recommendations
Chapter 4 Middle East Edible Oil Co-Product and By Products Market: Price Trend Analysis
Chapter 5 Middle East Edible Oil Co-Product and By Products Market: List of Traders / Distributors
Chapter 6 Middle East Edible Oil Co-Product and By Products Market: List of Potential Buyers, By End Use
Chapter 7 Middle East Edible Oil Co-Product and By Products Market: List of Key Competitors
Chapter 8 Middle East Edible Oil Co-Product and By Products Market: Import / Export Analysis
List of Tables
TABLE 1 Global Edible Oil Co-Products and By Products Market Demand: Volume (Tonnes) (2015-2024)
TABLE 2 Edible Oil Co-Products and By Products Market Demand: for Seven Countries, by Volume (Tonnes) (2015-2024)
TABLE 3 Edible Oil Co-Products and By Products Market Demand: for Seven Countries, by Value (USD Million) (2015-2024)
TABLE 4 Middle East Dried Soap Stock Market Revenue (USD Million) (2015-2024)
TABLE 5 Middle East Dried Soap Stock Market Volume (Tonnes) (2015-2024)
TABLE 6 Middle East Hard Oil Fatty Acid Distillate Market Revenue (USD Million) (2015-2024)
TABLE 7 Middle East Hard Oil Fatty Acid Distillates Market Volume (Tonnes) (2015-2024)
TABLE 8 Middle East Pure Soft Oil Fatty Acid Distillate Market Revenue (USD Million) (2015-2024)
TABLE 9 Middle East Pure Soft Oil Fatty Acid Distillates Market Volume (Tonnes) (2015-2024)
TABLE 10 Middle East Mixed Soft Oil Fatty Acid Distillate Market Revenue (USD Million) (2015-2024)
TABLE 11 Middle East Mixed Soft Oil Fatty Acid Distillates Market Volume (Tonnes) (2015-2024)
TABLE 12 Middle East Pure Acid Oil Market Revenue (USD Million) (2015-2024)
TABLE 13 Middle East Pure Acid Oil Market Volume (Tonnes) (2015-2024)
TABLE 14 Middle East Palmitic Acid Market Revenue (USD Million) (2015-2024)
TABLE 15 Middle East Palmitic Acid Market Volume (Tonnes) (2015-2024)
TABLE 16 Middle East Stearic Acid Market Revenue (USD Million) (2015-2024)
TABLE 17 Middle East Stearic Acid Market Volume (Tonnes) (2015-2024)
TABLE 18 Middle East Sludge Market Revenue (USD Million) (2015-2024)
TABLE 19 Middle East Sludge Market Volume (Tonnes) (2015-2024)
TABLE 20 Middle East Bleach Earth Market Revenue (USD Million) (2015-2024)
TABLE 22 Middle East Bleach Earth Market Volume (Tonnes) (2015-2024)
TABLE 23 Middle East Edible Oil Co-Products and By-Products Market Growth Potential
TABLE 24 Middle East Dried Soap Stock Price and Forecast (USD/Tonnes)
TABLE 25 Middle East Hard Oil Fatty Acid Distillates Price and Forecast (USD/Tonnes)
TABLE 26 Middle East Dried Pure Soft Oil Fatty Acid Distillates Price and Forecast (USD/Tonnes)
TABLE 27 Middle East Mixed Soft Oil Fatty Acid Distillates Price and Forecast (USD/Tonnes)
TABLE 28 Middle East Pure Acid Oil Price and Forecast (USD/Tonnes)
TABLE 29 Middle East Palmitic Acid Price and Forecast (USD/Tonnes)
TABLE 30 Middle East Stearic Acid Price and Forecast (USD/Tonnes)
TABLE 31 Middle East Sludge Price and Forecast (USD/Tonnes)
TABLE 32 Middle East Bleach Earth Price and Forecast (USD/Tonnes)
TABLE 33 Middle East Edible Oil Co-Products and By-Products Market: List of Traders and Distributors of Tocopherol
TABLE 34 Middle East Edible Oil Co-Products and By-Products Market: List of Potential Buyers by end-use
TABLE 35 Middle East Edible Oil Co-Products and By-Products Market: List of Key Competitors
TABLE 36 Saudi Arabia Edible Oil Co-Products and By-Products Market: Export Analysis, by Product types
TABLE 37 Egypt Edible Oil Co-Products and By-Products Market: Export Analysis, by Product types
TABLE 38 Morocco Edible Oil Co-Products and By-Products Market: Export Analysis, by Product types
TABLE 39 Algeria Edible Oil Co-Products and By-Products Market: Export Analysis, by Product types
TABLE 40 Turkey Edible Oil Co-Products and By-Products Market: Export Analysis, by Product types
TABLE 41 Sudan Edible Oil Co-Products and By-Products Market: Export Analysis, by Product types
List of Figures
FIG. 1 Middle East Edible Oil Co-Products and By Products Market Segmentation-
FIG. 2 Global Edible Oil Co-Products and By Products Market, : Global Demand
FIG. 3 KSA Dried Soap Stock Market, by Animal Feed, 2015 - 2024: Revenue and Volume Forecast
FIG. 4 KSA Dried Soap Stock Market, By Soaps and Detergents, 2015 - 2024, (USD Million and Tonnes)
FIG. 6 Iran Dried Soap Stock Market, By Animal Feed, 2015 - 2024, (USD Million and Tonnes)
FIG. 7 Iran Dried Soap Stock Market, By Soaps and Detergents, 2015 - 2024, (USD Million and Tonnes)
FIG. 8 Egypt Dried Soap Stock Market, By Animal Feed, 2015 - 2024, (USD Million and Tonnes
FIG. 9 Egypt Dried Soap Stock Market, By Soaps and Detergents, 2015 - 2024, (USD Million and Tonnes)
FIG. 10 Sudan Dried Soap Stock Market, By Animal Feed, 2015 - 2024, (USD Million and Tonnes
FIG. 11 Sudan Dried Soap Stock Market, By Soaps and Detergents, 2015 - 2024, (USD Million and Tonnes)
FIG. 12 Morocco Dried Soap Stock Market, By Animal Feed, 2015 - 2024, (USD Million and Tonnes)
FIG. 13 Morocco Dried Soap Stock Market, By Soaps and Detergents, 2015 - 2024, (USD Million and Tonnes)
FIG. 14 Algeria Dried Soap Stock Market, By Animal Feed, 2015 - 2024, (USD Million and Tonnes
FIG. 15 Algeria Dried Soap Stock Market, By Soaps and Detergents, 2015 - 2024, (USD Million and Tonnes
FIG. 16 Turkey Dried Soap Stock Market, By Animal Feed, 2015 - 2024, (USD Million and Tonnes)
FIG. 17 Turkey Dried Soap Stock Market, By Soaps and Detergents, 2015 - 2024, (USD Million and Tonnes)
FIG. 18 KSA Hard Oil Fatty Acid Distillates Market, By Soaps and Detergents, 2015 - 2024, (USD Million and Tonnes)
FIG. 19 KSA Hard Oil Fatty Acid Distillates Market, For Animal Feed Application, 2015 - 2024, (USD Million and Tonnes)
FIG. 20 KSA Hard Oil Fatty Acid Distillates Market, For Other Applications, 2015 - 2024, (USD Million and Tonnes
FIG. 21 Iran Hard Oil Fatty Acid Distillates Market, By Soaps and Detergents, 2015 - 2024, (USD Million and Tonnes))
FIG. 22 Iran Hard Oil Fatty Acid Distillates Market, For Animal Feed Application, 2015 - 2024, (USD Million and Tonnes)
FIG. 23 Iran Hard Oil Fatty Acid Distillates Market, For Other Applications, 2015 - 2024, (USD Million and Tonnes)
FIG. 24 Egypt Hard Oil Fatty Acid Distillates Market, By Soaps and Detergents, 2015 - 2024, (USD Million and Tonnes)
FIG. 25 Egypt Hard Oil Fatty Acid Distillates Market, For Animal Feed Application, 2015 - 2024, (USD Million and Tonnes
FIG. 26 Egypt Hard Oil Fatty Acid Distillates Market, For Other Applications, 2015 - 2024, (USD Million and Tonnes)
FIG. 27 Sudan Hard Oil Fatty Acid Distillates Market, By Soaps and Detergents, 2015 - 2024, (USD Million and Tonnes)
FIG. 28 Sudan Hard Oil Fatty Acid Distillates Market, For Animal Feed Application, 2015 - 2024, (USD Million and Tonnes)
FIG. 29 Sudan Hard Oil Fatty Acid Distillates Market, For Other Applications, 2015 - 2024, (USD Million and Tonnes)
FIG. 30 Morocco Hard Oil Fatty Acid Distillates Market, By Soaps and Detergents, 2015 - 2024, (USD Million and Tonnes)
FIG. 31 Morocco Hard Oil Fatty Acid Distillates Market, For Animal Feed Application, 2015 - 2024, (USD Million and Tonnes
FIG. 32 Morocco Hard Oil Fatty Acid Distillates Market, For Other Applications, 2015 - 2024, (USD Million and Tonnes))
FIG. 33 Algeria Hard Oil Fatty Acid Distillates Market, By Soaps and Detergents, 2015 - 2024, (USD Million and Tonnes
FIG. 34 Algeria Hard Oil Fatty Acid Distillates Market, For Animal Feed Application, 2015 - 2024, (USD Million and Tonnes)
FIG. 35 Algeria Hard Oil Fatty Acid Distillates Market, For Other Applications, 2015 - 2024, (USD Million and Tonnes)
FIG. 36 Turkey Hard Oil Fatty Acid Distillates Market, By Soaps and Detergents, 2015 - 2024, (USD Million and Tonnes)
FIG. 37 Turkey Hard Oil Fatty Acid Distillates Market, For Animal Feed Application, 2015 - 2024, (USD Million and Tonnes)
FIG. 38 Turkey Hard Oil Fatty Acid Distillates Market, For Other Applications, 2015 - 2024, (USD Million and Tonnes)
FIG. 39 KSA Pure soft oil fatty acid distillates Market, By Soaps and Detergents, 2015 - 2024, (USD Million and Tonnes))
FIG. 40 KSA Pure soft oil fatty acid distillates Market, For Tocopherol Application, 2015 - 2024, (USD Million and Tonnes)
FIG. 41 Iran pure soft oil fatty acid distillates Market, By Soaps and Detergents, 2015 - 2024, (USD Million and Tonnes)
FIG. 42 Iran pure soft oil fatty acid distillates Market, For Tocopherol Application, 2015 - 2024, (USD Million and Tonnes)
FIG. 43 Iran pure soft oil fatty acid distillates Market, For Other Applications, 2015 - 2024, (USD Million and Tonnes
FIG. 44 Egypt pure soft oil fatty acid distillates Market, By Soaps and Detergents, 2015 - 2024, (USD Million and Tonnes)
FIG. 45 Egypt pure soft oil fatty acid distillates Market, For Tocopherol Application, 2015 - 2024, (USD Million and Tonnes)
FIG. 46 Egypt pure soft oil fatty acid distillates Market, For Other Applications, 2015 - 2024, (USD Million and Tonnes)
FIG. 47 Sudan pure soft oil fatty acid distillates Market, By Soaps and Detergents, 2015 - 2024, (USD Million and Tonnes)
FIG. 48 Sudan pure soft oil fatty acid distillates Market, For Tocopherol Application, 2015 - 2024, (USD Million and Tonnes)
FIG. 49 Sudan pure soft oil fatty acid distillates Market, For Other Applications, 2015 - 2024, (USD Million and Tonnes)
FIG. 50 Morocco pure soft oil fatty acid distillates Market, By Soaps and Detergents, 2015 - 2024, (USD Million and Tonnes)
FIG. 51 Morocco pure soft oil fatty acid distillates Market, For Tocopherol Application, 2015 - 2024, (USD Million and Tonnes)
FIG. 52 Morocco pure soft oil fatty acid distillates Market, For Other Applications, 2015 - 2024, (USD Million and Tonnes)
FIG. 53 Algeria pure soft oil fatty acid distillates Market, For Tocopherol Application, 2015 - 2024, (USD Million and Tonnes)
FIG. 54 Algeria pure soft oil fatty acid distillates Market, For Other Applications, 2015 - 2024, (USD Million and Tonnes)
FIG. 55 Turkey pure soft oil fatty acid distillates Market, By Soaps and Detergents, 2015 - 2024, (USD Million and Tonnes)
FIG. 56 Turkey pure soft oil fatty acid distillates Market, For Tocopherol Application, 2015 - 2024, (USD Million and Tonnes)
FIG. 57 Turkey pure soft oil fatty acid distillates Market, For Other Applications, 2015 - 2024, (USD Million and Tonnes)
FIG. 58 KSA mixed soft oil fatty acid distillates Market, for Soaps and Detergents, 2015 - 2024, (USD Million and Tonnes)
FIG. 59 KSA mixed soft oil fatty acid distillates Market, for Tocopherol, 2015 - 2024, (USD Million and Tonnes)
FIG. 60 KSA mixed soft oil fatty acid distillates Market, for Other application, 2015 - 2024, (USD Million and Tonnes)
FIG. 61 Iran mixed soft oil fatty acid distillates Market, for Soaps and Detergents, 2015 - 2024, (USD Million and Tonnes)
FIG. 62 Iran mixed soft oil fatty acid distillates Market, for Tocopherol, 2015 - 2024, (USD Million and Tonnes)
FIG. 63 Iran mixed soft oil fatty acid distillates Market, for Other application, 2015 - 2024, (USD Million and Tonnes)
FIG. 64 Egypt mixed soft oil fatty acid distillates Market, for Soaps and Detergents, 2015 - 2024, (USD Million and Tonnes)
FIG. 65 Egypt mixed soft oil fatty acid distillates Market, for Tocopherol, 2015 - 2024, (USD Million and Tonnes)
FIG. 66 Egypt mixed soft oil fatty acid distillates Market, for Other application, 2015 - 2024, (USD Million and Tonnes)
FIG. 67 Sudan mixed soft oil fatty acid distillates Market, for Soaps and Detergents, 2015 - 2024, (USD Million and Tonnes)
FIG. 68 Sudan mixed soft oil fatty acid distillates Market, for Tocopherol, 2015 - 2024, (USD Million and Tonnes)
FIG. 69 Sudan mixed soft oil fatty acid distillates Market, for Other application, 2015 - 2024, (USD Million and Tonnes)
FIG. 70 Morocco mixed soft oil fatty acid distillates Market, for Soaps and Detergents, 2015 - 2024, (USD Million and Tonnes)
FIG. 71 Morocco mixed soft oil fatty acid distillates Market, for Tocopherol, 2015 - 2024, (USD Million and Tonnes)
FIG. 72 Morocco mixed soft oil fatty acid distillates Market, for Other application, 2015 - 2024, (USD Million and Tonnes)
FIG. 73 Algeria mixed soft oil fatty acid distillates Market, for Soaps and Detergents, 2015 - 2024, (USD Million and Tonnes)
FIG. 74 Algeria mixed soft oil fatty acid distillates Market, for Tocopherol, 2015 - 2024, (USD Million and Tonnes)
FIG. 75 Algeria mixed soft oil fatty acid distillates Market, for Other application, 2015 - 2024, (USD Million and Tonnes)
FIG. 76 Turkey mixed soft oil fatty acid distillates Market, for Soaps and Detergents, 2015 - 2024, (USD Million and Tonnes)
FIG. 77 Turkey mixed soft oil fatty acid distillates Market, for Tocopherol, 2015 - 2024, (USD Million and Tonnes)
FIG. 78 Turkey mixed soft oil fatty acid distillates Market, for Other application, 2015 - 2024, (USD Million and Tonnes)
FIG. 79 KSA pure acid oil Market, for Animal feed, 2015 - 2024, (USD Million and Tonnes)
FIG. 80 KSA pure acid oil Market, for Soaps and Detergents, 2015 - 2024, (USD Million and Tonnes)
FIG. 81 KSA pure soft oil Market, for Other application, 2015 - 2024, (USD Million and Tonnes)
FIG. 82 Iran pure acid oil Market, for Animal feed, 2015 - 2024, (USD Million and Tonnes)
FIG. 83 Iran pure acid oil Market, for Soaps and Detergents, 2015 - 2024, (USD Million and Tonnes)
FIG. 84 Iran pure soft oil Market, for Other application, 2015 - 2024, (USD Million and Tonnes)
FIG. 85 Egypt pure acid oil Market, for Animal feed, 2015 - 2024, (USD Million and Tonnes)
FIG. 86 Egypt pure acid oil Market, for Soaps and Detergents, 2015 - 2024, (USD Million and Tonnes)
FIG. 87 Egypt pure soft oil Market, for Other application, 2015 - 2024, (USD Million and Tonnes)
FIG. 88 Sudan pure acid oil Market, for Animal feed, 2015 - 2024, (USD Million and Tonnes)
FIG. 89 Sudan pure acid oil Market, for Soaps and Detergents, 2015 - 2024, (USD Million and Tonnes)
FIG. 90 Sudan pure soft oil Market, for Other application, 2015 - 2024, (USD Million and Tonnes)
FIG. 91 Morocco pure acid oil Market, for Animal feed, 2015 - 2024, (USD Million and Tonnes)
FIG. 92 Morocco pure acid oil Market, for Soaps and Detergents, 2015 - 2024, (USD Million and Tonnes)
FIG. 93 Morocco pure soft oil Market, for Other application, 2015 - 2024, (USD Million and Tonnes)
FIG. 94 Algeria pure acid oil Market, for Animal feed, 2015 - 2024, (USD Million and Tonnes)
FIG. 95 Algeria pure acid oil Market, for Soaps and Detergents, 2015 - 2024, (USD Million and Tonnes)
FIG. 96 Algeria pure soft oil Market, for Other application, 2015 - 2024, (USD Million and Tonnes)
FIG. 97 Turkey pure acid oil Market, for Animal feed, 2015 - 2024, (USD Million and Tonnes)
FIG. 98 Turkey pure acid oil Market, for Soaps and Detergents, 2015 - 2024, (USD Million and Tonnes)
FIG. 99 Turkey pure soft oil Market, for Other application, 2015 - 2024, (USD Million and Tonnes)
FIG. 100 KSA Palmitic acid Market, for Soaps and detergent, 2015 - 2024, (USD Million and Tonnes)
FIG. 101 KSA Palmitic acid Market, for Other application, 2015 - 2024, (USD Million and Tonnes)
FIG. 102 Iran Palmitic acid Market, for Soaps and detergent, 2015 - 2024, (USD Million and Tonnes)
FIG. 103 Iran Palmitic acid Market, for Other application, 2015 - 2024, (USD Million and Tonnes)
FIG. 104 Egypt Palmitic acid Market, for Soaps and detergent, 2015 - 2024, (USD Million and Tonnes)
FIG. 105 Egypt Palmitic acid Market, for Other application, 2015 - 2024, (USD Million and Tonnes)
FIG. 106 Sudan Palmitic acid Market, for Soaps and detergent, 2015 - 2024, (USD Million and Tonnes)
FIG. 107 Sudan Palmitic acid Market, for Other application, 2015 - 2024, (USD Million and Tonnes)
FIG. 108 Morocco Palmitic acid Market, for Soaps and detergent, 2015 - 2024, (USD Million and Tonnes)
FIG. 109 Morocco Palmitic acid Market, for Other application, 2015 - 2024, (USD Million and Tonnes)
FIG. 110 Algeria Palmitic acid Market, for Soaps and detergent, 2015 - 2024, (USD Million and Tonnes)
FIG. 111 Algeria Palmitic acid Market, for Other application, 2015 - 2024, (USD Million and Tonnes)
FIG. 112 Turkey Palmitic acid Market, for Soaps and detergent, 2015 - 2024, (USD Million and Tonnes)
FIG. 113 Turkey Palmitic acid Market, for Other application, 2015 - 2024, (USD Million and Tonnes)
FIG. 114 KSA Stearic acid Market, for Soaps and Detergent application, 2015 - 2024, (USD Million and Tonnes)
FIG. 115 KSA Stearic acid Market, for Other application, 2015 - 2024, (USD Million and Tonnes)
FIG. 116 Iran Stearic acid Market, for Soaps and detergent, 2015 - 2024, (USD Million and Tonnes)
FIG. 117 Iran Stearic acid Market, for Other application, 2015 - 2024, (USD Million and Tonnes)
FIG. 118 Egypt Stearic acid Market, for Soaps and detergent, 2015 - 2024, (USD Million and Tonnes)
FIG. 119 Egypt Stearic acid Market, for Other application, 2015 - 2024, (USD Million and Tonnes)
FIG. 120 Sudan Stearic acid Market, for Soaps and detergent, 2015 - 2024, (USD Million and Tonnes)
FIG. 121 Sudan Stearic acid Market, for Other application, 2015 - 2024, (USD Million and Tonnes)
FIG. 122 Morocco Stearic acid Market, for Soaps and detergent, 2015 - 2024, (USD Million and Tonnes)
FIG. 123 Morocco Stearic acid Market, for Other application, 2015 - 2024, (USD Million and Tonnes)
FIG. 124 Algeria Stearic acid Market, for Soaps and detergent, 2015 - 2024, (USD Million and Tonnes)
FIG. 125 Algeria Stearic acid Market, for Other application, 2015 - 2024, (USD Million and Tonnes)
FIG. 126 Turkey Stearic acid Market, for Soaps and detergent, 2015 - 2024, (USD Million and Tonnes)
FIG. 127 Turkey Stearic acid Market, for Other application, 2015 - 2024, (USD Million and Tonnes)
FIG. 128 KSA Sludge Market, for Animal feed application, 2015 - 2024, (USD Million and Tonnes)
FIG. 129 KSA Sludge Market, for Other application, 2015 - 2024, (USD Million and Tonnes)
FIG. 130 Iran Sludge Market, for Animal feed, 2015 - 2024, (USD Million and Tonnes)
FIG. 131 Iran Sludge Market, for Other application, 2015 - 2024, (USD Million and Tonnes)
FIG. 132 Egypt Sludge Market, for Animal feed, 2015 - 2024, (USD Million and Tonnes)
FIG. 133 Egypt Sludge Market, for Other application, 2015 - 2024, (USD Million and Tonnes)
FIG. 134 Sudan Sludge Market, for Animal feed, 2015 - 2024, (USD Million and Tonnes)
FIG. 135 Sudan Sludge Market, for Other application, 2015 - 2024, (USD Million and Tonnes)
FIG. 136 Morocco Sludge Market, for Animal feed, 2015 - 2024, (USD Million and Tonnes)
FIG. 137 Morocco Sludge Market, for Other application, 2015 - 2024, (USD Million and Tonnes)
FIG. 138 Algeria Sludge Market, for Animal feed, 2015 - 2024, (USD Million and Tonnes)
FIG. 139 Algeria Sludge Market, for Other application, 2015 - 2024, (USD Million and Tonnes)
FIG. 140 Turkey Sludge Market, for Animal feed, 2015 - 2024, (USD Million and Tonnes)
FIG. 141 Turkey Sludge Market, for Other application, 2015 - 2024, (USD Million and Tonnes)
FIG. 142 KSA Bleach Earth Market, for Animal feed, 2015 - 2024, (USD Million and Tonnes)
FIG. 143 KSA Bleach Earth Market, for Other application, 2015 - 2024, (USD Million and Tonnes)
FIG. 144 Iran Bleach Earth Market, for Animal feed, 2015 - 2024, (USD Million and Tonnes)
FIG. 145 Iran Bleach Earth Market, for Other application, 2015 - 2024, (USD Million and Tonnes)
FIG. 146 Egypt Bleach Earth Market, for Animal feed, 2015 - 2024, (USD Million and Tonnes)
FIG. 147 Egypt Bleach Earth Market, for Other application, 2015 - 2024, (USD Million and Tonnes)
FIG. 148 Sudan Bleach Earth Market, for Animal feed, 2015 - 2024, (USD Million and Tonnes)
FIG. 149 Sudan Bleach Earth Market, for Other application, 2015 - 2024, (USD Million and Tonnes)
FIG. 150 Morocco Bleach Earth Market, for Animal feed, 2015 - 2024, (USD Million and Tonnes)
FIG. 151 Morocco Bleach Earth Market, for Other application, 2015 - 2024, (USD Million and Tonnes)
FIG. 152 Algeria Bleach Earth Market, for Animal feed, 2015 - 2024, (USD Million and Tonnes)
FIG. 153 Algeria Bleach Earth Market, for Other application, 2015 - 2024, (USD Million and Tonnes)
FIG. 154 Turkey Bleach Earth Market, for Animal feed, 2015 - 2024, (USD Million and Tonnes)
FIG. 155 Turkey Bleach Earth Market, for Other application, 2015 - 2024, (USD Million and Tonnes)
Copyright © Transparency Market Research, Inc. All Rights reserved
Trust Online

Edible Oil Co-Products and By-Products Market