
Reports
Reports
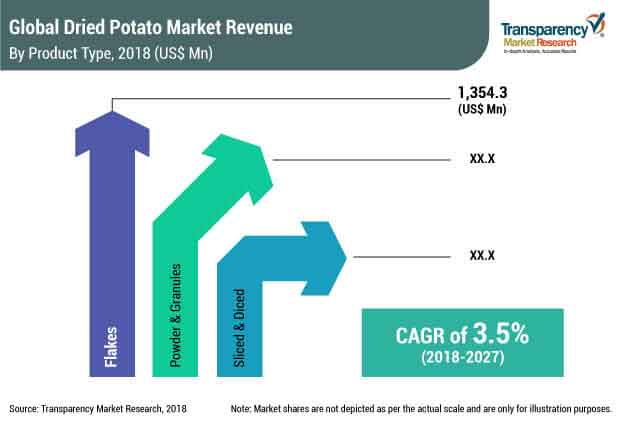
Potato is an essential crop which is widely used in the food processing industry and the retail sector in various food products and cuisines. Dried potatoes is a result of the removal of water from the crop. The potatoes is dried using several drying methods including air drying, drum drying, spray drying, freeze drying, and vacuum drying. Drying and water removal helps in extending the shelf life of the potatoes and increases its usability while maintaining the texture and taste of the potatoes. In terms of value, the global dried potatoes market is expected to reach a market value of US$ 3368.4 Mn by the end of 2027, with an anticipated CAGR of 3.5% over the forecast period. The global dried potatoes market is expected to reach volume production of 9,675,519 MT in 2027.
Growth in Demand for Convenience Food Drives the Market for Dried Potatoes
Busy lifestyle and hectic schedule are making consumers seek convenient food products which are easy to use, ready to eat, fast in cooking and convenient for extended storage. There are a number of vegetables which are dried and used to provide consumers easy and ready to eat food choices. The potatoes are a popular dried vegetable which can be dried by various advanced drying techniques thus enabling it to fulfill the criteria for convenient food products. The convenient food products quest is flourishing due to the increased value of time and increased disposable income which is leading to the growth of dried potatoes market.
Rapidly Increasing Food Processing Industry
Robust growth in the food processing industry is also fueling the demand for dried potatoes owing to its multiple uses in the processed foods. Dried potatoes has made consumers enjoy flavorful and tasty food, which devour less time for preparation. The increasing demand for processed foods like snacks, functional flour, meat products, and others has led to in rising demand for dried potatoes.
Increasing Consumption of Processed Potatoes
Rapidly changing potatoes consumption pattern among the population is gaining the attention of manufacturers to bring dried potatoes in their product portfolio. According to FAO data, less than 50% of potatoes are consumed fresh, and rest is processed to value-added products and dried potatoes. Increasing attractiveness of processed potatoes among the consumers due to its broad application in various dishes and culinary, owing to its binding and thickening ability in food products is boosting the market of dried potatoes.
Longer Shelf Life of Dried Potatoes
Dried ingredients and food like dried potatoes are witnessing an upsurge in demand owing to a number of technologies which are being used in their production. Techniques such as air drying, drum drying, spray drying, freeze drying, and vacuum drying have affected the potentials of using dried potatoes for a longer time. Dried potatoes extended shelf life, which helps consumers and B2B industries like food service providers and food processors to use dried potatoes for an extended period of time. Due to an escalation in shelf life, the use and applications of dried potatoes have attained broader prospects and usability.
Increasing Snack Industry
The fast-paced lifestyle has given rise to new eating habits of consumers that are different from the conventional three square meals eaten at the family table. Consumers are turning towards round-the-clock snacking whenever hunger strikes. Consumers are increasingly getting inclined towards easy to cook, and convenient snacks which are full of flavors and taste. The dried potatoes are a popular snacking option for a large population, and thus with increasing consumers snacking trend, the demand for dried potatoes is witnessing an upsurge.
Robust Supply Chain for Dried Potatoes
The supply chain of dried potatoes is already established with decent transportation facilities that help in the smooth flow of product. Existing supply models have benefitted dried potatoes to reach customers directly without any hurdles. Most dried potatoes are supplied in packages, which is effective in storage and transportation. Besides, online sales of dried potatoes through e-commerce websites have added much grip to the market and helped it flourish in a new way with a better sales medium. Traditional methods are also being used for sales of dried potatoes, but through e-commerce websites, any company/person sitting in any part of the world can buy dried potatoes from suppliers.
Rising Demand for Gluten-free Dried Food Offerings
Consumers are opting for gluten-free diets, owing to several health concerns. The push towards living a healthy lifestyle and indulging in healthier food options is pushing manufacturers to process foods with gluten-free dried foods. Thus, Gluten-free and rich in starch, dried potatoes flour is used by the food processing industry. The dried potatoes flour is used as a binding and a thickening agent in meat mixtures and gravies, sauces, and soups. The gluten-free nature of dried potatoes fulfills the consumers demand gluten-free food and ingredient.
1. Global Dried Potato Market - Executive Summary
2. Global Dried Potato Market Overview
2.1. Introduction
2.1.1. Global Dried Potato Market Taxonomy
2.1.2. Global Dried Potato Market Definition
2.2. Global Dried Potato Market Size (US$ Mn & Volume) and Forecast, 2013-2027
2.2.1. Global Dried Potato Market Y-o-Y Growth
2.3. Global Dried Potato Market Dynamics
2.4. Supply Chain
2.5. Cost Structure
2.6. Pricing Analysis
2.7. Raw Material Sourcing Strategy and Analysis
2.8. Service Provider List
2.9. Key Participants Market Presence (Intensity Map) By Region
3. Global Dried Potato Market Analysis and Forecast 2013-2027
3.1. Global Dried Potato Market Size and Forecast By Nature, 2013-2027
3.1.1. Organic Market Size and Forecast, 2013-2027
3.1.1.1. Revenue (US$ Mn) & Volume Comparison, By Region
3.1.1.2. Market Share Comparison, By Region
3.1.1.3. Y-o-Y growth Comparison, By Region
3.1.2. Conventional Market Size and Forecast, 2013-2027
3.1.2.1. Revenue (US$ Mn) & Volume Comparison, By Region
3.1.2.2. Market Share Comparison, By Region
3.1.2.3. Y-o-Y growth Comparison, By Region
3.2. Global Dried Potato Market Size and Forecast By Form, 2013-2027
3.2.1. Flakes Market Size and Forecast, 2013-2027
3.2.1.1. Revenue (US$ Mn) & Volume Comparison, By Region
3.2.1.2. Market Share Comparison, By Region
3.2.1.3. Y-o-Y growth Comparison, By Region
3.2.2. Sliced & Diced Market Size and Forecast, 2013-2027
3.2.2.1. Revenue (US$ Mn) & Volume Comparison, By Region
3.2.2.2. Market Share Comparison, By Region
3.2.2.3. Y-o-Y growth Comparison, By Region
3.2.3. Powder and granules Market Size and Forecast, 2013-2027
3.2.3.1. Revenue (US$ Mn) & Volume Comparison, By Region
3.2.3.2. Market Share Comparison, By Region
3.2.3.3. Y-o-Y growth Comparison, By Region
3.3. Global Dried Potato Market Size and Forecast By Drying Techniques, 2013-2027
3.3.1. Air Drying Market Size and Forecast, 2013-2027
3.3.1.1. Revenue (US$ Mn) & Volume Comparison, By Region
3.3.1.2. Market Share Comparison, By Region
3.3.1.3. Y-o-Y growth Comparison, By Region
3.3.2. Spray Drying Market Size and Forecast, 2013-2027
3.3.2.1. Revenue (US$ Mn) & Volume Comparison, By Region
3.3.2.2. Market Share Comparison, By Region
3.3.2.3. Y-o-Y growth Comparison, By Region
3.3.3. Freeze Drying Market Size and Forecast, 2013-2027
3.3.3.1. Revenue (US$ Mn) & Volume Comparison, By Region
3.3.3.2. Market Share Comparison, By Region
3.3.3.3. Y-o-Y growth Comparison, By Region
3.3.4. Drum Drying Market Size and Forecast, 2013-2027
3.3.4.1. Revenue (US$ Mn) & Volume Comparison, By Region
3.3.4.2. Market Share Comparison, By Region
3.3.4.3. Y-o-Y growth Comparison, By Region
3.3.5. Vacuum Drying Market Size and Forecast, 2013-2027
3.3.5.1. Revenue (US$ Mn) & Volume Comparison, By Region
3.3.5.2. Market Share Comparison, By Region
3.3.5.3. Y-o-Y growth Comparison, By Region
3.4. Global Dried Potato Market Size and Forecast By End Use, 2013-2027
3.4.1. Food Processing Market Size and Forecast, 2013-2027
3.4.1.1. Revenue (US$ Mn) & Volume Comparison, By Region
3.4.1.2. Market Share Comparison, By Region
3.4.1.3. Y-o-Y growth Comparison, By Region
3.4.2. Bakery Market Size and Forecast, 2013-2027
3.4.2.1. Revenue (US$ Mn) & Volume Comparison, By Region
3.4.2.2. Market Share Comparison, By Region
3.4.2.3. Y-o-Y growth Comparison, By Region
3.4.3. Snacks & Savory Market Size and Forecast, 2013-2027
3.4.3.1. Revenue (US$ Mn) & Volume Comparison, By Region
3.4.3.2. Market Share Comparison, By Region
3.4.3.3. Y-o-Y growth Comparison, By Region
3.4.4. Soups & Salad Market Size and Forecast, 2013-2027
3.4.4.1. Revenue (US$ Mn) & Volume Comparison, By Region
3.4.4.2. Market Share Comparison, By Region
3.4.4.3. Y-o-Y growth Comparison, By Region
3.4.5. Food Service Providers Market Size and Forecast, 2013-2027
3.4.5.1. Revenue (US$ Mn) & Volume Comparison, By Region
3.4.5.2. Market Share Comparison, By Region
3.4.5.3. Y-o-Y growth Comparison, By Region
3.4.6. Retail Market Size and Forecast, 2013-2027
3.4.6.1. Revenue (US$ Mn) & Volume Comparison, By Region
3.4.6.2. Market Share Comparison, By Region
3.4.6.3. Y-o-Y growth Comparison, By Region
4. North America Dried Potato Market Size and Forecast, 2013-2027
4.1. Revenue (US$ Mn) & Volume Comparison, By Country
4.2. Revenue (US$ Mn) & Volume Comparison, By Nature
4.3. Revenue (US$ Mn) & Volume Comparison, By Form
4.4. Revenue (US$ Mn) & Volume Comparison, By Drying Techniques
4.5. Revenue (US$ Mn) & Volume Comparison, By End Use
5. Latin America Dried Potato Market Size and Forecast, 2013-2027
5.1. Revenue (US$ Mn) & Volume Comparison, By Country
5.2. Revenue (US$ Mn) & Volume Comparison, By Nature
5.3. Revenue (US$ Mn) & Volume Comparison, By Form
5.4. Revenue (US$ Mn) & Volume Comparison, By Drying Techniques
5.5. Revenue (US$ Mn) & Volume Comparison, By End Use
6. Europe Dried Potato Market Size and Forecast, 2013-2027
6.1. Revenue (US$ Mn) & Volume Comparison, By Country
6.2. Revenue (US$ Mn) & Volume Comparison, By Nature
6.3. Revenue (US$ Mn) & Volume Comparison, By Form
6.4. Revenue (US$ Mn) & Volume Comparison, By Drying Techniques
6.5. Revenue (US$ Mn) & Volume Comparison, By End Use
7. APAC Dried Potato Market Size and Forecast, 2013-2027
7.1. Revenue (US$ Mn) & Volume Comparison, By Country
7.2. Revenue (US$ Mn) & Volume Comparison, By Nature
7.3. Revenue (US$ Mn) & Volume Comparison, By Form
7.4. Revenue (US$ Mn) & Volume Comparison, By Drying Techniques
7.5. Revenue (US$ Mn) & Volume Comparison, By End Use
8. MEA Dried Potato Market Size and Forecast, 2013-2027
8.1. Revenue (US$ Mn) & Volume Comparison, By Country
8.2. Revenue (US$ Mn) & Volume Comparison, By Nature
8.3. Revenue (US$ Mn) & Volume Comparison, By Form
8.4. Revenue (US$ Mn) & Volume Comparison, By Drying Techniques
8.5. Revenue (US$ Mn) & Volume Comparison, By End Use
9. Dried Potato Market Size and Forecast, 2013-2027
9.1. Revenue (US$ Mn) & Volume Comparison, By Country
9.2. Revenue (US$ Mn) & Volume Comparison, By Nature
9.3. Revenue (US$ Mn) & Volume Comparison, By Form
9.4. Revenue (US$ Mn) & Volume Comparison, By Drying Techniques
9.5. Revenue (US$ Mn) & Volume Comparison, By End Use
9. Global Dried Potato Market Company Share, Competition Landscape and Company Profiles
9.1. Company Share Analysis
9.2. Competition Landscape
9.3. Company Profiles
10. Research Methodology
11. Secondary and Primary Sources
12. Assumptions and Acronyms
13. Disclaimer
List of Tables
TABLE 1 Global Dried Potato Market Value (US$ Mn) & Volume, 2013-2018
TABLE 2 Global Dried Potato Market Value (US$ Mn) & Volume, 2019-2027
TABLE 3 Global Dried Potato Market Value (US$ Mn) & Volume and Y-o-Y, 2018-2027
TABLE 4 Global Organic Segment Value (US$ Mn) & Volume, By Region 2013-2018
TABLE 5 Global Organic Segment Value (US$ Mn) & Volume, By Region 2019-2027
TABLE 6 Global Organic Segment Market Share, By Region 2013-2018
TABLE 7 Global Organic Segment Market Share, By Region 2019-2027
TABLE 8 Global Organic Segment Y-o-Y, By Region 2018-2027
TABLE 9 Global Conventional Segment Value (US$ Mn) & Volume, By Region 2013-2018
TABLE 10 Global Conventional Segment Value (US$ Mn) & Volume, By Region 2019-2027
TABLE 11 Global Conventional Segment Market Share, By Region 2013-2018
TABLE 12 Global Conventional Segment Market Share, By Region 2019-2027
TABLE 13 Global Conventional Segment Y-o-Y, By Region 2018-2027
TABLE 14 Global Flakes Segment Value (US$ Mn) & Volume, By Region 2013-2018
TABLE 15 Global Flakes Segment Value (US$ Mn) & Volume, By Region 2019-2027
TABLE 16 Global Flakes Segment Market Share, By Region 2013-2018
TABLE 17 Global Flakes Segment Market Share, By Region 2019-2027
TABLE 18 Global Flakes Segment Y-o-Y, By Region 2018-2027
TABLE 19 Global Sliced & Diced Segment Value (US$ Mn) & Volume, By Region 2013-2018
TABLE 20 Global Sliced & Diced Segment Value (US$ Mn) & Volume, By Region 2019-2027
TABLE 21 Global Sliced & Diced Segment Market Share, By Region 2013-2018
TABLE 22 Global Sliced & Diced Segment Market Share, By Region 2019-2027
TABLE 23 Global Sliced & Diced Segment Y-o-Y, By Region 2018-2027
TABLE 24 Global Powder and granules Segment Value (US$ Mn) & Volume, By Region 2013-2018
TABLE 25 Global Powder and granules Segment Value (US$ Mn) & Volume, By Region 2019-2027
TABLE 26 Global Powder and granules Segment Market Share, By Region 2013-2018
TABLE 27 Global Powder and granules Segment Market Share, By Region 2019-2027
TABLE 28 Global Powder and granules Segment Y-o-Y, By Region 2018-2027
TABLE 29 Global Air Drying Segment Value (US$ Mn) & Volume, By Region 2013-2018
TABLE 30 Global Air Drying Segment Value (US$ Mn) & Volume, By Region 2019-2027
TABLE 31 Global Air Drying Segment Market Share, By Region 2013-2018
TABLE 32 Global Air Drying Segment Market Share, By Region 2019-2027
TABLE 33 Global Air Drying Segment Y-o-Y, By Region 2018-2027
TABLE 34 Global Spray Drying Segment Value (US$ Mn) & Volume, By Region 2013-2018
TABLE 35 Global Spray Drying Segment Value (US$ Mn) & Volume, By Region 2019-2027
TABLE 36 Global Spray Drying Segment Market Share, By Region 2013-2018
TABLE 37 Global Spray Drying Segment Market Share, By Region 2019-2027
TABLE 38 Global Spray Drying Segment Y-o-Y, By Region 2018-2027
TABLE 39 Global Freeze Drying Segment Value (US$ Mn) & Volume, By Region 2013-2018
TABLE 40 Global Freeze Drying Segment Value (US$ Mn) & Volume, By Region 2019-2027
TABLE 41 Global Freeze Drying Segment Market Share, By Region 2013-2018
TABLE 42 Global Freeze Drying Segment Market Share, By Region 2019-2027
TABLE 43 Global Freeze Drying Segment Y-o-Y, By Region 2018-2027
TABLE 44 Global Drum Drying Segment Value (US$ Mn) & Volume, By Region 2013-2018
TABLE 45 Global Drum Drying Segment Value (US$ Mn) & Volume, By Region 2019-2027
TABLE 46 Global Drum Drying Segment Market Share, By Region 2013-2018
TABLE 47 Global Drum Drying Segment Market Share, By Region 2019-2027
TABLE 48 Global Drum Drying Segment Y-o-Y, By Region 2018-2027
TABLE 49 Global Vacuum Drying Segment Value (US$ Mn) & Volume, By Region 2013-2018
TABLE 50 Global Vacuum Drying Segment Value (US$ Mn) & Volume, By Region 2019-2027
TABLE 51 Global Vacuum Drying Segment Market Share, By Region 2013-2018
TABLE 52 Global Vacuum Drying Segment Market Share, By Region 2019-2027
TABLE 53 Global Vacuum Drying Segment Y-o-Y, By Region 2018-2027
TABLE 54 Global Food Processing Segment Value (US$ Mn) & Volume, By Region 2013-2018
TABLE 55 Global Food Processing Segment Value (US$ Mn) & Volume, By Region 2019-2027
TABLE 56 Global Food Processing Segment Market Share, By Region 2013-2018
TABLE 57 Global Food Processing Segment Market Share, By Region 2019-2027
TABLE 58 Global Food Processing Segment Y-o-Y, By Region 2018-2027
TABLE 59 Global Bakery Segment Value (US$ Mn) & Volume, By Region 2013-2018
TABLE 60 Global Bakery Segment Value (US$ Mn) & Volume, By Region 2019-2027
TABLE 61 Global Bakery Segment Market Share, By Region 2013-2018
TABLE 62 Global Bakery Segment Market Share, By Region 2019-2027
TABLE 63 Global Bakery Segment Y-o-Y, By Region 2018-2027
TABLE 64 Global Snacks & Savory Segment Value (US$ Mn) & Volume, By Region 2013-2018
TABLE 65 Global Snacks & Savory Segment Value (US$ Mn) & Volume, By Region 2019-2027
TABLE 66 Global Snacks & Savory Segment Market Share, By Region 2013-2018
TABLE 67 Global Snacks & Savory Segment Market Share, By Region 2019-2027
TABLE 68 Global Snacks & Savory Segment Y-o-Y, By Region 2018-2027
TABLE 69 Global Soups & Salad Segment Value (US$ Mn) & Volume, By Region 2013-2018
TABLE 70 Global Soups & Salad Segment Value (US$ Mn) & Volume, By Region 2019-2027
TABLE 71 Global Soups & Salad Segment Market Share, By Region 2013-2018
TABLE 72 Global Soups & Salad Segment Market Share, By Region 2019-2027
TABLE 73 Global Soups & Salad Segment Y-o-Y, By Region 2018-2027
TABLE 74 Global Food Service Providers Segment Value (US$ Mn) & Volume, By Region 2013-2018
TABLE 75 Global Food Service Providers Segment Value (US$ Mn) & Volume, By Region 2019-2027
TABLE 76 Global Food Service Providers Segment Market Share, By Region 2013-2018
TABLE 77 Global Food Service Providers Segment Market Share, By Region 2019-2027
TABLE 78 Global Food Service Providers Segment Y-o-Y, By Region 2018-2027
TABLE 79 Global Retail Segment Value (US$ Mn) & Volume, By Region 2013-2018
TABLE 80 Global Retail Segment Value (US$ Mn) & Volume, By Region 2019-2027
TABLE 81 Global Retail Segment Market Share, By Region 2013-2018
TABLE 82 Global Retail Segment Market Share, By Region 2019-2027
TABLE 83 Global Retail Segment Y-o-Y, By Region 2018-2027
TABLE 84 North America Dried Potato Market Value (US$ Mn) & Volume, By Country 2013-2018
TABLE 85 North America Dried Potato Market Value (US$ Mn) & Volume, By Country 2019-2027
TABLE 86 North America Dried Potato Market Value (US$ Mn) & Volume, By Nature 2013-2018
TABLE 87 North America Dried Potato Market Value (US$ Mn) & Volume, By Nature 2019-2027
TABLE 88 North America Dried Potato Market Value (US$ Mn) & Volume, By Form 2013-2018
TABLE 89 North America Dried Potato Market Value (US$ Mn) & Volume, By Form 2019-2027
TABLE 90 North America Dried Potato Market Value (US$ Mn) & Volume, By Drying Techniques 2013-2018
TABLE 91 North America Dried Potato Market Value (US$ Mn) & Volume, By Drying Techniques 2019-2027
TABLE 92 North America Dried Potato Market Value (US$ Mn) & Volume, By End Use 2013-2018
TABLE 93 North America Dried Potato Market Value (US$ Mn) & Volume, By End Use 2019-2027
TABLE 94 Latin America Dried Potato Market Value (US$ Mn) & Volume, By Country 2013-2018
TABLE 95 Latin America Dried Potato Market Value (US$ Mn) & Volume, By Country 2019-2027
TABLE 96 Latin America Dried Potato Market Value (US$ Mn) & Volume, By Nature 2013-2018
TABLE 97 Latin America Dried Potato Market Value (US$ Mn) & Volume, By Nature 2019-2027
TABLE 98 Latin America Dried Potato Market Value (US$ Mn) & Volume, By Form 2013-2018
TABLE 99 Latin America Dried Potato Market Value (US$ Mn) & Volume, By Form 2019-2027
TABLE 100 Latin America Dried Potato Market Value (US$ Mn) & Volume, By Drying Techniques 2013-2018
TABLE 101 Latin America Dried Potato Market Value (US$ Mn) & Volume, By Drying Techniques 2019-2027
TABLE 102 Latin America Dried Potato Market Value (US$ Mn) & Volume, By End Use 2013-2018
TABLE 103 Latin America Dried Potato Market Value (US$ Mn) & Volume, By End Use 2019-2027
TABLE 104 Europe Dried Potato Market Value (US$ Mn) & Volume, By Country 2013-2018
TABLE 105 Europe Dried Potato Market Value (US$ Mn) & Volume, By Country 2019-2027
TABLE 106 Europe Dried Potato Market Value (US$ Mn) & Volume, By Nature 2013-2018
TABLE 107 Europe Dried Potato Market Value (US$ Mn) & Volume, By Nature 2019-2027
TABLE 108 Europe Dried Potato Market Value (US$ Mn) & Volume, By Form 2013-2018
TABLE 109 Europe Dried Potato Market Value (US$ Mn) & Volume, By Form 2019-2027
TABLE 110 Europe Dried Potato Market Value (US$ Mn) & Volume, By Drying Techniques 2013-2018
TABLE 111 Europe Dried Potato Market Value (US$ Mn) & Volume, By Drying Techniques 2019-2027
TABLE 112 Europe Dried Potato Market Value (US$ Mn) & Volume, By End Use 2013-2018
TABLE 113 Europe Dried Potato Market Value (US$ Mn) & Volume, By End Use 2019-2027
TABLE 114 APAC Dried Potato Market Value (US$ Mn) & Volume, By Country 2013-2018
TABLE 115 APAC Dried Potato Market Value (US$ Mn) & Volume, By Country 2019-2027
TABLE 116 APAC Dried Potato Market Value (US$ Mn) & Volume, By Nature 2013-2018
TABLE 117 APAC Dried Potato Market Value (US$ Mn) & Volume, By Nature 2019-2027
TABLE 118 APAC Dried Potato Market Value (US$ Mn) & Volume, By Form 2013-2018
TABLE 119 APAC Dried Potato Market Value (US$ Mn) & Volume, By Form 2019-2027
TABLE 120 APAC Dried Potato Market Value (US$ Mn) & Volume, By Drying Techniques 2013-2018
TABLE 121 APAC Dried Potato Market Value (US$ Mn) & Volume, By Drying Techniques 2019-2027
TABLE 122 APAC Dried Potato Market Value (US$ Mn) & Volume, By End Use 2013-2018
TABLE 123 APAC Dried Potato Market Value (US$ Mn) & Volume, By End Use 2019-2027
TABLE 124 MEA Dried Potato Market Value (US$ Mn) & Volume, By Country 2013-2018
TABLE 125 MEA Dried Potato Market Value (US$ Mn) & Volume, By Country 2019-2027
TABLE 126 MEA Dried Potato Market Value (US$ Mn) & Volume, By Nature 2013-2018
TABLE 127 MEA Dried Potato Market Value (US$ Mn) & Volume, By Nature 2019-2027
TABLE 128 MEA Dried Potato Market Value (US$ Mn) & Volume, By Form 2013-2018
TABLE 129 MEA Dried Potato Market Value (US$ Mn) & Volume, By Form 2019-2027
TABLE 130 MEA Dried Potato Market Value (US$ Mn) & Volume, By Drying Techniques 2013-2018
TABLE 131 MEA Dried Potato Market Value (US$ Mn) & Volume, By Drying Techniques 2019-2027
TABLE 132 MEA Dried Potato Market Value (US$ Mn) & Volume, By End Use 2013-2018
TABLE 133 MEA Dried Potato Market Value (US$ Mn) & Volume, By End Use 2019-2027
List of Figures
FIG. 1 Global Dried Potato Market Value (US$ Mn), 2013-2018
FIG. 2 Global Dried Potato Market Value (US$ Mn) Forecast, 2019-2027
FIG. 3 Global Dried Potato Market Value (US$ Mn) and Y-o-Y, 2018-2027
FIG. 4 Global Organic Segment Market Value (US$ Mn) By Region, 2013-2018
FIG. 5 Global Organic Segment Market Value (US$ Mn) By Region, 2019-2027
FIG. 6 Global Organic Segment Y-o-Y Growth Rate, By Region, 2018-2027
FIG. 7 Global Conventional Segment Market Value (US$ Mn) By Region, 2013-2018
FIG. 8 Global Conventional Segment Market Value (US$ Mn) By Region, 2019-2027
FIG. 9 Global Conventional Segment Y-o-Y Growth Rate, By Region, 2018-2027
FIG. 10 Global Flakes Segment Market Value (US$ Mn) By Region, 2013-2018
FIG. 11 Global Flakes Segment Market Value (US$ Mn) By Region, 2019-2027
FIG. 12 Global Flakes Segment Y-o-Y Growth Rate, By Region, 2018-2027
FIG. 13 Global Sliced & Diced Segment Market Value (US$ Mn) By Region, 2013-2018
FIG. 14 Global Sliced & Diced Segment Market Value (US$ Mn) By Region, 2019-2027
FIG. 15 Global Sliced & Diced Segment Y-o-Y Growth Rate, By Region, 2018-2027
FIG. 16 Global Powder and granules Segment Market Value (US$ Mn) By Region, 2013-2018
FIG. 17 Global Powder and granules Segment Market Value (US$ Mn) By Region, 2019-2027
FIG. 18 Global Powder and granules Segment Y-o-Y Growth Rate, By Region, 2018-2027
FIG. 19 Global Air Drying Segment Market Value (US$ Mn) By Region, 2013-2018
FIG. 20 Global Air Drying Segment Market Value (US$ Mn) By Region, 2019-2027
FIG. 21 Global Air Drying Segment Y-o-Y Growth Rate, By Region, 2018-2027
FIG. 22 Global Spray Drying Segment Market Value (US$ Mn) By Region, 2013-2018
FIG. 23 Global Spray Drying Segment Market Value (US$ Mn) By Region, 2019-2027
FIG. 24 Global Spray Drying Segment Y-o-Y Growth Rate, By Region, 2018-2027
FIG. 25 Global Freeze Drying Segment Market Value (US$ Mn) By Region, 2013-2018
FIG. 26 Global Freeze Drying Segment Market Value (US$ Mn) By Region, 2019-2027
FIG. 27 Global Freeze Drying Segment Y-o-Y Growth Rate, By Region, 2018-2027
FIG. 28 Global Drum Drying Segment Market Value (US$ Mn) By Region, 2013-2018
FIG. 29 Global Drum Drying Segment Market Value (US$ Mn) By Region, 2019-2027
FIG. 30 Global Drum Drying Segment Y-o-Y Growth Rate, By Region, 2018-2027
FIG. 31 Global Vacuum Drying Segment Market Value (US$ Mn) By Region, 2013-2018
FIG. 32 Global Vacuum Drying Segment Market Value (US$ Mn) By Region, 2019-2027
FIG. 33 Global Vacuum Drying Segment Y-o-Y Growth Rate, By Region, 2018-2027
FIG. 34 Global Food Processing Segment Market Value (US$ Mn) By Region, 2013-2018
FIG. 35 Global Food Processing Segment Market Value (US$ Mn) By Region, 2019-2027
FIG. 36 Global Food Processing Segment Y-o-Y Growth Rate, By Region, 2018-2027
FIG. 37 Global Bakery Segment Market Value (US$ Mn) By Region, 2013-2018
FIG. 38 Global Bakery Segment Market Value (US$ Mn) By Region, 2019-2027
FIG. 39 Global Bakery Segment Y-o-Y Growth Rate, By Region, 2018-2027
FIG. 40 Global Snacks & Savory Segment Market Value (US$ Mn) By Region, 2013-2018
FIG. 41 Global Snacks & Savory Segment Market Value (US$ Mn) By Region, 2019-2027
FIG. 42 Global Snacks & Savory Segment Y-o-Y Growth Rate, By Region, 2018-2027
FIG. 43 Global Soups & Salad Segment Market Value (US$ Mn) By Region, 2013-2018
FIG. 44 Global Soups & Salad Segment Market Value (US$ Mn) By Region, 2019-2027
FIG. 45 Global Soups & Salad Segment Y-o-Y Growth Rate, By Region, 2018-2027
FIG. 46 Global Food Service Providers Segment Market Value (US$ Mn) By Region, 2013-2018
FIG. 47 Global Food Service Providers Segment Market Value (US$ Mn) By Region, 2019-2027
FIG. 48 Global Food Service Providers Segment Y-o-Y Growth Rate, By Region, 2018-2027
FIG. 49 Global Retail Segment Market Value (US$ Mn) By Region, 2013-2018
FIG. 50 Global Retail Segment Market Value (US$ Mn) By Region, 2019-2027
FIG. 51 Global Retail Segment Y-o-Y Growth Rate, By Region, 2018-2027
FIG. 52 North America Dried Potato Market Value (US$ Mn), By Country 2013-2018
FIG. 53 North America Dried Potato Market Value (US$ Mn), By Country 2019-2027
FIG. 54 North America Dried Potato Market Value (US$ Mn), By Nature 2013-2018
FIG. 55 North America Dried Potato Market Value (US$ Mn), By Nature 2019-2027
FIG. 56 North America Dried Potato Market Value (US$ Mn), By Form 2013-2018
FIG. 57 North America Dried Potato Market Value (US$ Mn), By Form 2019-2027
FIG. 58 North America Dried Potato Market Value (US$ Mn), By Drying Techniques 2013-2018
FIG. 59 North America Dried Potato Market Value (US$ Mn), By Drying Techniques 2019-2027
FIG. 60 North America Dried Potato Market Value (US$ Mn), By End Use 2013-2018
FIG. 61 North America Dried Potato Market Value (US$ Mn), By End Use 2019-2027
FIG. 62 Latin America Dried Potato Market Value (US$ Mn), By Country 2013-2018
FIG. 63 Latin America Dried Potato Market Value (US$ Mn), By Country 2019-2027
FIG. 64 Latin America Dried Potato Market Value (US$ Mn), By Nature 2013-2018
FIG. 65 Latin America Dried Potato Market Value (US$ Mn), By Nature 2019-2027
FIG. 66 Latin America Dried Potato Market Value (US$ Mn), By Form 2013-2018
FIG. 67 Latin America Dried Potato Market Value (US$ Mn), By Form 2019-2027
FIG. 68 Latin America Dried Potato Market Value (US$ Mn), By Drying Techniques 2013-2018
FIG. 69 Latin America Dried Potato Market Value (US$ Mn), By Drying Techniques 2019-2027
FIG. 70 Latin America Dried Potato Market Value (US$ Mn), By End Use 2013-2018
FIG. 71 Latin America Dried Potato Market Value (US$ Mn), By End Use 2019-2027
FIG. 72 Europe Dried Potato Market Value (US$ Mn), By Country 2013-2018
FIG. 73 Europe Dried Potato Market Value (US$ Mn), By Country 2019-2027
FIG. 74 Europe Dried Potato Market Value (US$ Mn), By Nature 2013-2018
FIG. 75 Europe Dried Potato Market Value (US$ Mn), By Nature 2019-2027
FIG. 76 Europe Dried Potato Market Value (US$ Mn), By Form 2013-2018
FIG. 77 Europe Dried Potato Market Value (US$ Mn), By Form 2019-2027
FIG. 78 Europe Dried Potato Market Value (US$ Mn), By Drying Techniques 2013-2018
FIG. 79 Europe Dried Potato Market Value (US$ Mn), By Drying Techniques 2019-2027
FIG. 80 Europe Dried Potato Market Value (US$ Mn), By End Use 2013-2018
FIG. 81 Europe Dried Potato Market Value (US$ Mn), By End Use 2019-2027
FIG. 82 APAC Dried Potato Market Value (US$ Mn), By Country 2013-2018
FIG. 83 APAC Dried Potato Market Value (US$ Mn), By Country 2019-2027
FIG. 84 APAC Dried Potato Market Value (US$ Mn), By Nature 2013-2018
FIG. 85 APAC Dried Potato Market Value (US$ Mn), By Nature 2019-2027
FIG. 86 APAC Dried Potato Market Value (US$ Mn), By Drying Techniques 2013-2018
FIG. 87 APAC Dried Potato Market Value (US$ Mn), By Form 2019-2027
FIG. 88 APAC Dried Potato Market Value (US$ Mn), By Drying Techniques 2013-2018
FIG. 89 APAC Dried Potato Market Value (US$ Mn), By Drying Techniques 2019-2027
FIG. 90 APAC Dried Potato Market Value (US$ Mn), By End Use 2013-2018
FIG. 91 APAC Dried Potato Market Value (US$ Mn), By End Use 2019-2027
FIG. 92 MEA Dried Potato Market Value (US$ Mn), By Country 2013-2018
FIG. 93 MEA Dried Potato Market Value (US$ Mn), By Country 2019-2027
FIG. 94 MEA Dried Potato Market Value (US$ Mn), By Nature 2013-2018
FIG. 95 MEA Dried Potato Market Value (US$ Mn), By Nature 2019-2027
FIG. 96 MEA Dried Potato Market Value (US$ Mn), By Form 2013-2018
FIG. 97 MEA Dried Potato Market Value (US$ Mn), By Form 2019-2027
FIG. 98 MEA Dried Potato Market Value (US$ Mn), By Drying Techniques 2013-2018
FIG. 99 MEA Dried Potato Market Value (US$ Mn), By Drying Techniques 2019-2027
FIG. 100 MEA Dried Potato Market Value (US$ Mn), By End Use 2013-2018
FIG. 101 MEA Dried Potato Market Value (US$ Mn), By End Use 2019-2027
Copyright © Transparency Market Research, Inc. All Rights reserved
Trust Online

Dried Potatoes Market