
Reports
Reports
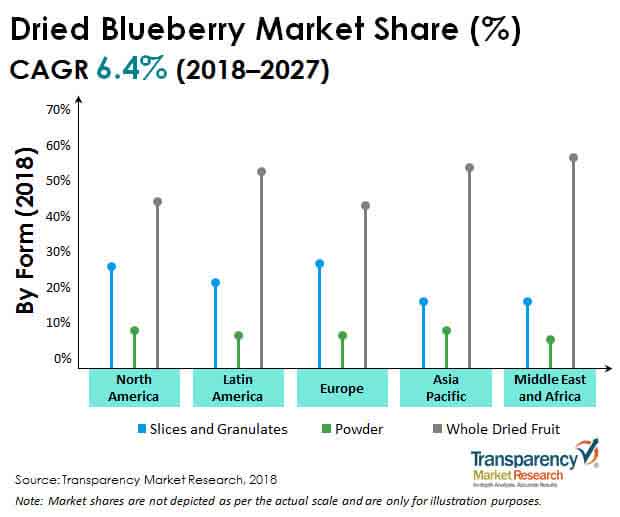
‘Dried’ Blueberries – The Lesser Known Form of Superfruit
In line with an accelerated mass shift of consumers to healthier and ‘better-for-you’ dietary practices, the 'superfruit' category has been witnessing momentous traction over the past decade. The powerhouse of antioxidants, this category of fruits accounts for an important portion of balanced diet, which remains the key factor shaping their innovations and applicability in routine dietary regime.
Traditionally preferred fresh or frozen, blueberries in dried form have been recently observing noteworthy growth in demand from the health-conscious consumer cluster. Though initially having captured interests of the food industry as well as consumers by their rich fiber and antioxidant profile, dried blueberries are proven to have a significant role in regulation of blood sugar levels of type 2 diabetic patients. The low-carb low-glycemic index profile of dried blueberries makes them an ideal snack for those who are recommended to improve their average blood glucose levels.
While the rich content of vitamin C accounts for dried blueberries' potential to accelerate collagen buildup, their vitamin K content has been cited to play a key role in blood clotting and the overall maintenance of bone health. Moreover, low-sodium, low-calorie, high-anthocyanin, and zero-cholesterol attributes account for
increasing inclusion of dried blueberries in diet recommendations for hypertension and cardiovascular disease (CVD) patients.
Transparency Market Research (TMR) has tracked the influential trends in dried blueberries market. A new TMR report presents an exhaustive, 360-degree analysis of dried blueberries market to help industry enthusiasts gain a profound understanding of the key forces at play in this landscape.
Global sales of dried blueberries accounted for revenues roughly worth US$ 380 Mn, a majority of which according to TMR’s research is contributed by the food and beverages, and cosmetics and personal care industries. While fresh or frozen blueberries reflect an equally enriched nutritional profile, dried blueberries are witnessing increasing preference owing to the higher shelf life and clean labeling. These superior attributes of dried blueberries are being prudently leveraged by end-use segments. As food and beverages, and cosmetics and personal care products manufacturers continue to face the pressing need for incorporation of natural, organic, high shelf life, and clean label ingredients in their offerings, it is highly likely that demand for products like dried blueberries will see optimistic growth prospects in coming years. The global dried blueberries market is envisaged to grow over 1.5X between 2019 and 2027, as per TMR’s projection.
‘Beauty from Within’ Products Point to an Influx of Opportunities
Rapid advancements in dehydration technology have ushered several innovations in the food industry, particularly in the food processing sector. The popularity of dried blueberries is escalating recently, for a multitude of product innovations. In addition to bakery products, such as cakes and cookies, dried blueberries find wide applicability in a variety of stuffings. Although consumers continue to seek economically attractive products, high-end products like dried blueberries are rapidly permeating retail shelves, in form of a diverse range of intermediate and low-moisture snack products.
New product launches including dried blueberries as one of the key ingredients have been seeing healthy growth in global market. With an increasing number of food products manufacturers and processors harnessing nutritional profile of dried blueberries as a superfood ingredient in the formulation of flavored drinks, fruit cups, desserts, energy drinks, and baked goods. Improving application prospects of dried blueberries in beauty from within products targeting hair and skincare, such as nutricosmetics, are creating new trend wave in the dried blueberries market. In addition, processors of dried blueberries and other stakeholders have been capitalizing on opportunities in natural and organic cosmetics formulated for topical application.
Dried Blueberries Sales to Surge as the Real Food Movement Firms up
The widening expanse of real food movement is cited as the most relevant trend driving manufacturers in the food and beverages industry to rely on naturally sourced, unprocessed dried fruits, such as dried blueberries. Consumers are shifting to authentic foods that are closer to nature, carry cleaner labels, and contain ingredients with deepest real food roots, which has been translating into increased utilization of dried blueberries and other similar products within bakery markets. Frozen dried blueberries have recently become the mainstay for baking businesses to deliver a range of innovative products to cater to evolving market demands. Smoothies have emerged as another popular category, creating diverse opportunities for stakeholders in the dried blueberries market. Today, dried blueberries are infiltrating baked goods and parfaits, keeping an eye on a myriad profitable opportunities arising in non-traditional segments, such as cocktails and meat glazes.
Convenience Making Extra Cost of Dried Blueberries Worthwhile
A brisk consumer shift to natural and organic ingredients used in F&B products clearly points to an unofficial end of conventionally used synthetic or artificially derived flavors and colors. This trend has been significantly favoring sales of dried blueberries and other similar products. Additionally, the high convenience quotient and nutrient dense profile are advocating the expensive price point worthwhile, thereby attracting consumers’ buying interests. Growing recognition of high-value superfoods by manufacturers is further cementing the position of dried blueberries amidst a wide range of categories represented by the retail sector. According to recent findings, dried blueberries are also benefiting from the thriving trend of nutritional snack bars that intersects with multiple popular trends, such as vegan, vegetarian, Paleo, gluten-free, high-protein, natural and organic.
E-Commerce & Cross Marketing Strategies Take the Limelight in Dried Blueberries Market
Retailers are picking cross-marketing and leveraging e-commerce platform to unlock sales in the fiercely competitive market for dried blueberries. This falls in line with the uphill battle that manufacturers have been facing, while they focus on expanding dried blueberries based product penetration and increasing consumer reach. They are capitalizing on the growing popularity of dried blueberries by cross-merchandising them with a range of other items, such as muffin mixes, pie shells, shortcake, glazes, yogurt, cereal, and pancake mix. For instance, several retails are placing baked snack bars near bananas, which are among the best-selling items in produce. Retailers are clamoring to get their dried blueberries containing bars near popular section, as a part of their other strategic cross-marketing techniques that communicate a relationship to consumers.
Leading market players are unceasingly and gradually deploying electronic technologies across the supply chain of dried blueberries and associated products, as operational efficiency becomes paramount. They are modifying business models to maintain non-contaminated product processing and thereby, strengthen consumer confidence in them.
Dried Blueberries Market Competition Analysis
The dried blueberries market can be characterized as a fairly consolidated competition landscape, with the established players contributing for more than 55% share of total revenues. Industry goliaths are substantially emphasizing product innovation along with focus on sales via online and direct distribution channels to strengthen their market presence globally. Leading players are likely to maintain heavy investments in branding and promotion strategies to engage audience and influence their buying decisions.
Creative packaging formats for products based on dried blueberries that prominently focus on clean labels, such as organic, non-GMO, non-allergen, and low-sugar, remain among the key focus areas of market players. However, small scale companies operating in dried blueberries market continue to face challenges despite low-cost production budget constraints, to raise their revenue shares. New launches and stronger distribution networks are expected to augur well for companies looking forward to consolidate their position in the dried blueberries market.
The Analyst’s Speak
The dried blueberries market is currently growing as a stable business landscape for stakeholders as well as investors. The volatile production of dried blueberries, and the consequent high pricing will keep companies on toes and hard-pressed to offer cost-effective variants. Increasing focus of players on leveraging packaging formats as an effective tool to communicate the health benefits and nutritional profile of dried blueberries to consumers will improve the revenue generation potential in coming years.
1. Global Dried Blueberries Market - Executive Summary
2. Global Dried Blueberries Market Overview
2.1. Introduction
2.1.1. Global Dried Blueberries Market Taxonomy
2.1.2. Global Dried Blueberries Market Definition
2.2. Global Dried Blueberries Market Size (US$ Mn & Volume) and Forecast, 2013-2027
2.2.1. Global Dried Blueberries Market Y-o-Y Growth
2.3. Global Dried Blueberries Market Dynamics
2.4. Supply Chain
2.5. Cost Structure
2.6. Pricing Analysis
2.7. Raw Material Sourcing Strategy and Analysis
2.8. Service Provider List
2.9. Key Participants Market Presence (Intensity Map) By Region
3. Global Dried Blueberries Market Analysis and Forecast 2013-2027
3.1. Global Dried Blueberries Market Size and Forecast By Nature, 2013-2027
3.1.1. Organic Market Size and Forecast, 2013-2027
3.1.1.1. Revenue (US$ Mn) & Volume Comparison, By Region
3.1.1.2. Market Share Comparison, By Region
3.1.1.3. Y-o-Y growth Comparison, By Region
3.1.2. Conventional Market Size and Forecast, 2013-2027
3.1.2.1. Revenue (US$ Mn) & Volume Comparison, By Region
3.1.2.2. Market Share Comparison, By Region
3.1.2.3. Y-o-Y growth Comparison, By Region
3.2. Global Dried Blueberries Market Size and Forecast By Form, 2013-2027
3.2.1. Slices and Granulates Market Size and Forecast, 2013-2027
3.2.1.1. Revenue (US$ Mn) & Volume Comparison, By Region
3.2.1.2. Market Share Comparison, By Region
3.2.1.3. Y-o-Y growth Comparison, By Region
3.2.2. Powder Market Size and Forecast, 2013-2027
3.2.2.1. Revenue (US$ Mn) & Volume Comparison, By Region
3.2.2.2. Market Share Comparison, By Region
3.2.2.3. Y-o-Y growth Comparison, By Region
3.2.3. Whole Dried Fruit Market Size and Forecast, 2013-2027
3.2.3.1. Revenue (US$ Mn) & Volume Comparison, By Region
3.2.3.2. Market Share Comparison, By Region
3.2.3.3. Y-o-Y growth Comparison, By Region
3.3. Global Dried Blueberries Market Size and Forecast By End Users, 2013-2027
3.3.1. Bakery Products Market Size and Forecast, 2013-2027
3.3.1.1. Revenue (US$ Mn) & Volume Comparison, By Region
3.3.1.2. Market Share Comparison, By Region
3.3.1.3. Y-o-Y growth Comparison, By Region
3.3.2. Confectioneries Market Size and Forecast, 2013-2027
3.3.2.1. Revenue (US$ Mn) & Volume Comparison, By Region
3.3.2.2. Market Share Comparison, By Region
3.3.2.3. Y-o-Y growth Comparison, By Region
3.3.3. Beverages Market Size and Forecast, 2013-2027
3.3.3.1. Revenue (US$ Mn) & Volume Comparison, By Region
3.3.3.2. Market Share Comparison, By Region
3.3.3.3. Y-o-Y growth Comparison, By Region
3.3.4. Dairy Products Market Size and Forecast, 2013-2027
3.3.4.1. Revenue (US$ Mn) & Volume Comparison, By Region
3.3.4.2. Market Share Comparison, By Region
3.3.4.3. Y-o-Y growth Comparison, By Region
3.3.5. Cereal and Snack Bars Market Size and Forecast, 2013-2027
3.3.5.1. Revenue (US$ Mn) & Volume Comparison, By Region
3.3.5.2. Market Share Comparison, By Region
3.3.5.3. Y-o-Y growth Comparison, By Region
3.3.6. Cosmetics and Personal Care Market Size and Forecast, 2013-2027
3.3.6.1. Revenue (US$ Mn) & Volume Comparison, By Region
3.3.6.2. Market Share Comparison, By Region
3.3.6.3. Y-o-Y growth Comparison, By Region
3.3.7. Dietary Supplements Market Size and Forecast, 2013-2027
3.3.7.1. Revenue (US$ Mn) & Volume Comparison, By Region
3.3.7.2. Market Share Comparison, By Region
3.3.7.3. Y-o-Y growth Comparison, By Region
3.3.8. Food Service Providers Market Size and Forecast, 2013-2027
3.3.8.1. Revenue (US$ Mn) & Volume Comparison, By Region
3.3.8.2. Market Share Comparison, By Region
3.3.8.3. Y-o-Y growth Comparison, By Region
3.3.9. Retails Market Size and Forecast, 2013-2027
3.3.9.1. Revenue (US$ Mn) & Volume Comparison, By Region
3.3.9.2. Market Share Comparison, By Region
3.3.9.3. Y-o-Y growth Comparison, By Region
3.3.10. Others Market Size and Forecast, 2013-2027
3.3.10.1. Revenue (US$ Mn) & Volume Comparison, By Region
3.3.10.2. Market Share Comparison, By Region
3.3.10.3. Y-o-Y growth Comparison, By Region
3.4. Global Dried Blueberries Market Size and Forecast By Distribution Channel, 2013-2027
3.4.1. Convenience Stores Market Size and Forecast, 2013-2027
3.4.1.1. Revenue (US$ Mn) & Volume Comparison, By Region
3.4.1.2. Market Share Comparison, By Region
3.4.1.3. Y-o-Y growth Comparison, By Region
3.4.2. Forecourt Retailers Market Size and Forecast, 2013-2027
3.4.2.1. Revenue (US$ Mn) & Volume Comparison, By Region
3.4.2.2. Market Share Comparison, By Region
3.4.2.3. Y-o-Y growth Comparison, By Region
3.4.3. Hypermarkets Market Size and Forecast, 2013-2027
3.4.3.1. Revenue (US$ Mn) & Volume Comparison, By Region
3.4.3.2. Market Share Comparison, By Region
3.4.3.3. Y-o-Y growth Comparison, By Region
3.4.4. Supermarkets Market Size and Forecast, 2013-2027
3.4.4.1. Revenue (US$ Mn) & Volume Comparison, By Region
3.4.4.2. Market Share Comparison, By Region
3.4.4.3. Y-o-Y growth Comparison, By Region
3.4.5. Specialty Stores Market Size and Forecast, 2013-2027
3.4.5.1. Revenue (US$ Mn) & Volume Comparison, By Region
3.4.5.2. Market Share Comparison, By Region
3.4.5.3. Y-o-Y growth Comparison, By Region
3.4.6. Independent Small Groceries Market Size and Forecast, 2013-2027
3.4.6.1. Revenue (US$ Mn) & Volume Comparison, By Region
3.4.6.2. Market Share Comparison, By Region
3.4.6.3. Y-o-Y growth Comparison, By Region
3.4.7. Other Grocery Reatilers Market Size and Forecast, 2013-2027
3.4.7.1. Revenue (US$ Mn) & Volume Comparison, By Region
3.4.7.2. Market Share Comparison, By Region
3.4.7.3. Y-o-Y growth Comparison, By Region
3.4.8. Online Retailing Market Size and Forecast, 2013-2027
3.4.8.1. Revenue (US$ Mn) & Volume Comparison, By Region
3.4.8.2. Market Share Comparison, By Region
3.4.8.3. Y-o-Y growth Comparison, By Region
4. North America Dried Blueberries Market Size and Forecast, 2013-2027
4.1. Revenue (US$ Mn) & Volume Comparison, By Country
4.2. Revenue (US$ Mn) & Volume Comparison, By Nature
4.3. Revenue (US$ Mn) & Volume Comparison, By Form
4.4. Revenue (US$ Mn) & Volume Comparison, By End Users
4.5. Revenue (US$ Mn) & Volume Comparison, By Distribution Channel
5. Latin America Dried Blueberries Market Size and Forecast, 2013-2027
5.1. Revenue (US$ Mn) & Volume Comparison, By Country
5.2. Revenue (US$ Mn) & Volume Comparison, By Nature
5.3. Revenue (US$ Mn) & Volume Comparison, By Form
5.4. Revenue (US$ Mn) & Volume Comparison, By End Users
5.5. Revenue (US$ Mn) & Volume Comparison, By Distribution Channel
6. Europe Dried Blueberries Market Size and Forecast, 2013-2027
6.1. Revenue (US$ Mn) & Volume Comparison, By Country
6.2. Revenue (US$ Mn) & Volume Comparison, By Nature
6.3. Revenue (US$ Mn) & Volume Comparison, By Form
6.4. Revenue (US$ Mn) & Volume Comparison, By End Users
6.5. Revenue (US$ Mn) & Volume Comparison, By Distribution Channel
7. APAC Dried Blueberries Market Size and Forecast, 2013-2027
7.1. Revenue (US$ Mn) & Volume Comparison, By Country
7.2. Revenue (US$ Mn) & Volume Comparison, By Nature
7.3. Revenue (US$ Mn) & Volume Comparison, By Form
7.4. Revenue (US$ Mn) & Volume Comparison, By End Users
7.5. Revenue (US$ Mn) & Volume Comparison, By Distribution Channel
8. MEA Dried Blueberries Market Size and Forecast, 2013-2027
8.1. Revenue (US$ Mn) & Volume Comparison, By Country
8.2. Revenue (US$ Mn) & Volume Comparison, By Nature
8.3. Revenue (US$ Mn) & Volume Comparison, By Form
8.4. Revenue (US$ Mn) & Volume Comparison, By End Users
8.5. Revenue (US$ Mn) & Volume Comparison, By Distribution Channel
9. Dried Blueberries Market Size and Forecast, 2013-2027
9.1. Revenue (US$ Mn) & Volume Comparison, By Country
9.2. Revenue (US$ Mn) & Volume Comparison, By Nature
9.3. Revenue (US$ Mn) & Volume Comparison, By Form
9.4. Revenue (US$ Mn) & Volume Comparison, By End Users
9.5. Revenue (US$ Mn) & Volume Comparison, By Distribution Channel
9. Global Dried Blueberries Market Company Share, Competition Landscape and Company Profiles
9.1. Company Share Analysis
9.2. Competition Landscape
9.3. Company Profiles
10. Research Methodology
11. Secondary and Primary Sources
12. Assumptions and Acronyms
13. Disclaimer
TABLE 1 Global Dried Blueberries Market Value (US$ Mn) & Volume, 2013-2018
TABLE 2 Global Dried Blueberries Market Value (US$ Mn) & Volume, 2019-2027
TABLE 3 Global Dried Blueberries Market Value (US$ Mn) & Volume and Y-o-Y, 2018-2027
TABLE 4 Global Organic Segment Value (US$ Mn) & Volume, By Region 2013-2018
TABLE 5 Global Organic Segment Value (US$ Mn) & Volume, By Region 2019-2027
TABLE 6 Global Organic Segment Market Share, By Region 2013-2018
TABLE 7 Global Organic Segment Market Share, By Region 2019-2027
TABLE 8 Global Organic Segment Y-o-Y, By Region 2018-2027
TABLE 9 Global Conventional Segment Value (US$ Mn) & Volume, By Region 2013-2018
TABLE 10 Global Conventional Segment Value (US$ Mn) & Volume, By Region 2019-2027
TABLE 11 Global Conventional Segment Market Share, By Region 2013-2018
TABLE 12 Global Conventional Segment Market Share, By Region 2019-2027
TABLE 13 Global Conventional Segment Y-o-Y, By Region 2018-2027
TABLE 14 Global Slices and Granulates Segment Value (US$ Mn) & Volume, By Region 2013-2018
TABLE 15 Global Slices and Granulates Segment Value (US$ Mn) & Volume, By Region 2019-2027
TABLE 16 Global Slices and Granulates Segment Market Share, By Region 2013-2018
TABLE 17 Global Slices and Granulates Segment Market Share, By Region 2019-2027
TABLE 18 Global Slices and Granulates Segment Y-o-Y, By Region 2018-2027
TABLE 19 Global Powder Segment Value (US$ Mn) & Volume, By Region 2013-2018
TABLE 20 Global Powder Segment Value (US$ Mn) & Volume, By Region 2019-2027
TABLE 21 Global Powder Segment Market Share, By Region 2013-2018
TABLE 22 Global Powder Segment Market Share, By Region 2019-2027
TABLE 23 Global Powder Segment Y-o-Y, By Region 2018-2027
TABLE 24 Global Whole Dried Fruit Segment Value (US$ Mn) & Volume, By Region 2013-2018
TABLE 25 Global Whole Dried Fruit Segment Value (US$ Mn) & Volume, By Region 2019-2027
TABLE 26 Global Whole Dried Fruit Segment Market Share, By Region 2013-2018
TABLE 27 Global Whole Dried Fruit Segment Market Share, By Region 2019-2027
TABLE 28 Global Whole Dried Fruit Segment Y-o-Y, By Region 2018-2027
TABLE 29 Global Bakery Products Segment Value (US$ Mn) & Volume, By Region 2013-2018
TABLE 30 Global Bakery Products Segment Value (US$ Mn) & Volume, By Region 2019-2027
TABLE 31 Global Bakery Products Segment Market Share, By Region 2013-2018
TABLE 32 Global Bakery Products Segment Market Share, By Region 2019-2027
TABLE 33 Global Bakery Products Segment Y-o-Y, By Region 2018-2027
TABLE 34 Global Confectioneries Segment Value (US$ Mn) & Volume, By Region 2013-2018
TABLE 35 Global Confectioneries Segment Value (US$ Mn) & Volume, By Region 2019-2027
TABLE 36 Global Confectioneries Segment Market Share, By Region 2013-2018
TABLE 37 Global Confectioneries Segment Market Share, By Region 2019-2027
TABLE 38 Global Confectioneries Segment Y-o-Y, By Region 2018-2027
TABLE 39 Global Beverages Segment Value (US$ Mn) & Volume, By Region 2013-2018
TABLE 40 Global Beverages Segment Value (US$ Mn) & Volume, By Region 2019-2027
TABLE 41 Global Beverages Segment Market Share, By Region 2013-2018
TABLE 42 Global Beverages Segment Market Share, By Region 2019-2027
TABLE 43 Global Beverages Segment Y-o-Y, By Region 2018-2027
TABLE 44 Global Dairy Products Segment Value (US$ Mn) & Volume, By Region 2013-2018
TABLE 45 Global Dairy Products Segment Value (US$ Mn) & Volume, By Region 2019-2027
TABLE 46 Global Dairy Products Segment Market Share, By Region 2013-2018
TABLE 47 Global Dairy Products Segment Market Share, By Region 2019-2027
TABLE 48 Global Dairy Products Segment Y-o-Y, By Region 2018-2027
TABLE 49 Global Cereal and Snack Bars Segment Value (US$ Mn) & Volume, By Region 2013-2018
TABLE 50 Global Cereal and Snack Bars Segment Value (US$ Mn) & Volume, By Region 2019-2027
TABLE 51 Global Cereal and Snack Bars Segment Market Share, By Region 2013-2018
TABLE 52 Global Cereal and Snack Bars Segment Market Share, By Region 2019-2027
TABLE 53 Global Cereal and Snack Bars Segment Y-o-Y, By Region 2018-2027
TABLE 54 Global Cosmetics and Personal Care Segment Value (US$ Mn) & Volume, By Region 2013-2018
TABLE 55 Global Cosmetics and Personal Care Segment Value (US$ Mn) & Volume, By Region 2019-2027
TABLE 56 Global Cosmetics and Personal Care Segment Market Share, By Region 2013-2018
TABLE 57 Global Cosmetics and Personal Care Segment Market Share, By Region 2019-2027
TABLE 58 Global Cosmetics and Personal Care Segment Y-o-Y, By Region 2018-2027
TABLE 59 Global Dietary Supplements Segment Value (US$ Mn) & Volume, By Region 2013-2018
TABLE 60 Global Dietary Supplements Segment Value (US$ Mn) & Volume, By Region 2019-2027
TABLE 61 Global Dietary Supplements Segment Market Share, By Region 2013-2018
TABLE 62 Global Dietary Supplements Segment Market Share, By Region 2019-2027
TABLE 63 Global Dietary Supplements Segment Y-o-Y, By Region 2018-2027
TABLE 64 Global Food Service Providers Segment Value (US$ Mn) & Volume, By Region 2013-2018
TABLE 65 Global Food Service Providers Segment Value (US$ Mn) & Volume, By Region 2019-2027
TABLE 66 Global Food Service Providers Segment Market Share, By Region 2013-2018
TABLE 67 Global Food Service Providers Segment Market Share, By Region 2019-2027
TABLE 68 Global Food Service Providers Segment Y-o-Y, By Region 2018-2027
TABLE 69 Global Retails Segment Value (US$ Mn) & Volume, By Region 2013-2018
TABLE 70 Global Retails Segment Value (US$ Mn) & Volume, By Region 2019-2027
TABLE 71 Global Retails Segment Market Share, By Region 2013-2018
TABLE 72 Global Retails Segment Market Share, By Region 2019-2027
TABLE 73 Global Retails Segment Y-o-Y, By Region 2018-2027
TABLE 74 Global Others Segment Value (US$ Mn) & Volume, By Region 2013-2018
TABLE 75 Global Others Segment Value (US$ Mn) & Volume, By Region 2019-2027
TABLE 76 Global Others Segment Market Share, By Region 2013-2018
TABLE 77 Global Others Segment Market Share, By Region 2019-2027
TABLE 78 Global Others Segment Y-o-Y, By Region 2018-2027
TABLE 79 Global Convenience Stores Segment Value (US$ Mn) & Volume, By Region 2013-2018
TABLE 80 Global Convenience Stores Segment Value (US$ Mn) & Volume, By Region 2019-2027
TABLE 81 Global Convenience Stores Segment Market Share, By Region 2013-2018
TABLE 82 Global Convenience Stores Segment Market Share, By Region 2019-2027
TABLE 83 Global Convenience Stores Segment Y-o-Y, By Region 2018-2027
TABLE 84 Global Forecourt Retailers Segment Value (US$ Mn) & Volume, By Region 2013-2018
TABLE 85 Global Forecourt Retailers Segment Value (US$ Mn) & Volume, By Region 2019-2027
TABLE 86 Global Forecourt Retailers Segment Market Share, By Region 2013-2018
TABLE 87 Global Forecourt Retailers Segment Market Share, By Region 2019-2027
TABLE 88 Global Forecourt Retailers Segment Y-o-Y, By Region 2018-2027
TABLE 89 Global Hypermarkets Segment Value (US$ Mn) & Volume, By Region 2013-2018
TABLE 90 Global Hypermarkets Segment Value (US$ Mn) & Volume, By Region 2019-2027
TABLE 91 Global Hypermarkets Segment Market Share, By Region 2013-2018
TABLE 92 Global Hypermarkets Segment Market Share, By Region 2019-2027
TABLE 93 Global Hypermarkets Segment Y-o-Y, By Region 2018-2027
TABLE 94 Global Supermarkets Segment Value (US$ Mn) & Volume, By Region 2013-2018
TABLE 95 Global Supermarkets Segment Value (US$ Mn) & Volume, By Region 2019-2027
TABLE 96 Global Supermarkets Segment Market Share, By Region 2013-2018
TABLE 97 Global Supermarkets Segment Market Share, By Region 2019-2027
TABLE 98 Global Supermarkets Segment Y-o-Y, By Region 2018-2027
TABLE 99 Global Specialty Stores Segment Value (US$ Mn) & Volume, By Region 2013-2018
TABLE 100 Global Specialty Stores Segment Value (US$ Mn) & Volume, By Region 2019-2027
TABLE 101 Global Specialty Stores Segment Market Share, By Region 2013-2018
TABLE 102 Global Specialty Stores Segment Market Share, By Region 2019-2027
TABLE 103 Global Specialty Stores Segment Y-o-Y, By Region 2018-2027
TABLE 104 Global Independent Small Groceries Segment Value (US$ Mn) & Volume, By Region 2013-2018
TABLE 105 Global Independent Small Groceries Segment Value (US$ Mn) & Volume, By Region 2019-2027
TABLE 106 Global Independent Small Groceries Segment Market Share, By Region 2013-2018
TABLE 107 Global Independent Small Groceries Segment Market Share, By Region 2019-2027
TABLE 108 Global Independent Small Groceries Segment Y-o-Y, By Region 2018-2027
TABLE 109 Global Other Grocery Reatilers Segment Value (US$ Mn) & Volume, By Region 2013-2018
TABLE 110 Global Other Grocery Reatilers Segment Value (US$ Mn) & Volume, By Region 2019-2027
TABLE 111 Global Other Grocery Reatilers Segment Market Share, By Region 2013-2018
TABLE 112 Global Other Grocery Reatilers Segment Market Share, By Region 2019-2027
TABLE 113 Global Other Grocery Reatilers Segment Y-o-Y, By Region 2018-2027
TABLE 114 Global Online Retailing Segment Value (US$ Mn) & Volume, By Region 2013-2018
TABLE 115 Global Online Retailing Segment Value (US$ Mn) & Volume, By Region 2019-2027
TABLE 116 Global Online Retailing Segment Market Share, By Region 2013-2018
TABLE 117 Global Online Retailing Segment Market Share, By Region 2019-2027
TABLE 118 Global Online Retailing Segment Y-o-Y, By Region 2018-2027
TABLE 119 North America Dried Blueberries Market Value (US$ Mn) & Volume, By Country 2013-2018
TABLE 120 North America Dried Blueberries Market Value (US$ Mn) & Volume, By Country 2019-2027
TABLE 121 North America Dried Blueberries Market Value (US$ Mn) & Volume, By Nature 2013-2018
TABLE 122 North America Dried Blueberries Market Value (US$ Mn) & Volume, By Nature 2019-2027
TABLE 123 North America Dried Blueberries Market Value (US$ Mn) & Volume, By Form 2013-2018
TABLE 124 North America Dried Blueberries Market Value (US$ Mn) & Volume, By Form 2019-2027
TABLE 125 North America Dried Blueberries Market Value (US$ Mn) & Volume, By End Users 2013-2018
TABLE 126 North America Dried Blueberries Market Value (US$ Mn) & Volume, By End Users 2019-2027
TABLE 127 North America Dried Blueberries Market Value (US$ Mn) & Volume, By Distribution Channel 2013-2018
TABLE 128 North America Dried Blueberries Market Value (US$ Mn) & Volume, By Distribution Channel 2019-2027
TABLE 129 Latin America Dried Blueberries Market Value (US$ Mn) & Volume, By Country 2013-2018
TABLE 130 Latin America Dried Blueberries Market Value (US$ Mn) & Volume, By Country 2019-2027
TABLE 131 Latin America Dried Blueberries Market Value (US$ Mn) & Volume, By Nature 2013-2018
TABLE 132 Latin America Dried Blueberries Market Value (US$ Mn) & Volume, By Nature 2019-2027
TABLE 133 Latin America Dried Blueberries Market Value (US$ Mn) & Volume, By Form 2013-2018
TABLE 134 Latin America Dried Blueberries Market Value (US$ Mn) & Volume, By Form 2019-2027
TABLE 135 Latin America Dried Blueberries Market Value (US$ Mn) & Volume, By End Users 2013-2018
TABLE 136 Latin America Dried Blueberries Market Value (US$ Mn) & Volume, By End Users 2019-2027
TABLE 137 Latin America Dried Blueberries Market Value (US$ Mn) & Volume, By Distribution Channel 2013-2018
TABLE 138 Latin America Dried Blueberries Market Value (US$ Mn) & Volume, By Distribution Channel 2019-2027
TABLE 139 Europe Dried Blueberries Market Value (US$ Mn) & Volume, By Country 2013-2018
TABLE 140 Europe Dried Blueberries Market Value (US$ Mn) & Volume, By Country 2019-2027
TABLE 141 Europe Dried Blueberries Market Value (US$ Mn) & Volume, By Nature 2013-2018
TABLE 142 Europe Dried Blueberries Market Value (US$ Mn) & Volume, By Nature 2019-2027
TABLE 143 Europe Dried Blueberries Market Value (US$ Mn) & Volume, By Form 2013-2018
TABLE 144 Europe Dried Blueberries Market Value (US$ Mn) & Volume, By Form 2019-2027
TABLE 145 Europe Dried Blueberries Market Value (US$ Mn) & Volume, By End Users 2013-2018
TABLE 146 Europe Dried Blueberries Market Value (US$ Mn) & Volume, By End Users 2019-2027
TABLE 147 Europe Dried Blueberries Market Value (US$ Mn) & Volume, By Distribution Channel 2013-2018
TABLE 148 Europe Dried Blueberries Market Value (US$ Mn) & Volume, By Distribution Channel 2019-2027
TABLE 149 APAC Dried Blueberries Market Value (US$ Mn) & Volume, By Country 2013-2018
TABLE 150 APAC Dried Blueberries Market Value (US$ Mn) & Volume, By Country 2019-2027
TABLE 151 APAC Dried Blueberries Market Value (US$ Mn) & Volume, By Nature 2013-2018
TABLE 152 APAC Dried Blueberries Market Value (US$ Mn) & Volume, By Nature 2019-2027
TABLE 153 APAC Dried Blueberries Market Value (US$ Mn) & Volume, By Form 2013-2018
TABLE 154 APAC Dried Blueberries Market Value (US$ Mn) & Volume, By Form 2019-2027
TABLE 155 APAC Dried Blueberries Market Value (US$ Mn) & Volume, By End Users 2013-2018
TABLE 156 APAC Dried Blueberries Market Value (US$ Mn) & Volume, By End Users 2019-2027
TABLE 157 APAC Dried Blueberries Market Value (US$ Mn) & Volume, By Distribution Channel 2013-2018
TABLE 158 APAC Dried Blueberries Market Value (US$ Mn) & Volume, By Distribution Channel 2019-2027
TABLE 159 MEA Dried Blueberries Market Value (US$ Mn) & Volume, By Country 2013-2018
TABLE 160 MEA Dried Blueberries Market Value (US$ Mn) & Volume, By Country 2019-2027
TABLE 161 MEA Dried Blueberries Market Value (US$ Mn) & Volume, By Nature 2013-2018
TABLE 162 MEA Dried Blueberries Market Value (US$ Mn) & Volume, By Nature 2019-2027
TABLE 163 MEA Dried Blueberries Market Value (US$ Mn) & Volume, By Form 2013-2018
TABLE 164 MEA Dried Blueberries Market Value (US$ Mn) & Volume, By Form 2019-2027
TABLE 165 MEA Dried Blueberries Market Value (US$ Mn) & Volume, By End Users 2013-2018
TABLE 166 MEA Dried Blueberries Market Value (US$ Mn) & Volume, By End Users 2019-2027
TABLE 167 MEA Dried Blueberries Market Value (US$ Mn) & Volume, By Distribution Channel 2013-2018
TABLE 168 MEA Dried Blueberries Market Value (US$ Mn) & Volume, By Distribution Channel 2019-2027
FIG. 1 Global Dried Blueberries Market Value (US$ Mn), 2013-2018
FIG. 2 Global Dried Blueberries Market Value (US$ Mn) Forecast, 2019-2027
FIG. 3 Global Dried Blueberries Market Value (US$ Mn) and Y-o-Y, 2018-2027
FIG. 4 Global Organic Segment Market Value (US$ Mn) By Region, 2013-2018
FIG. 5 Global Organic Segment Market Value (US$ Mn) By Region, 2019-2027
FIG. 6 Global Organic Segment Y-o-Y Growth Rate, By Region, 2018-2027
FIG. 7 Global Conventional Segment Market Value (US$ Mn) By Region, 2013-2018
FIG. 8 Global Conventional Segment Market Value (US$ Mn) By Region, 2019-2027
FIG. 9 Global Conventional Segment Y-o-Y Growth Rate, By Region, 2018-2027
FIG. 10 Global Slices and Granulates Segment Market Value (US$ Mn) By Region, 2013-2018
FIG. 11 Global Slices and Granulates Segment Market Value (US$ Mn) By Region, 2019-2027
FIG. 12 Global Slices and Granulates Segment Y-o-Y Growth Rate, By Region, 2018-2027
FIG. 13 Global Powder Segment Market Value (US$ Mn) By Region, 2013-2018
FIG. 14 Global Powder Segment Market Value (US$ Mn) By Region, 2019-2027
FIG. 15 Global Powder Segment Y-o-Y Growth Rate, By Region, 2018-2027
FIG. 16 Global Whole Dried Fruit Segment Market Value (US$ Mn) By Region, 2013-2018
FIG. 17 Global Whole Dried Fruit Segment Market Value (US$ Mn) By Region, 2019-2027
FIG. 18 Global Whole Dried Fruit Segment Y-o-Y Growth Rate, By Region, 2018-2027
FIG. 19 Global Bakery Products Segment Market Value (US$ Mn) By Region, 2013-2018
FIG. 20 Global Bakery Products Segment Market Value (US$ Mn) By Region, 2019-2027
FIG. 21 Global Bakery Products Segment Y-o-Y Growth Rate, By Region, 2018-2027
FIG. 22 Global Confectioneries Segment Market Value (US$ Mn) By Region, 2013-2018
FIG. 23 Global Confectioneries Segment Market Value (US$ Mn) By Region, 2019-2027
FIG. 24 Global Confectioneries Segment Y-o-Y Growth Rate, By Region, 2018-2027
FIG. 25 Global Beverages Segment Market Value (US$ Mn) By Region, 2013-2018
FIG. 26 Global Beverages Segment Market Value (US$ Mn) By Region, 2019-2027
FIG. 27 Global Beverages Segment Y-o-Y Growth Rate, By Region, 2018-2027
FIG. 28 Global Dairy Products Segment Market Value (US$ Mn) By Region, 2013-2018
FIG. 29 Global Dairy Products Segment Market Value (US$ Mn) By Region, 2019-2027
FIG. 30 Global Dairy Products Segment Y-o-Y Growth Rate, By Region, 2018-2027
FIG. 31 Global Cereal and Snack Bars Segment Market Value (US$ Mn) By Region, 2013-2018
FIG. 32 Global Cereal and Snack Bars Segment Market Value (US$ Mn) By Region, 2019-2027
FIG. 33 Global Cereal and Snack Bars Segment Y-o-Y Growth Rate, By Region, 2018-2027
FIG. 34 Global Cosmetics and Personal Care Segment Market Value (US$ Mn) By Region, 2013-2018
FIG. 35 Global Cosmetics and Personal Care Segment Market Value (US$ Mn) By Region, 2019-2027
FIG. 36 Global Cosmetics and Personal Care Segment Y-o-Y Growth Rate, By Region, 2018-2027
FIG. 37 Global Dietary Supplements Segment Market Value (US$ Mn) By Region, 2013-2018
FIG. 38 Global Dietary Supplements Segment Market Value (US$ Mn) By Region, 2019-2027
FIG. 39 Global Dietary Supplements Segment Y-o-Y Growth Rate, By Region, 2018-2027
FIG. 40 Global Food Service Providers Segment Market Value (US$ Mn) By Region, 2013-2018
FIG. 41 Global Food Service Providers Segment Market Value (US$ Mn) By Region, 2019-2027
FIG. 42 Global Food Service Providers Segment Y-o-Y Growth Rate, By Region, 2018-2027
FIG. 43 Global Retails Segment Market Value (US$ Mn) By Region, 2013-2018
FIG. 44 Global Retails Segment Market Value (US$ Mn) By Region, 2019-2027
FIG. 45 Global Retails Segment Y-o-Y Growth Rate, By Region, 2018-2027
FIG. 46 Global Others Segment Market Value (US$ Mn) By Region, 2013-2018
FIG. 47 Global Others Segment Market Value (US$ Mn) By Region, 2019-2027
FIG. 48 Global Others Segment Y-o-Y Growth Rate, By Region, 2018-2027
FIG. 49 Global Convenience Stores Segment Market Value (US$ Mn) By Region, 2013-2018
FIG. 50 Global Convenience Stores Segment Market Value (US$ Mn) By Region, 2019-2027
FIG. 51 Global Convenience Stores Segment Y-o-Y Growth Rate, By Region, 2018-2027
FIG. 52 Global Forecourt Retailers Segment Market Value (US$ Mn) By Region, 2013-2018
FIG. 53 Global Forecourt Retailers Segment Market Value (US$ Mn) By Region, 2019-2027
FIG. 54 Global Forecourt Retailers Segment Y-o-Y Growth Rate, By Region, 2018-2027
FIG. 55 Global Hypermarkets Segment Market Value (US$ Mn) By Region, 2013-2018
FIG. 56 Global Hypermarkets Segment Market Value (US$ Mn) By Region, 2019-2027
FIG. 57 Global Hypermarkets Segment Y-o-Y Growth Rate, By Region, 2018-2027
FIG. 58 Global Supermarkets Segment Market Value (US$ Mn) By Region, 2013-2018
FIG. 59 Global Supermarkets Segment Market Value (US$ Mn) By Region, 2019-2027
FIG. 60 Global Supermarkets Segment Y-o-Y Growth Rate, By Region, 2018-2027
FIG. 61 Global Specialty Stores Segment Market Value (US$ Mn) By Region, 2013-2018
FIG. 62 Global Specialty Stores Segment Market Value (US$ Mn) By Region, 2019-2027
FIG. 63 Global Specialty Stores Segment Y-o-Y Growth Rate, By Region, 2018-2027
FIG. 64 Global Independent Small Groceries Segment Market Value (US$ Mn) By Region, 2013-2018
FIG. 65 Global Independent Small Groceries Segment Market Value (US$ Mn) By Region, 2019-2027
FIG. 66 Global Independent Small Groceries Segment Y-o-Y Growth Rate, By Region, 2018-2027
FIG. 67 Global Other Grocery Reatilers Segment Market Value (US$ Mn) By Region, 2013-2018
FIG. 68 Global Other Grocery Reatilers Segment Market Value (US$ Mn) By Region, 2019-2027
FIG. 69 Global Other Grocery Reatilers Segment Y-o-Y Growth Rate, By Region, 2018-2027
FIG. 70 Global Online Retailing Segment Market Value (US$ Mn) By Region, 2013-2018
FIG. 71 Global Online Retailing Segment Market Value (US$ Mn) By Region, 2019-2027
FIG. 72 Global Online Retailing Segment Y-o-Y Growth Rate, By Region, 2018-2027
FIG. 73 North America Dried Blueberries Market Value (US$ Mn), By Country 2013-2018
FIG. 74 North America Dried Blueberries Market Value (US$ Mn), By Country 2019-2027
FIG. 75 North America Dried Blueberries Market Value (US$ Mn), By Nature 2013-2018
FIG. 76 North America Dried Blueberries Market Value (US$ Mn), By Nature 2019-2027
FIG. 77 North America Dried Blueberries Market Value (US$ Mn), By Form 2013-2018
FIG. 78 North America Dried Blueberries Market Value (US$ Mn), By Form 2019-2027
FIG. 79 North America Dried Blueberries Market Value (US$ Mn), By End Users 2013-2018
FIG. 80 North America Dried Blueberries Market Value (US$ Mn), By End Users 2019-2027
FIG. 81 North America Dried Blueberries Market Value (US$ Mn), By Distribution Channel 2013-2018
FIG. 82 North America Dried Blueberries Market Value (US$ Mn), By Distribution Channel 2019-2027
FIG. 83 Latin America Dried Blueberries Market Value (US$ Mn), By Country 2013-2018
FIG. 84 Latin America Dried Blueberries Market Value (US$ Mn), By Country 2019-2027
FIG. 85 Latin America Dried Blueberries Market Value (US$ Mn), By Nature 2013-2018
FIG. 86 Latin America Dried Blueberries Market Value (US$ Mn), By Nature 2019-2027
FIG. 87 Latin America Dried Blueberries Market Value (US$ Mn), By Form 2013-2018
FIG. 88 Latin America Dried Blueberries Market Value (US$ Mn), By Form 2019-2027
FIG. 89 Latin America Dried Blueberries Market Value (US$ Mn), By End Users 2013-2018
FIG. 90 Latin America Dried Blueberries Market Value (US$ Mn), By End Users 2019-2027
FIG. 91 Latin America Dried Blueberries Market Value (US$ Mn), By Distribution Channel 2013-2018
FIG. 92 Latin America Dried Blueberries Market Value (US$ Mn), By Distribution Channel 2019-2027
FIG. 93 Europe Dried Blueberries Market Value (US$ Mn), By Country 2013-2018
FIG. 94 Europe Dried Blueberries Market Value (US$ Mn), By Country 2019-2027
FIG. 95 Europe Dried Blueberries Market Value (US$ Mn), By Nature 2013-2018
FIG. 96 Europe Dried Blueberries Market Value (US$ Mn), By Nature 2019-2027
FIG. 97 Europe Dried Blueberries Market Value (US$ Mn), By Form 2013-2018
FIG. 98 Europe Dried Blueberries Market Value (US$ Mn), By Form 2019-2027
FIG. 99 Europe Dried Blueberries Market Value (US$ Mn), By End Users 2013-2018
FIG. 100 Europe Dried Blueberries Market Value (US$ Mn), By End Users 2019-2027
FIG. 101 Europe Dried Blueberries Market Value (US$ Mn), By Distribution Channel 2013-2018
FIG. 102 Europe Dried Blueberries Market Value (US$ Mn), By Distribution Channel 2019-2027
FIG. 103 APAC Dried Blueberries Market Value (US$ Mn), By Country 2013-2018
FIG. 104 APAC Dried Blueberries Market Value (US$ Mn), By Country 2019-2027
FIG. 105 APAC Dried Blueberries Market Value (US$ Mn), By Nature 2013-2018
FIG. 106 APAC Dried Blueberries Market Value (US$ Mn), By Nature 2019-2027
FIG. 107 APAC Dried Blueberries Market Value (US$ Mn), By End Users 2013-2018
FIG. 108 APAC Dried Blueberries Market Value (US$ Mn), By Form 2019-2027
FIG. 109 APAC Dried Blueberries Market Value (US$ Mn), By End Users 2013-2018
FIG. 110 APAC Dried Blueberries Market Value (US$ Mn), By End Users 2019-2027
FIG. 111 APAC Dried Blueberries Market Value (US$ Mn), By Distribution Channel 2013-2018
FIG. 112 APAC Dried Blueberries Market Value (US$ Mn), By Distribution Channel 2019-2027
FIG. 113 MEA Dried Blueberries Market Value (US$ Mn), By Country 2013-2018
FIG. 114 MEA Dried Blueberries Market Value (US$ Mn), By Country 2019-2027
FIG. 115 MEA Dried Blueberries Market Value (US$ Mn), By Nature 2013-2018
FIG. 116 MEA Dried Blueberries Market Value (US$ Mn), By Nature 2019-2027
FIG. 117 MEA Dried Blueberries Market Value (US$ Mn), By Form 2013-2018
FIG. 118 MEA Dried Blueberries Market Value (US$ Mn), By Form 2019-2027
FIG. 119 MEA Dried Blueberries Market Value (US$ Mn), By End Users 2013-2018
FIG. 120 MEA Dried Blueberries Market Value (US$ Mn), By End Users 2019-2027
FIG. 121 MEA Dried Blueberries Market Value (US$ Mn), By Distribution Channel 2013-2018
FIG. 122 MEA Dried Blueberries Market Value (US$ Mn), By Distribution Channel 2019-2027
Copyright © Transparency Market Research, Inc. All Rights reserved
Trust Online

Dried Blueberries Market