
Reports
Reports
A mounting number of companies across various industrial verticals are modifying their business models with increased importance of consumer satisfaction, and the maritime freight landscape is no exception. With the market for maritime freight witnessing incremental growth in the service industry, it is undergoing digital transformation to improve transparency and offer a quicker response to customers’ needs in this landscape.
One of the recent developments in the technologically-advancing maritime freight landscape reflects a rise in the digital transformation of booking software. Digitization of sea freight booking through automation and cloud-based technologies is showing unprecedented growth in the digital transformation of maritime freight market.
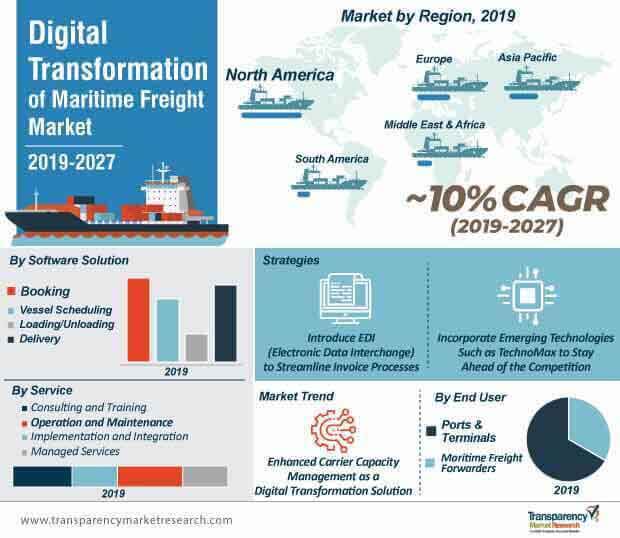
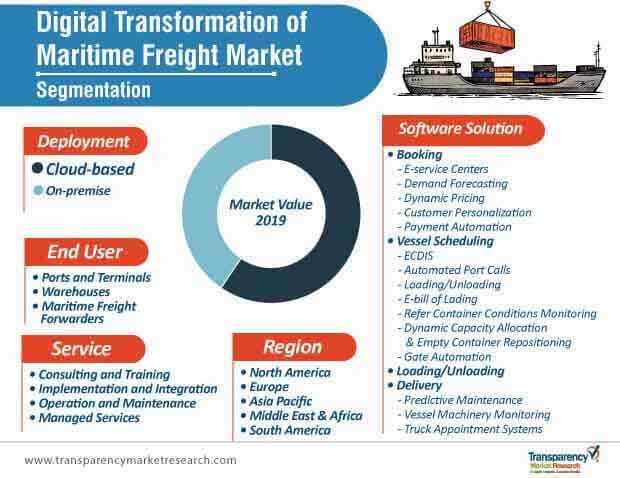
Cloud-based software solutions are poised to hold ~60% of the digital transformation of maritime freight market share by 2027; cloud-based solutions and cloud management tools are gaining popularity with their cost-saving benefits for stakeholders in the maritime supply space, thus triggering growth in the digital transformation of maritime freight.
For instance, in March 2018, Hapag Lloyd launched its cloud-based rate management platform - Cargo Sphere - which gives its customers fully-automated access to all its rates. The company further declared that, the platform can also deliver sales-related benefits, including more frequent selection of optimal booking and faster quoting to customers, ultimately to improve customer satisfaction by sharing accurate Hapag-Lloyd rates in real-time with its partners.
Automated contract management at the booking stage can enhance accuracy and significantly reduce business overheads by decreasing processing time. By obliterating email-driven spreadsheets and PDFs, such a robust innovation will move the digital transformation of maritime freight industry beyond incremental gains.
Such innovations come at an opportune time when automated software solutions at the booking stage are set to grow at a CAGR of ~10% during the forecast period. Maximum digital transformational spending is likely to be recorded at the booking stage, giving market players in the maritime freight industry key insights on directing business development strategies towards these business operations.
Making the vision of a digitally-transformed maritime freight market a reality will need many different tacks. Shipping giants tantalized by the prospects of digitization are channelizing all their energies by developing a hi-tech online marketplace, which allows shipping customers to make reservations via a digital portal. This would help stakeholders in gaining more transparency in an industry that is opaque and fraught with volatility. Effecting a reconciliation between invoices and bookings can be error-prone, onerous, and time-consuming. Settling of freight invoices via EDI (Electronic Data Interchange) can be much more efficient at just the push of a button, and can enable stakeholders in streamlining their invoice processes, thus improving their bottom line.
The technological juggernaut has already accelerated to a new level, holding the potential to completely transform the maritime freight sector. An emerging technology, dubbed TechnoMax, is all set to change the face of the shipping sector. A TechnoMax LNG carrier can be made of advanced materials such as graphene, to make a ship lighter, while sensors made of the same material will detect the ship’s emissions and pollution levels. In addition, Big Data Analytics on board will allow it to smartly monitor cargo information, navigation, and communication, and the right mix of diesel and biofuels will reduce the cost of oil, thus, driving the growth of the digital transformation of maritime freight sector.
Enhanced carrier capacity management and robust operational efficiencies should be a major emphasis point for maritime freight sectors that are looking at digital transformation. Increasing cargo intake has always been the foremost strategy of key market players in the maritime freight industry. Furthermore, the IMO (International Maritime Organization) has taken proactive steps; in 2018, it issued guidelines that all maritime freight containers will have to reduce their emissions by at least 50% by the year 2050. This will propel stakeholders to increase their investments in technologies that allow them to track and analyze cargo vessels for operational viability and environmental sustainability.
Since the maritime freight industry has a very high turnover, most businesses are now focused on reducing worker attrition and enhancing their productivity. With the adoption of voice technology, stakeholders are successfully improving productivity at warehouses, and consequently, the digital transformation of maritime freight market is gaining traction with a significant rise in revenue margins.
Furthermore, the applications of connected technologies and Internet of Things (IoT) in maritime freight will give businesses a vantage point to peek into the merchandise that is present inside the cargo. A robust and complex IoT application provides protection for expensive and sensitive cargo, and with the combination of IoT and cloud technology, suppliers can track and connect with cargo moving from one part of the globe to another.
Trade wars and global trade relations have always made headlines and brought about significant changes in the market landscape. Case in point, the massive trade war between the U.S. and China in 2018 saw the introduction of many tariffs on goods imported by both countries, and strained the relations between the two. Such impositions will restrict trade and the movement of cargo, and obviate the benefits of digital transformation of maritime freight and curtail its demand in the maritime sector.
New regulations, dubbed IMO 2020, will enforce a 0.5% sulfur emission cap, globally, on the maritime freight industry. Its economic impact will lead to a drop in the demand for high sulfur fuel oil and an increased demand for diesel. These dramatic fuel regulations will significantly impact freight rates, causing them to rise, which will be passed on to consumers. The hike in freight rates will have a cascading effect, leading to a reduction in the demand for digitized solutions in the digital transformation of maritime freight market.
Rising volumes of cargo bring bigger ships that cannot traverse narrow sea channels. Stringent rules of sea channels limit the entry of big containerized ships. The impact is heightened when two-way traffic on narrow channels is prohibited. Such restrictions hamper port growth, forcing maritime freight conglomerates to take their business elsewhere. This will negatively impact the growth of the digital transformation of maritime freight market over the forecast period.
North America is expected to hold ~36% share of the global digital transformation of maritime freight market by 2027. This can largely be attributed to the proliferation of cloud-based solutions vis-à-vis on premise deployment. Advanced analytics, storage, and data mining can be done on the cloud without incurring exorbitant storage costs. The volume of merchandise that is exported has increased dramatically in North America, propelling digitization in the segment of vessel scheduling. Within vessel scheduling, ECDIS will be the main technology driving the growth of the digital transformation of maritime freight market. Along with this, automated port calls are also likely to be deployed soon.
On the other hand, the digital transformation maritime freight market in Europe is also witnessing positive growth, with shipping companies in the region aggressively pursuing digitization, as maximum trade activities are taking place at ports in France and Germany. With rising competition among key market players, more and more companies are opting for digital transformation solutions to enhance their operational efficiency.
IBM Corporation and Oracle Corporation are among the leading market players in the arena of digitization, with their prowess lying in the field of advanced cloud platforms, AI, analytics, SaaS solutions, Blockchain, and cognitive solutions. They have continued to dominate the market landscape of digital transformation of maritime freight, due to expertise in product diversification and strategic partnerships & acquisitions in order to enhance their product portfolio and customer base.
In March 2018, Oracle Corporation spearheaded the launch of a fully-autonomous data warehousing cloud platform as a supply chain management solution. This solution is highly innovative and path-breaking, as it self-drives, self-secures, and self-repairs. The solution boasts of an industry-defying performance, and will serve as a role model to emerging market players to embrace digitization and stay competitive.
In August 2018, shipping giant Maersk and IBM announced the creation of TradeLens, jointly developed by the two companies to introduce Blockchain into the entire supply chain market of the globe. Such timely collaborations spur industry-defying innovation, and also bolster information sharing and transparency.
Both, Advantech and Mindtree Ltd are emerging players who are pioneering robust solutions in the spheres of IoT, digital transformation, and technology services, with prime focus on customized digital solutions across the value chain. Advantech and Mindtree’s prime focus is to provide state-of-the-art solutions for their clients in order to enable them to outperform their competition.
In May 2019, Mindtree announced the launch of QuikDeploy, an IP-driven approach to rapidly deploy SAP S/4HANA into the Microsoft Azure cloud. This enables rapid digital transformation and customer-focused innovations on different platforms. Likewise, Advantech is majorly focused on industrial IoT due to its myriad applications and benefits.
In April 2019, it announced the launch of a modular data collection gateway for edge IoT application. Its thrust into the innovation of newer technologies is allowing it to capture larger market shares, globally.
Analysts’ Viewpoint
A comprehensive view of the digital transformation of maritime freight market has led our analysts to conclude that, the market is growing at an impressive rate, with North America and Europe holding a large chunk of the global demand for digital transformation of maritime freight and its applications. The rising demand for digitization and its versatile usage in diverse fields such as booking, vessel scheduling, and delivery is spurring its demand. The impact of the high demand for digitization for bookings on the digital transformation of maritime freight market will remain high, globally. Strong financial position and technological innovations of key market players will also give impetus to the digital transformation of maritime freight market.
Technological breakthroughs such as AI, IoT, Blockchain, robotics, and sensor technology could provide timely succor as a cost-effective and time-saving strategy, thereby increasing the profit margins of market players. Companies with research & development capabilities and technological prowess will gather momentum and profitability in the digital transformation of maritime freight market. Leading players who are leveraging technology will continue to grow exponentially and have a vast market revenue share. However, cyber security and trade restrictions could restrain the growth of the digital transformation of maritime freight market.
Digital Transformation of Maritime Freight Market in Brief
Digital Transformation of Maritime Freight Market: Definition
Asia Pacific Digital Transformation of Maritime Freight Market: Snapshot
Asia Pacific is one of the fastest growing regions in digital transformation of maritime freight market, where countries such as India and China are dominating the digital transformation of maritime freight market with rapid advancements in technology, and integrating them with shipping companies. Moreover, Asia holds the largest population in the word, which leads to the increased demand for products, and this has resulted in a rise in trade across the globe. The adoption rate of digitization in maritime freight, specifically in this region, is high in order to effectively and optimally manage such high volumes of data related to ships and vessels, quantity to be traded, and number of ports.
Key Growth Drivers of the Digital Transformation of Maritime Freight Market
Key Challenges Faced by Digital Transformation of Maritime Freight Market Players
Digital Transformation of Maritime Freight Market: Competitive Landscape
Digital Transformation of Maritime Freight Market: Company Profile Snapshot
IBM Corporation: Founded in 1911, IBM Corporation is a prominent player in the field of cognitive solutions and cloud platforms. The company was founded as Computing-Tabulating-Recording (CTR), and was renamed as ‘International Business Machines’ in 1924. IBM manufactures and markets computer hardware, middleware, and software. It also provides hosting and consulting services in diverse fields, ranging from mainframe computers to nanotechnology. Currently, it is working with Maersk Line to provide solutions related to the digital transformation of maritime freight.
SAP SE: Founded in 1972, SAP SE is a leading global player in the field of software and software-related services. The company provides advisory services, support and success plans, premium engagements, cloud services, and implementation services. Based on market capitalization, SAP is the third-largest independent software manufacturer in the world, and has 130 regional offices, globally.
Oracle Corporation: Founded in 1977, Oracle Corporation provides a complete suite of services, including software as a service, platform as a service, infrastructure as a service, and data as a service. It has its presence in 175 countries across the globe. The company is focused on offering applications, platforms, and IT infrastructure products and services. It operates through three business segments: Cloud and Licensing, Hardware, and Services.
Other major players operating in the global digital transformation of maritime freight market and profiled in the report include
Companies are shifting toward the adoption of AI, machine learning, blockchain, and upgrading their skills to gain a competitive advantage in the digital transformation of maritime freight market, apart from maintaining their position in the market.
1. Preface
1.1. Market Scope
1.2. Market Segmentation
1.3. Key Research Objectives
2. Assumptions and Research Methodology
2.1. Market Taxonomy - Segment Definitions
2.2. Research Methodology
2.2.1. List of Primary and Secondary Sources
2.3. Key Assumptions for Data Modeling
3. Executive Summary: Global Digital Transformation of Maritime Freight
4. Market Overview
4.1. Introduction
4.2. Global Market – Macro Economic Factors Overview
4.2.1. World Seaborne Trade (%), by Region - 2017
4.2.2. World Seaborne Trade in Cargo (Ton-Miles), 2013–2018
4.2.3. World Container Port Throughput (Mn TEU), 2013–2018
4.3. Market Factor Analysis
4.3.1. Porter’s Five Forces Analysis
4.3.2. PESTEL Analysis
4.3.3. Value Chain Analysis
4.3.4. Market Dynamics (Growth Influencers)
4.3.4.1. Drivers
4.3.4.2. Restraints
4.3.4.3. Opportunities
4.3.4.4. Impact Analysis of Drivers & Restraints
4.4. Regulations and Policies
4.5. Penetration of Digitalization Across the Shipping Process (%)
4.5.1. Booking
4.5.2. Vessel Scheduling
4.5.3. Loading/ Unloading
4.5.4. Delivery
4.6. Adoption Analysis of Digitalization in Logistics
4.7. Overview of Significant Themes for Digital Transformation of the Logistics Industry
4.8. Adoption Analysis of Logistics Control Towers, 2015 & 2025
4.8.1. By Road Freight
4.8.2. By Marine Freight
4.8.3. By Air Freight
4.9. Implementation Stage of Technologies in Logistics
4.10. Adoption Analysis of Analytics as a Service in Logistics, 2015 & 2025
4.10.1. By Road Freight
4.10.2. By Marine Freight
4.10.3. By Air Freight
4.11. Analysis of Impact of Trade War on Maritime Industry
4.12. Overview of Major Technologies Causing Disruption in Maritime Freight
4.12.1. Big Data and Analytics
4.12.2. Block chain
4.12.3. Cyber Technologies
4.12.4. Autonomous Vessels & Drones
4.12.5. Robotics
4.12.6. AR & VR
4.13. Analysis of Automation Levels Across Maritime Order-to-Cash Cycle
4.14. Global Digital Transformation of Maritime Freight Analysis and Forecast, 2017 - 2027
4.14.1. Market Revenue Analysis (US$ Mn)
4.14.1.1. Historic Growth Trends, 2016-2018
4.14.1.2. Forecast Trends, 2019-2027
4.15. Market Opportunity Assessment– By Region (Global/North America/Europe/Asia Pacific/Middle East & Africa/South America)
4.15.1. By Software
4.15.2. By Deployment
4.15.3. By Services
4.15.4. By End-user
4.16. Competitive Scenario and Trends
4.16.1. List of Emerging, Prominent and Leading Players
4.16.2. Mergers & Acquisitions, Expansions
4.17. Market Outlook
5. Global Digital Transformation of Maritime Freight Analysis and Forecast, by Software
5.1. Overview and Definitions
5.2. Key Segment Analysis
5.3. Digital Transformation of Maritime Freight Size (US$ Mn) Forecast, by Software, 2017 - 2027
5.3.1. Booking
5.3.1.1. E-service centers
5.3.1.2. Demand Forecasting
5.3.1.3. Dynamic Pricing
5.3.1.4. Customer Personalization
5.3.1.5. Payment Automation
5.3.2. Vessel Scheduling
5.3.2.1. ECDIS
5.3.2.2. Automated port calls
5.3.2.3. Loading/ Unloading
5.3.2.4. E bill of lading
5.3.2.5. Reefer Container Conditions Monitoring
5.3.2.6. Dynamic Capacity Allocation & Empty Container Repositioning
5.3.2.7. Gate Automation
5.3.3. Delivery
5.3.3.1. Predictive Maintenance
5.3.3.2. Vessel Machinery Monitoring
5.3.3.3. Truck Appointment System
6. Global Digital Transformation of Maritime Freight Analysis and Forecast, by Deployment
6.1. Overview and Definitions
6.2. Key Segment Analysis
6.3. Digital Transformation of Maritime Freight Size (US$ Mn) Forecast, by Deployment, 2017 - 2027
6.3.1. Cloud based
6.3.2. On-premise
7. Global Digital Transformation of Maritime Freight Analysis and Forecast, By Services
7.1. Key Segment Analysis
7.2. Digital Transformation of Maritime Freight Size (US$ Mn) Forecast, By Services, 2017 - 2027
7.2.1. Consulting & Training
7.2.2. Implementation & Integration
7.2.3. Operation & Maintenance
7.2.4. Managed Services
8. Global Digital Transformation of Maritime Freight Analysis and Forecast, By End-user
8.1. Key Segment Analysis
8.2. Digital Transformation of Maritime Freight Size (US$ Mn) Forecast, By End-user, 2017 - 2027
8.2.1. Ports & Terminals
8.2.2. Maritime Freight Forwarders
9. Global Digital Transformation of Maritime Freight Analysis and Forecast, by Region
9.1. Overview
9.2. Key Segment Analysis
9.3. Digital Transformation of Maritime Freight Size (US$ Mn) Forecast, by Region, 2017 - 2027
9.3.1. North America
9.3.2. Europe
9.3.3. Asia Pacific
9.3.4. Middle East & Africa
9.3.5. South America
10. North America Digital Transformation of Maritime Freight Analysis and Forecast
10.1. Key Findings
10.2. Digital Transformation of Maritime Freight Size (US$ Mn) Forecast, by Software, 2017 - 2027
10.2.1. Booking
10.2.1.1. E-service centers
10.2.1.2. Demand Forecasting
10.2.1.3. Dynamic Pricing
10.2.1.4. Customer Personalization
10.2.1.5. Payment Automation
10.2.2. Vessel Scheduling
10.2.2.1. ECDIS
10.2.2.2. Automated port calls
10.2.2.3. Loading/ Unloading
10.2.2.4. E bill of lading
10.2.2.5. Reefer Container Conditions Monitoring
10.2.2.6. Dynamic Capacity Allocation & Empty Container Repositioning
10.2.2.7. Gate Automation
10.2.3. Delivery
10.2.3.1. Predictive Maintenance
10.2.3.2. Vessel Machinery Monitoring
10.2.3.3. Truck Appointment System
10.3. Digital Transformation of Maritime Freight Size (US$ Mn) Forecast, by Deployment, 2017 - 2027
10.3.1. Cloud based
10.3.2. On-premise
10.4. Digital Transformation of Maritime Freight Size (US$ Mn) Forecast, By Services, 2017 - 2027
10.4.1. Consulting & Training
10.4.2. Implementation & Integration
10.4.3. Operation & Maintenance
10.4.4. Managed Services
10.5. Digital Transformation of Maritime Freight Size (US$ Mn) Forecast, By End-user, 2017 - 2027
10.5.1. Ports & Terminals
10.5.2. Maritime Freight Forwarders
10.6. Digital Transformation of Maritime Freight Size (US$ Mn) Forecast, by Country & Sub-region, 2017 - 2027
10.6.1. The U.S.
10.6.2. Canada
10.6.3. Rest of North America
11. Europe Digital Transformation of Maritime Freight Analysis and Forecast
11.1. Key Findings
11.2. Digital Transformation of Maritime Freight Size (US$ Mn) Forecast, by Software, 2017 - 2027
11.2.1. Booking
11.2.1.1. E-service centers
11.2.1.2. Demand Forecasting
11.2.1.3. Dynamic Pricing
11.2.1.4. Customer Personalization
11.2.1.5. Payment Automation
11.2.2. Vessel Scheduling
11.2.2.1. ECDIS
11.2.2.2. Automated port calls
11.2.2.3. Loading/ Unloading
11.2.2.4. E bill of lading
11.2.2.5. Reefer Container Conditions Monitoring
11.2.2.6. Dynamic Capacity Allocation & Empty Container Repositioning
11.2.2.7. Gate Automation
11.2.3. Delivery
11.2.3.1. Predictive Maintenance
11.2.3.2. Vessel Machinery Monitoring
11.2.3.3. Truck Appointment System
11.3. Digital Transformation of Maritime Freight Size (US$ Mn) Forecast, by Deployment, 2017 - 2027
11.3.1. Cloud based
11.3.2. On-premise
11.4. Digital Transformation of Maritime Freight Size (US$ Mn) Forecast, By Services, 2017 - 2027
11.4.1. Consulting & Training
11.4.2. Implementation & Integration
11.4.3. Operation & Maintenance
11.4.4. Managed Services
11.5. Digital Transformation of Maritime Freight Size (US$ Mn) Forecast, By End-user, 2017 - 2027
11.5.1. Ports & Terminals
11.5.2. Maritime Freight Forwarders
11.6. Digital Transformation of Maritime Freight Size (US$ Mn) Forecast, by Country& Sub-region, 2017 - 2027
11.6.1. Germany
11.6.2. The U.K.
11.6.3. France
11.6.4. Rest of Europe
12. Asia Pacific Digital Transformation of Maritime Freight Analysis and Forecast
12.1. Key Findings
12.2. Digital Transformation of Maritime Freight Size (US$ Mn) Forecast, by Software, 2017 - 2027
12.2.1. Booking
12.2.1.1. E-service centers
12.2.1.2. Demand Forecasting
12.2.1.3. Dynamic Pricing
12.2.1.4. Customer Personalization
12.2.1.5. Payment Automation
12.2.2. Vessel Scheduling
12.2.2.1. ECDIS
12.2.2.2. Automated port calls
12.2.2.3. Loading/ Unloading
12.2.2.4. E bill of lading
12.2.2.5. Reefer Container Conditions Monitoring
12.2.2.6. Dynamic Capacity Allocation & Empty Container Repositioning
12.2.2.7. Gate Automation
12.2.3. Delivery
12.2.3.1. Predictive Maintenance
12.2.3.2. Vessel Machinery Monitoring
12.2.3.3. Truck Appointment System
12.3. Digital Transformation of Maritime Freight Size (US$ Mn) Forecast, by Deployment, 2017 - 2027
12.3.1. Cloud based
12.3.2. On-premise
12.4. Digital Transformation of Maritime Freight Size (US$ Mn) Forecast, By Services, 2017 - 2027
12.4.1. Consulting & Training
12.4.2. Implementation & Integration
12.4.3. Operation & Maintenance
12.4.4. Managed Services
12.5. Digital Transformation of Maritime Freight Size (US$ Mn) Forecast, By End-user, 2017 - 2027
12.5.1. Ports & Terminals
12.5.2. Maritime Freight Forwarders
12.6. Size (US$ Mn) Forecast, by Country& Sub-region, 2017 - 2027
12.6.1. China
12.6.2. Japan
12.6.3. India
12.6.4. Rest of Asia Pacific
13. Middle East & Africa (MEA) Digital Transformation of Maritime Freight Analysis and Forecast
13.1. Key Findings
13.2. Digital Transformation of Maritime Freight Size (US$ Mn) Forecast, by Software, 2017 - 2027
13.2.1. Booking
13.2.1.1. E-service centers
13.2.1.2. Demand Forecasting
13.2.1.3. Dynamic Pricing
13.2.1.4. Customer Personalization
13.2.1.5. Payment Automation
13.2.2. Vessel Scheduling
13.2.2.1. ECDIS
13.2.2.2. Automated port calls
13.2.2.3. Loading/ Unloading
13.2.2.4. E bill of lading
13.2.2.5. Reefer Container Conditions Monitoring
13.2.2.6. Dynamic Capacity Allocation & Empty Container Repositioning
13.2.2.7. Gate Automation
13.2.3. Delivery
13.2.3.1. Predictive Maintenance
13.2.3.2. Vessel Machinery Monitoring
13.2.3.3. Truck Appointment System
13.3. Digital Transformation of Maritime Freight Size (US$ Mn) Forecast, by Deployment, 2017 - 2027
13.3.1. Cloud based
13.3.2. On-premise
13.4. Digital Transformation of Maritime Freight Size (US$ Mn) Forecast, By Services, 2017 - 2027
13.4.1. Consulting & Training
13.4.2. Implementation & Integration
13.4.3. Operation & Maintenance
13.4.4. Managed Services
13.5. Digital Transformation of Maritime Freight Size (US$ Mn) Forecast, By End-user, 2017 - 2027
13.5.1. Ports & Terminals
13.5.2. Maritime Freight Forwarders
13.6. Digital Transformation of Maritime Freight Size (US$ Mn) Forecast, by Country& Sub-region, 2017 - 2027
13.6.1. GCC
13.6.2. South Africa
13.6.3. Rest of MEA
14. South America Digital Transformation of Maritime Freight Analysis and Forecast
14.1. Key Findings
14.2. Digital Transformation of Maritime Freight Size (US$ Mn) Forecast, by Software, 2017 - 2027
14.2.1. Booking
14.2.1.1. E-service centers
14.2.1.2. Demand Forecasting
14.2.1.3. Dynamic Pricing
14.2.1.4. Customer Personalization
14.2.1.5. Payment Automation
14.2.2. Vessel Scheduling
14.2.2.1. ECDIS
14.2.2.2. Automated port calls
14.2.2.3. Loading/ Unloading
14.2.2.4. E bill of lading
14.2.2.5. Reefer Container Conditions Monitoring
14.2.2.6. Dynamic Capacity Allocation & Empty Container Repositioning
14.2.2.7. Gate Automation
14.2.3. Delivery
14.2.3.1. Predictive Maintenance
14.2.3.2. Vessel Machinery Monitoring
14.2.3.3. Truck Appointment System
14.3. Digital Transformation of Maritime Freight Size (US$ Mn) Forecast, by Deployment, 2017 - 2027
14.3.1. Cloud based
14.3.2. On-premise
14.4. Digital Transformation of Maritime Freight Size (US$ Mn) Forecast, By Services, 2017 - 2027
14.4.1. Consulting & Training
14.4.2. Implementation & Integration
14.4.3. Operation & Maintenance
14.4.4. Managed Services
14.5. Digital Transformation of Maritime Freight Size (US$ Mn) Forecast, By End-user, 2017 - 2027
14.5.1. Ports & Terminals
14.5.2. Maritime Freight Forwarders
14.6. Digital Transformation of Maritime Freight Size (US$ Mn) Forecast, by Country& Sub-region, 2017 - 2027
14.6.1. Brazil
14.6.2. Rest of South America
15. Competition Landscape
15.1. Market Player – Competition Matrix
15.2. Market Revenue Share Analysis (%), by Company (2018)
16. Company Profiles(Details – Business Overview, Sales Area/Geographical Presence, Revenue and Strategy)
16.1. 3GTMS, Inc.
16.1.1. Business Overview
16.1.2. Sales Area/Geographical Presence
16.1.3. Revenue and Strategy
16.2. 4 Flow AG
16.2.1. Business Overview
16.2.2. Sales Area/Geographical Presence
16.2.3. Revenue and Strategy
16.3. ABB Ltd
16.3.1. Business Overview
16.3.2. Sales Area/Geographical Presence
16.3.3. Revenue and Strategy
16.4. Advantech Co., Ltd.
16.4.1. Business Overview
16.4.2. Sales Area/Geographical Presence
16.4.3. Revenue and Strategy
16.5. Digital Logistics Group Ltd.
16.5.1. Business Overview
16.5.2. Sales Area/Geographical Presence
16.5.3. Revenue and Strategy
16.6. Hexaware Technologies
16.6.1. Business Overview
16.6.2. Sales Area/Geographical Presence
16.6.3. Revenue and Strategy
16.7. IBM Corporation
16.7.1. Business Overview
16.7.2. Sales Area/Geographical Presence
16.7.3. Revenue and Strategy
16.8. Kintetsu World Express, Inc. (KWE)
16.8.1. Business Overview
16.8.2. Sales Area/Geographical Presence
16.8.3. Revenue and Strategy
16.9. LOGITECH Corporation
16.9.1. Business Overview
16.9.2. Sales Area/Geographical Presence
16.9.3. Revenue and Strategy
16.10. Mindtree Ltd.
16.10.1. Business Overview
16.10.2. Sales Area/Geographical Presence
16.10.3. Revenue and Strategy
16.11. Oracle Corporation
16.11.1. Business Overview
16.11.2. Sales Area/Geographical Presence
16.11.3. Revenue and Strategy
16.12. PartnerTech
16.12.1. Business Overview
16.12.2. Sales Area/Geographical Presence
16.12.3. Revenue and Strategy
16.13. SAP SE
16.13.1. Business Overview
16.13.2. Sales Area/Geographical Presence
16.13.3. Revenue and Strategy
16.14. Syntel, Inc.
16.14.1. Business Overview
16.14.2. Sales Area/Geographical Presence
16.14.3. Revenue and Strategy
16.15. Tech Mahindra Limited
16.15.1. Business Overview
16.15.2. Sales Area/Geographical Presence
16.15.3. Revenue and Strategy
16.16. Key Takeaways
List of Tables
Table 1. List of New Players
Table 2. Alliances & Expansions in Content Moderation Solutions Market
Table 3. Global Digital Transformation of Maritime Freight Analysis and Forecast (US$ Mn), By Software Solutions, 2017 - 2027
Table 4. Global Digital Transformation of Maritime Freight Analysis and Forecast (US$ Mn), By Deployment, 2017 - 2027
Table 5. Global Digital Transformation of Maritime Freight Analysis and Forecast (US$ Mn), By Services, 2017 - 2027
Table 6. Global Digital Transformation of Maritime Freight Analysis and Forecast (US$ Mn), By End-user, 2017 - 2027
Table 7. Global Digital Transformation of Maritime Freight Analysis and Forecast (US$ Mn), By Region, 2017 - 2027
Table 8. North America Digital Transformation of Maritime Freight Analysis and Forecast (US$ Mn), By Software Solutions, 2017 - 2027
Table 9. North America Digital Transformation of Maritime Freight Analysis and Forecast (US$ Mn), By Deployment, 2017 - 2027
Table 10. North America Digital Transformation of Maritime Freight Analysis and Forecast (US$ Mn), By Services, 2017 - 2027
Table 11. North America Digital Transformation of Maritime Freight Analysis and Forecast (US$ Mn), By End-user, 2017 - 2027
Table 12. North America Digital Transformation of Maritime Freight Analysis and Forecast, By Country, 2017 - 2027
Table 13. Europe Digital Transformation of Maritime Freight Analysis and Forecast (US$ Mn), By Software Solutions, 2017 - 2027
Table 14. Europe Digital Transformation of Maritime Freight Analysis and Forecast (US$ Mn), By Deployment, 2017 - 2027
Table 15. Europe Digital Transformation of Maritime Freight Analysis and Forecast (US$ Mn), By Services, 2017 - 2027
Table 16. Europe Digital Transformation of Maritime Freight Analysis and Forecast (US$ Mn), By End-user, 2017 - 2027
Table 17. Europe Digital Transformation of Maritime Freight Analysis and Forecast, By Country, 2017 - 2027
Table 18. Asia Pacific Digital Transformation of Maritime Freight Analysis and Forecast (US$ Mn), By Software Solutions, 2017 - 2027
Table 19. Asia Pacific Digital Transformation of Maritime Freight Analysis and Forecast (US$ Mn), By Deployment, 2017 - 2027
Table 20. Asia Pacific Digital Transformation of Maritime Freight Analysis and Forecast (US$ Mn), By Services, 2017 - 2027
Table 21. Asia Pacific Digital Transformation of Maritime Freight Analysis and Forecast (US$ Mn), By End-user, 2017 - 2027
Table 22. Asia Pacific Digital Transformation of Maritime Freight Analysis and Forecast, By Country, 2017 - 2027
Table 23. MEA Digital Transformation of Maritime Freight Analysis and Forecast (US$ Mn), By Software Solutions, 2017 - 2027
Table 24. MEA Digital Transformation of Maritime Freight Analysis and Forecast (US$ Mn), By Deployment, 2017 - 2027
Table 25. MEA Digital Transformation of Maritime Freight Analysis and Forecast (US$ Mn), By Services, 2017 - 2027
Table 26. MEA Digital Transformation of Maritime Freight Analysis and Forecast (US$ Mn), By End-user, 2017 - 2027
Table 27. MEA Digital Transformation of Maritime Freight Analysis and Forecast, By Country, 2017 - 2027
Table 28. South America Digital Transformation of Maritime Freight Analysis and Forecast (US$ Mn), By Software Solutions, 2017 - 2027
Table 29. South America Digital Transformation of Maritime Freight Analysis and Forecast (US$ Mn), By Deployment, 2017 - 2027
Table 30. South America Digital Transformation of Maritime Freight Analysis and Forecast (US$ Mn), By Services, 2017 - 2027
Table 31. South America Digital Transformation of Maritime Freight Analysis and Forecast (US$ Mn), By End-user, 2017 - 2027
Table 32. South America Digital Transformation of Maritime Freight Analysis and Forecast, By Country, 2017 - 2027
List of Figures
Figure 1: Global Digital Transformation of Maritime Freight Market Size (US$ Mn) and Forecast, 2017–2027
Figure 2. World Seaborne Trade, by Region, 2017 (% Share in World Tonnage)
Figure 3. World Seaborne Trade in Cargo (Ton-Miles), 2013–2018
Figure 4. World Container Port Throughput (Mn TEU), 2013–2018
Figure 5. Adoption Analysis of Logistics Control Towers, 2015 & 2025
Figure 6. Adoption Analysis of Analytics as a Service in Logistics, 2015 & 2025
Figure 7. Digital Transformation of Maritime Freight Analysis, by Software Solutions (2019)
Figure 8. Digital Transformation of Maritime Freight Analysis, by Deployment (2019)
Figure 9. Digital Transformation of Maritime Freight Analysis, by Services (2019)
Figure 10. Digital Transformation of Maritime Freight Analysis, by End-user (2019)
Figure 11. Digital Transformation of Maritime Freight Analysis, by Region (2019)
Figure 12. Historic Growth Trends, 2012-2018
Figure 13. Forecast Trends, 2019-2027
Figure 14. Global Digital Transformation of Maritime Freight Share Analysis, by Software Solutions (2019)
Figure 15. Global Digital Transformation of Maritime Freight Share Analysis, by Software Solutions (2027)
Figure 16. Global Digital Transformation of Maritime Freight Share Analysis, by Deployment (2019)
Figure 17. Global Digital Transformation of Maritime Freight Share Analysis, by Deployment (2027)
Figure 18. Global Digital Transformation of Maritime Freight Share Analysis, by Services (2019)
Figure 19. Global Digital Transformation of Maritime Freight Share Analysis, by Services (2027)
Figure 20. Global Digital Transformation of Maritime Freight Share Analysis, by End-user (2019)
Figure 21. Global Digital Transformation of Maritime Freight Share Analysis, by End-user (2027)
Figure 22. Global Digital Transformation of Maritime Freight Share Analysis, by Region (2019)
Figure 23. Global Digital Transformation of Maritime Freight Share Analysis, by Region (2027)
Figure 24. North America Digital Transformation of Maritime Freight Share Analysis, by Software Solutions (2019)
Figure 25. North America Digital Transformation of Maritime Freight Share Analysis, by Software Solutions (2027)
Figure 26. North America Digital Transformation of Maritime Freight Share Analysis, by Deployment (2019)
Figure 27. North America Digital Transformation of Maritime Freight Share Analysis, by Deployment (2027)
Figure 28. North America Digital Transformation of Maritime Freight Share Analysis, by Services (2019)
Figure 29. North America Digital Transformation of Maritime Freight Share Analysis, by Services (2027)
Figure 30. North America Digital Transformation of Maritime Freight Share Analysis, by End-user (2019)
Figure 31. North America Digital Transformation of Maritime Freight Share Analysis, by End-user (2027)
Figure 32. North America Digital Transformation of Maritime Freight Share Analysis, by Country (2019)
Figure 33. North America Digital Transformation of Maritime Freight Share Analysis, by Country (2027)
Figure 34. Europe Digital Transformation of Maritime Freight Share Analysis, by Software Solutions (2019)
Figure 35. Europe Digital Transformation of Maritime Freight Share Analysis, by Software Solutions (2027)
Figure 36. Europe Digital Transformation of Maritime Freight Share Analysis, by Deployment (2019)
Figure 37. Europe Digital Transformation of Maritime Freight Share Analysis, by Deployment (2027)
Figure 38. Europe Digital Transformation of Maritime Freight Share Analysis, by Services (2019)
Figure 39. Europe Digital Transformation of Maritime Freight Share Analysis, by Services (2027)
Figure 40. Europe Digital Transformation of Maritime Freight Share Analysis, by End-user (2019)
Figure 41. Europe Digital Transformation of Maritime Freight Share Analysis, by End-user (2027)
Figure 42. Europe Digital Transformation of Maritime Freight Share Analysis, by Country (2019)
Figure 43. Europe Digital Transformation of Maritime Freight Share Analysis, by Country (2027)
Figure 44. Asia Pacific Digital Transformation of Maritime Freight Share Analysis, by Software Solutions (2019)
Figure 45. Asia Pacific Digital Transformation of Maritime Freight Share Analysis, by Software Solutions (2027)
Figure 46. Asia Pacific Digital Transformation of Maritime Freight Share Analysis, by Deployment (2019)
Figure 47. Asia Pacific Digital Transformation of Maritime Freight Share Analysis, by Deployment (2027)
Figure 48. Asia Pacific Digital Transformation of Maritime Freight Share Analysis, by Services (2019)
Figure 49. Asia Pacific Digital Transformation of Maritime Freight Share Analysis, by Services (2027)
Figure 50. Asia Pacific Digital Transformation of Maritime Freight Share Analysis, by End-user (2019)
Figure 51. Asia Pacific Digital Transformation of Maritime Freight Share Analysis, by End-user (2027)
Figure 52. Asia Pacific Digital Transformation of Maritime Freight Share Analysis, by Country (2019)
Figure 53. Asia Pacific Digital Transformation of Maritime Freight Share Analysis, by Country (2027)
Figure 54. MEA Digital Transformation of Maritime Freight Share Analysis, by Software Solutions (2019)
Figure 55. MEA Digital Transformation of Maritime Freight Share Analysis, by Software Solutions (2027)
Figure 56. MEA Digital Transformation of Maritime Freight Share Analysis, by Deployment (2019)
Figure 57. MEA Digital Transformation of Maritime Freight Share Analysis, by Deployment (2027)
Figure 58. MEA Digital Transformation of Maritime Freight Share Analysis, by Services (2019)
Figure 59. MEA Digital Transformation of Maritime Freight Share Analysis, by Services (2027)
Figure 60. MEA Digital Transformation of Maritime Freight Share Analysis, by End-user (2019)
Figure 61. MEA Digital Transformation of Maritime Freight Share Analysis, by End-user (2027)
Figure 62. MEA Digital Transformation of Maritime Freight Share Analysis, by Country (2019)
Figure 63. MEA Digital Transformation of Maritime Freight Share Analysis, by Country (2027)
Figure 64. South America Digital Transformation of Maritime Freight Share Analysis, by Software Solutions (2019)
Figure 65. South America Digital Transformation of Maritime Freight Share Analysis, by Software Solutions (2027)
Figure 66. South America Digital Transformation of Maritime Freight Share Analysis, by Deployment (2019)
Figure 67. South America Digital Transformation of Maritime Freight Share Analysis, by Deployment (2027)
Figure 68. South America Digital Transformation of Maritime Freight Share Analysis, by Services (2019)
Figure 69. South America Digital Transformation of Maritime Freight Share Analysis, by Services (2027)
Figure 70. South America Digital Transformation of Maritime Freight Share Analysis, by End-user (2019)
Figure 71. South America Digital Transformation of Maritime Freight Share Analysis, by End-user (2027)
Figure 72. South America Digital Transformation of Maritime Freight Share Analysis, by Country (2019)
Figure 73. South America Digital Transformation of Maritime Freight Share Analysis, by Country (2027)
Copyright © Transparency Market Research, Inc. All Rights reserved
Trust Online

Digital Transformation of Maritime Freight Market