
Reports
Reports
Corporate Heritage Data Management Market: Snapshot
The global market for corporate heritage data management solutions is experiencing significant growth in demand from a number of industry verticals. Demand for essential historical/heritage in an organized manner is the driving force of the market. Companies have started realizing the benefits of heritage data for marketing and brand development activities. Increased spending on marketing and related activities is anticipated to drive the corporate heritage data management market.
Transparency Market Research estimates that the global corporate heritage data management market will rise to a valuation of US$834.6 mn by 2024, from US$175.2 mn in 2015. The market is estimated to expand at a remarkable CAGR of 19.1% during the forecast period from 2016 to 2024.
Digital Asset Management Solutions Witness High Adoption Levels
Among the solutions used for corporate heritage data management, digital asset management (DAM) held the largest market share of approximately 66% in 2015, as digital asset management provides an all-inclusive system for achieving corporate heritage data management. It provides a logical hierarchy for all the digital data within the enterprise. Data can be organized according to various parameters which can be manually selected. Furthermore, digital asset management provides advanced security features such as authorized permissions to data and features. It helps in limiting the exposure of intellectual property owned by enterprises. Full lifecycle support helps in moving the content within different applications and manage the workflow.
The segment of digital asset management is expected to retain its dominance in the global corporate heritage data management market throughout the forecast period as well, and account for a nearly 67% of the global market by 2024. The segment of data collection management (DCM) solutions holds a much lesser share in the global market as compared to the segment of DAM solutions, however, both the segments are anticipated to experience similar growth during the forecast period.
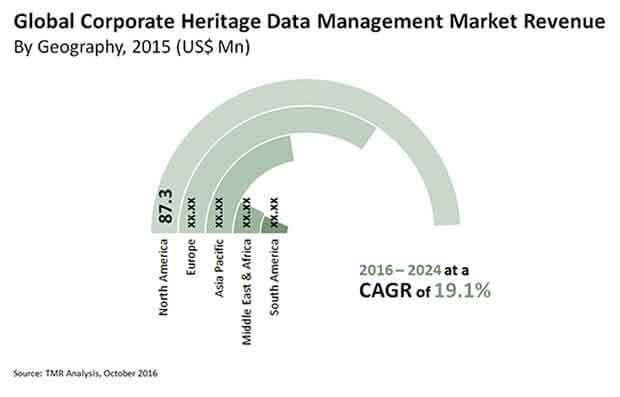
North America to Continue to Dominate Market but Lose to Asia Pacific in Terms of Growth Rate
In 2015, North America was the dominant market for corporate heritage data management as demand across the retail and manufacturing sectors experienced high adoption of sophisticated heritage data management solutions for effective organization of historic data. The use of heritage data management solutions across automobile companies for using historic data such as profiles of old models and manufacturing facilities also substantially increased in the region in the past few years. The continuous rise in demand for advanced heritage data management solutions across numerous industries is expected to allow North America to retain its dominance in the global market in the next few years as well.
However, due to the growing needs from the media and entertainment and telecom and IT sectors, Asia Pacific is anticipated to outpace North America and Europe, the latter of which presently holds the second position in the global market, over the forecast period. The region is expected to exhibit a CAGR of 21.3% from 2016 through 2024. The Asia Pacific heritage data management market is expected to gain tremendous growth opportunities from the flourishing telecom and IT sectors.
The market presently features a rather small number of established vendors. As such, the competition is moderate. However, the high growth prospects of the market are expected to attract many new vendors, making the market more competitive. Some of the key players operating in the corporate heritage data management market are North Plains Systems Corp., Open Text Corporation, Widen Enterprises, Inc., NetXposure, Inc., MediaBeacon, Inc., Eloquent Systems, Inc., CultureArk, GruppoMeta, Extensis, Inc., Arkivum Ltd., Media Equation Pty Ltd., Heritage Werks, Inc. and FINNZ.
1. Preface
1.1. Market Definition and Scope
1.2. Market Segmentation
1.3. Key Research Objectives
1.4. Research Highlights
2. Assumptions and Research Methodology
3. Executive Summary: Global Corporate Heritage Data/Asset Management Solution Market
4. Market Overview
4.1. Introduction
4.1.1. Product Definition
4.1.2. Industry Evolution / Developments
4.2. Market Dynamics
4.2.1. Drivers
4.2.2. Restraints
4.2.3. Opportunity
4.3. Global Corporate Heritage Data/Asset Management Solution Market Analysis and Forecasts, 2014 –2024
4.3.1. Market Revenue Projections (US$ Mn)
4.4. Porter’s Five Force Analysis
4.5. Policies and Regulations
4.6. Ecosystem Analysis: Global Corporate Heritage Data/Asset Management Solution Analysis
4.7. Market Outlook
5. Global Corporate Heritage Data/Asset Management Solution Market Analysis and Forecast
5.1. Key Findings
5.2. Key Trends
5.3. Market Size (US$ Mn) Forecast, by Solution
5.3.1. Digital Asset Management (DAM), 2014 – 2024 (US$ Mn)
5.3.2. Digital Collection Management, 2014 – 2024 (US$ Mn)
5.3.3. Others, 2014 – 2024 (US$ Mn)
5.4. Market Attractiveness Analysis, by Solution
6. Global Corporate Heritage Data/Asset Management Solution Market Analysis and Forecast
6.1. Key Findings
6.2. Key Trends
6.3. Market Size (US$ Mn) Forecast, by End-use
6.3.1. BFSI, 2014 – 2024 (US$ Mn)
6.3.2. Telecom and IT, 2014 – 2024 (US$ Mn)
6.3.3. Retail, 2014 – 2024 (US$ Mn)
6.3.4. Government, 2014 – 2024 (US$ Mn)
6.3.5. Museums and Art, 2014 – 2024 (US$ Mn)
6.3.6. Health Care, 2014 – 2024 (US$ Mn)
6.3.7. Education, 2014 – 2024 (US$ Mn)
6.3.8. Media and Entertainment, 2014 – 2024 (US$ Mn)
6.3.9. Non-profit Organization, 2014 – 2024 (US$ Mn)
6.3.10. Hospitality, 2014 – 2024 (US$ Mn)
6.3.11. Others, 2014 – 2024 (US$ Mn)
6.4. Market Attractiveness Analysis, by End-use
7. Global Corporate Heritage Data/Asset Management Solution Market Analysis and Forecast, by Region
7.1. Key Findings
7.2. Key Trends
7.3. Market Size (US$ Mn) Forecast, by Region
7.3.1. North America, 2014 – 2024 (US$ Mn)
7.3.2. Europe, 2014 – 2024 (US$ Mn)
7.3.3. Asia Pacific, 2014 – 2024 (US$ Mn)
7.3.4. Middle East and Africa, 2014 – 2024 (US$ Mn)
7.3.5. South America, 2014 – 2024 (US$ Mn)
7.4. Market Attractiveness Analysis, by Region
8. North America Corporate Heritage Data/Asset Management Solution Market Analysis and Forecast
8.1. Key Findings
8.2. Policies and Regulations
8.3. Key Trends
8.4. Market Size (US$ Mn) Forecast, by Solution
8.4.1. Digital Asset Management (DAM), 2014 – 2024 (US$ Mn)
8.4.2. Digital Collection Management, 2014 – 2024 (US$ Mn)
8.4.3. Others, 2014 – 2024 (US$ Mn)
8.5. Market Size (US$ Mn) Forecast, by End-use
8.5.1. BFSI, 2014 – 2024 (US$ Mn)
8.5.2. Telecom and IT, 2014 – 2024 (US$ Mn)
8.5.3. Retail, 2014 – 2024 (US$ Mn)
8.5.4. Government, 2014 – 2024 (US$ Mn)
8.5.5. Museums and Art, 2014 – 2024 (US$ Mn)
8.5.6. Health Care, 2014 – 2024 (US$ Mn)
8.5.7. Education, 2014 – 2024 (US$ Mn)
8.5.8. Media and Entertainment, 2014 – 2024 (US$ Mn)
8.5.9. Non-profit Organization, 2014 – 2024 (US$ Mn)
8.5.10. Hospitality, 2014 – 2024 (US$ Mn)
8.5.11. Others, 2014 – 2024 (US$ Mn)
8.6. Market Size (US$ Mn) Forecast, by Country
8.6.1. The U.S., 2014 – 2024 (US$ Mn)
8.6.2. Canada, 2014 – 2024 (US$ Mn)
8.6.3. Rest of North America, 2014 – 2024 (US$ Mn)
8.7. Market Attractiveness Analysis
8.7.1. By Country
8.7.2. By Solution
8.7.3. By End-use
9. Europe Corporate Heritage Data/Asset Management Solution Market Analysis and Forecast
9.1. Key Findings
9.2. Policies and Regulations
9.3. Key Trends
9.4. Market Size (US$ Mn) Forecast, by Solution
9.4.1. Digital Asset Management (DAM), 2014 – 2024 (US$ Mn)
9.4.2. Digital Collection Management, 2014 – 2024 (US$ Mn)
9.4.3. Others, 2014 – 2024 (US$ Mn)
9.5. Market Size (US$ Mn) Forecast, by End-use
9.5.1. BFSI, 2014 – 2024 (US$ Mn)
9.5.2. Telecom and IT, 2014 – 2024 (US$ Mn)
9.5.3. Retail, 2014 – 2024 (US$ Mn)
9.5.4. Government, 2014 – 2024 (US$ Mn)
9.5.5. Museums and Art, 2014 – 2024 (US$ Mn)
9.5.6. Health Care, 2014 – 2024 (US$ Mn)
9.5.7. Education, 2014 – 2024 (US$ Mn)
9.5.8. Media and Entertainment, 2014 – 2024 (US$ Mn)
9.5.9. Non-profit Organization, 2014 – 2024 (US$ Mn)
9.5.10. Hospitality, 2014 – 2024 (US$ Mn)
9.5.11. Others, 2014 – 2024 (US$ Mn)
9.6. Market Size (US$ Mn) Forecast, by Country
9.6.1. The U.K., 2014 – 2024 (US$ Mn)
9.6.2. Germany, 2014 – 2024 (US$ Mn)
9.6.3. France, 2014 – 2024 (US$ Mn)
9.6.4. Spain, 2014 – 2024 (US$ Mn)
9.6.5. Italy, 2014 – 2024 (US$ Mn)
9.6.6. Rest of Europe, 2014 – 2024 (US$ Mn)
9.7. Market Attractiveness Analysis
9.7.1. By Country
9.7.2. By Solution
9.7.3. By End-use
10. Asia Pacific Corporate Heritage Data/Asset Management Solution Market Analysis and Forecast
10.1. Key Findings
10.2. Policies and Regulations
10.3. Key Trends
10.4. Market Size (US$ Mn) Forecast, by Solution
10.4.1. Digital Asset Management (DAM), 2014 – 2024 (US$ Mn)
10.4.2. Digital Collection Management, 2014 – 2024 (US$ Mn)
10.4.3. Others, 2014 – 2024 (US$ Mn)
10.5. Market Size (US$ Mn) Forecast, by End-use
10.5.1. BFSI, 2014 – 2024 (US$ Mn)
10.5.2. Telecom and IT, 2014 – 2024 (US$ Mn)
10.5.3. Retail, 2014 – 2024 (US$ Mn)
10.5.4. Government, 2014 – 2024 (US$ Mn)
10.5.5. Museums and Art, 2014 – 2024 (US$ Mn)
10.5.6. Health Care, 2014 – 2024 (US$ Mn)
10.5.7. Education, 2014 – 2024 (US$ Mn)
10.5.8. Media and Entertainment, 2014 – 2024 (US$ Mn)
10.5.9. Non-profit Organization, 2014 – 2024 (US$ Mn)
10.5.10. Hospitality, 2014 – 2024 (US$ Mn)
10.5.11. Others, 2014 – 2024 (US$ Mn)
10.6. Market Size (US$ Mn) Forecast, by Country
10.6.1. China, 2014 – 2024 (US$ Mn)
10.6.2. Japan, 2014 – 2024 (US$ Mn)
10.6.3. India, 2014 – 2024 (US$ Mn)
10.6.4. Philippines, 2014 – 2024 (US$ Mn)
10.6.5. Rest of Asia Pacific, 2014 – 2024 (US$ Mn)
10.7. Market Attractiveness Analysis
10.7.1. By Country
10.7.2. By Solution
10.7.3. By End-use
11. Middle East and Africa (MEA) Corporate Heritage Data/Asset Management Solution Market Analysis and Forecast
11.1. Key Findings
11.2. Policies and Regulations
11.3. Key Trends
11.3. Market Size (US$ Mn) Forecast, by Solution
11.3.1. Digital Asset Management (DAM), 2014 – 2024 (US$ Mn)
11.3.2. Digital Collection Management, 2014 – 2024 (US$ Mn)
11.3.3. Others, 2014 – 2024 (US$ Mn)
11.4. Market Size (US$ Mn) Forecast, by End-use
11.4.1. BFSI, 2014 – 2024 (US$ Mn)
11.4.2. Telecom and IT, 2014 – 2024(US$ Mn)
11.4.3. Retail, 2014 – 2024 (US$ Mn)
11.4.4. Government, 2014 – 2024 (US$ Mn)
11.4.5. Museums and Art, 2014 – 2024 (US$ Mn)
11.4.6. Health Care, 2014 – 2024 (US$ Mn)
11.4.7. Education, 2014 – 2024 (US$ Mn)
11.4.8. Media and Entertainment, 2014 – 2024 (US$ Mn)
11.4.9. Non-profit Organization, 2014 – 2024 (US$ Mn)
11.4.10. Hospitality, 2014 – 2024 (US$ Mn)
11.4.11. Others, 2014 – 2024 (US$ Mn)
11.5. Market Size (US$ Mn) Forecast, by Country
11.5.1. UAE, 2014 – 2024 (US$ Mn)
11.5.2. Saudi Arabia, 2014 – 2024 (US$ Mn)
11.5.3. South Africa, 2014 – 2024 (US$ Mn)
11.5.4. Rest of MEA, 2014 – 2024 (US$ Mn)
11.6. Market Attractiveness Analysis
11.6.1. By Country
11.6.2. By Solution
11.6.3. By End-use
12. South America Corporate Heritage Data/Asset Management Solution Market Analysis and Forecast
12.1. Key Findings
12.2. Policies and Regulations
12.3. Key Trends
12.3. Market Size (US$ Mn) Forecast, by Solution
12.3.1. Digital Asset Management (DAM), 2014 – 2024 (US$ Mn)
12.3.2. Digital Collection Management, 2014 – 2024 (US$ Mn)
12.3.3. Others, 2014 – 2024 (US$ Mn)
12.4. Market Size (US$ Mn) Forecast, by End-use
12.4.1. BFSI, 2014 – 2024 (US$ Mn)
12.4.2. Telecom and IT, 2014 – 2024 (US$ Mn)
12.4.3. Retail, 2014 – 2024 (US$ Mn)
12.4.4. Government, 2014 – 2024 (US$ Mn)
12.4.5. Museums and Art, 2014 – 2024 (US$ Mn)
12.4.6. Health Care, 2014 – 2024 (US$ Mn)
12.4.7. Education, 2014 – 2024 (US$ Mn)
12.4.8. Media and Entertainment, 2014 – 2024 (US$ Mn)
12.4.9. Non-profit Organization, 2014 – 2024 (US$ Mn)
12.4.10. Hospitality, 2014 – 2024 (US$ Mn)
12.4.11. Others, 2014 – 2024 (US$ Mn)
12.5. Market Size (US$ Mn) Forecast, by Country
12.5.1. Brazil, 2014 – 2024 (US$ Mn)
12.5.2. Rest of South America, 2014 – 2024 (US$ Mn)
12.6. Market Attractiveness Analysis
12.6.1. By Country
12.6.2. By Solution
12.6.3. By End-use
13. Competition Landscape
13.1. Market Player – Competition Matrix (By Tier and Size of companies)
13.2. Market Share Analysis, by Company (2015)
13.3. Company Profiles (Details – Overview, Financials, SWOT Analysis, Recent Developments, Strategy)
13.3.1. North Plains Systems Corp.
13.3.1.1. Company Details and Description (HQ, Foundation Year, Revenue, Employee Strength)
13.3.1.2. Business Overview
13.3.1.3. SWOT Analysis
13.3.1.4. Strategic Overview
13.3.2. Open Text Corporation
13.3.2.1. Company Details and Description (HQ, Foundation Year, Revenue, Employee Strength)
13.3.2.2. Business Overview
13.3.2.3. SWOT Analysis
13.3.2.4. Strategic Overview
13.3.3. Widen Enterprises, Inc.
13.3.3.1. Company Details and Description (HQ, Foundation Year, Employee Strength)
13.3.3.2. Business Overview
13.3.3.3. SWOT Analysis
13.3.3.4. Strategic Overview
13.3.4. NetXposure, Inc.
13.3.4.1. Company Details and Description (HQ, Foundation Year, Revenue, Employee Strength)
13.3.4.2. Business Overview
13.3.4.3. SWOT Analysis
13.3.4.4. Strategic Overview
13.3.5. MediaBeacon, Inc.
13.3.5.1. Company Details and Description (HQ, Foundation Year, Revenue, Employee Strength)
13.3.5.2. Business Overview
13.3.5.3. SWOT Analysis
13.3.5.4. Strategic Overview
13.3.6. Eloquent Systems, Inc.
13.3.6.1. Company Details and Description (HQ, Foundation Year, Revenue, Employee Strength)
13.3.6.2. Business Overview
13.3.6.3. SWOT Analysis
13.3.6.4. Strategic Overview
13.3.7. CultureArk
13.3.7.1. Company Details and Description (HQ, Foundation Year, Employee Strength)
13.3.7.2. Business Overview
13.3.7.3. SWOT Analysis
13.3.7.4. Strategic Overview
13.3.8. GruppoMeta
13.3.8.1. Company Details and Description (HQ, Foundation Year, Employee Strength)
13.3.8.2. Business Overview
13.3.8.3. SWOT Analysis
13.3.8.4. Strategic Overview
13.3.9. Extensis, Inc.
13.3.9.1. Company Details and Description (HQ, Foundation Year, Employee Strength)
13.3.9.2. Business Overview
13.3.9.3. SWOT Analysis
13.3.9.4. Strategic Overview
13.3.10. Arkivum Ltd.
13.3.10.1. Company Details and Description (HQ, Foundation Year, Employee Strength)
13.3.10.2. Business Overview
13.3.10.3. SWOT Analysis
13.3.10.4. Strategic Overview
13.3.11. Media Equation Pty Ltd.
13.3.11.1. Company Details and Description (HQ, Foundation Year, Revenue, Employee Strength)
13.3.11.2. Business Overview
13.3.11.3. SWOT Analysis
13.3.11.4. Strategic Overview
13.3.12. Heritage Werks, Inc.
13.3.12.1. Company Details and Description (HQ, Foundation Year, Employee Strength)
13.3.12.2. Business Overview
13.3.12.3. SWOT Analysis
13.3.12.4. Strategic Overview
13.3.13. FINNZ
13.3.13.1. Company Details and Description (HQ, Foundation Year, Employee Strength)
13.3.13.2. Business Overview
13.3.13.3. SWOT Analysis
13.3.13.4. Strategic Overview
14. Key Take Away
List of Tables
Table 1: Global Corporate Heritage Data Management Market Size (US$ Mn) Forecast, By Solution, 2014 – 2024
Table 2: Global Corporate Heritage Data Management Market Size (US$ Mn) Forecast, By Application, 2014 – 2024
Table 3: Global Corporate Heritage Data Management Market Size (US$ Mn) Forecast, By Region, 2014 – 2024
Table 4: North America Corporate Heritage Data Management Market Size (US$ Mn) Forecast, By Solution, 2014 – 2024
Table 5: North America Corporate Heritage Data Management Market Size (US$ Mn) Forecast, By Application, 2014 – 2024
Table 6: North America Corporate Heritage Data Management Market Size (US$ Mn) Forecast, By Country, 2014 – 2024
Table 7: Europe Corporate Heritage Data Management Market Size (US$ Mn) Forecast, By Solution, 2014 – 2024
Table 8: Europe Corporate Heritage Data Management Market Size (US$ Mn) Forecast, By Application, 2014 – 2024
Table 9: Europe Corporate Heritage Data Management Market Size (US$ Mn) Forecast, By Country, 2014 – 2024
Table 10: Asia Pacific Corporate Heritage Data Management Market Size (US$ Mn) Forecast, By Solution, 2014 – 2024
Table 11: Asia Pacific Corporate Heritage Data Management Market Size (US$ Mn) Forecast, By Application, 2014 – 2024
Table 12: Asia Pacific Corporate Heritage Data Management Market Size (US$ Mn) Forecast, By Country, 2014 – 2024
Table 13: MEA Corporate Heritage Data Management Market Size (US$ Mn) Forecast, By Solution, 2014 – 2024
Table 14: MEA Corporate Heritage Data Management Market Size (US$ Mn) Forecast, By Application, 2014 – 2024
Table 15: MEA Corporate Heritage Data Management Market Size (US$ Mn) Forecast, By Country, 2014 – 2024
Table 16: South America Corporate Heritage Data Management Market Size (US$ Mn) Forecast, By Solution, 2014 – 2024
Table 17: South America Corporate Heritage Data Management Market Size (US$ Mn) Forecast, By Application, 2014 – 2024
Table 18: South America Corporate Heritage Data Management Market Size (US$ Mn) Forecast, By Country, 2014 – 2024
Table 19: Global Corporate Heritage Data Management Market Share Analysis (2015)
List of Figures
Figure 1: Global Corporate Heritage Data Management Market, Revenue 2014 – 2024 (US$)
Figure 2: Porter’s Five Forces Analysis
Figure 3: Ecosystem Analysis
Figure 4: Market Value Share By Solution (2016)
Figure 5: Market Value Share By Application (Top 6) (2016)
Figure 6: Market Revenue Share By Geography (2016)
Figure 7: Global Corporate Heritage Data Management Market Value Share Analysis, By Solution, 2016 and 2024
Figure 8: Global Corporate Heritage Data Management Market, Attractiveness Analysis, by Solution (2015)
Figure 9: Global Corporate Heritage Data Management Market Value Share Analysis, By Application, 2016 and 2024
Figure 10: Global Corporate Heritage Data Management Market, Attractiveness Analysis, by Application (Top Six) (2015)
Figure 11: Corporate Heritage Data Management Market CAGR (2016 – 2024) Analysis, By Country
Figure 12: Global Corporate Heritage Data Management Market, Attractiveness Analysis, by Region (2015)
Figure 13: North America Corporate Heritage Data Management Market Size (US$ Mn) Forecast, 2014 – 2024
Figure 14: North America Corporate Heritage Data Management Market Size Y-o-Y Growth Projection, 2014 – 2024
Figure 15: North American Corporate Heritage Data Management Market Value Share Analysis, By Solution, 2016 and 2024
Figure 16: North America Corporate Heritage Data Management Market Value Share Analysis, By Application, 2016 and 2024
Figure 17: North America Corporate Heritage Data Management Market Value Share Analysis, By Country, 2016 and 2024
Figure 18: By Country (2015)
Figure 19: By Solution (2015)
Figure 20: By Application (2015)
Figure 21: Europe Corporate Heritage Data Management Market Size (US$ Mn) Forecast, 2014 – 2024
Figure 22: Europe Corporate Heritage Data Management Market Size
Figure 23: Europe Corporate Heritage Data Management Market Value Share Analysis, By Solution, 2016 and 2024
Figure 24: Europe Corporate Heritage Data Management Market Value Share Analysis, By Application, 2016 and 2024
Figure 25: Europe Corporate Heritage Data Management Market Value Share Analysis, By Country, 2016 and 2024
Figure 26: By Country (2015)
Figure 27: By Solution (2015)
Figure 28: By Application (2015)
Figure 29: Asia Pacific Corporate Heritage Data Management Market Size (US$ Mn) Forecast, 2014 – 2024
Figure 30: Asia Pacific Corporate Heritage Data Management Market Size Y-o-Y Growth Projection, 2014 – 2024
Figure 31: Asia Pacific Corporate Heritage Data Management Market Value Share Analysis, By Solution, 2016 and 2024
Figure 32: Asia Pacific Corporate Heritage Data Management Market Value Share Analysis, By Application, 2016 and 2024
Figure 33: Asia Pacific Corporate Heritage Data Management Market Value Share Analysis, By Country, 2016 and 2024
Figure 34: By Country (2015)
Figure 35: By Solution (2015)
Figure 36: By Application (2015)
Figure 37: MEA Corporate Heritage Data Management Market Size (US$ Mn) Forecast, 2014 – 2024
Figure 38: MEA Corporate Heritage Data Management Market Size
Figure 39: MEA Corporate Heritage Data Management Market Value Share Analysis, By Solution, 2016 and 2024
Figure 40: MEA Corporate Heritage Data Management Market Value Share Analysis, By Application, 2016 and 2024
Figure 41: MEA Corporate Heritage Data Management Market Value Share Analysis, By Country, 2016 and 2024
Figure 42: By Country (2015)
Figure 43: By Solution (2015)
Figure 44: By Application (2015)
Figure 45: South America Corporate Heritage Data Management Market Size (US$ Mn) Forecast, 2014 – 2024
Figure 46: South America Corporate Heritage Data Management Market Size Y-o-Y Growth Projection, 2014 – 2024
Figure 47: South American Corporate Heritage Data Management Market Value Share Analysis, By Solution, 2016 and 2024
Figure 48: South America Corporate Heritage Data Management Market Value Share Analysis, By Application, 2016 and 2024
Figure 49: South America Corporate Heritage Data Management Market Value Share Analysis, By Country, 2016 and 2024
Figure 50: By Country (2015)
Figure 51: By Solution (2015)
Figure 52: By Application (2015)
Copyright © Transparency Market Research, Inc. All Rights reserved
Trust Online

Corporate Heritage Data Management Market