
Reports
Reports
The growth of the global cool roofs market can be ascribed to many factors such as expansion of the construction industry, which is gaining considerable traction due to increase in number of green building projects. Favorable aspects like rapid urbanization and flexibility in trade transactions will have a positive impact on the growth of the cool roofs market. The infrastructural growth due to rapid urbanization across the globe is a key growth factor for the cool roofs market.
Cool roofs promote green technology, which is an essential part of the construction industry. Cool roofs are preferred because of their property of absorbing heat. They regulate overheating issues. They absorb less heat and reflect more light. They are cost-effective as they decrease the need of air conditioners resulting in reduction in electricity bills. The life of the roofs increases due to low temperature. Cool roofs not only provide comfort but also help in conservation of energy. They decrease air temperature and reduce the emission of hazardous gases like carbon dioxide. All these factors contribute towards generating demand for products from the cool roofs market.
Cool roofs play a vital role in agricultural sector, as they trap sunlight without emitting heat. This helps in retaining the nutritional value of crops. Thus, cool roofing systems are gradually replacing conventional roofing systems, eventually increasing the growth rate of the market.
The key drivers of global roof markets are demand for energy efficient and eco-friendly roofing systems, booming construction industry, and government subsidies and tax benefits. The cool roof market looks promising because of rapid urbanization, population growth, and increase in disposable income. There is a substantial rise in demand for low cost and green roofing materials, this has accelerated the cool roofs market.
Global Cool Roofs Market- Snapshot
The demand within the global cool roofs market is set to increase by leaps and bounds in the times to follow. The use of these roofs across the residential sector has grown as people prefer to develop penthouses in their close vicinities. The development of these penthouses at the top of the buildings has prompted designers and architects to experiment with new designs and models. This has brought cool roof designs under the spotlight of attention as innovation takes an upper hand in the domain of civil and architectural designing. Henceforth, the global cool roofs market is slated to expand at a seamless pace in the years to follow. The presence of an ever-evolving construction and civil planning industries shall unlock new growth opportunities across the global cool roofs market.
It is safe to state that cool roofs are fast replacing traditional systems and technologies used for exposing plants to controlled sunlight. Therefore, the value of the global cool roofs market is set to multiply in the times to follow.
Cool Roofs Market - Snapshot
A building's roof provides shelter from natural elements. Various roofing materials are used in buildings. These include asphalt, modified bitumen, metal, and tiles. Rooftops have become major source of excessive heat. The usage of cool roofing systems is an effective strategy to overcome heat issues. Cool roofs are designed to reflect sunlight and absorb less heat than standard roofs. There are many different combinations of roofing systems; the one exposed to the sun regulates the overall temperature. Cool roof systems can be employed to lower the temperature or replace the existing roof materials by reflective materials.
Rise in demand for energy-efficient and eco-friendly roofing systems, expansion in the construction industry, and government subsidies and tax benefits are key factors driving the global cool roofs market. The cool roofs market in Asia Pacific has been expanding due to the rapid urbanization, growth in population, and increase in disposable income of middle-class families in the regions. The outlook for the market in Asia Pacific appears promising.
Significant expansion in the construction industry and increase in usage of eco-friendly cool roofs in end-use industries are major factors boosting the cool roofs market. Decrease in energy consumption and increase in roof longevity are anticipated to propel the demand for cool roofs in the near future. Growth in residential and commercial industries in developing economies is another factor estimated to augment the cool roofs market during the forecast period.
Less awareness among customers about benefits of cool roof is hampering the market. However, new projects and initiatives have been started by governments to promote the usage of cool roofs. Furthermore, rise in demand for environmentally-friendly roofing systems is anticipated to create significant opportunities for the cool roofs market.
The global cool roofs market has been segmented based on roof slope, roof type, and application. In terms of roof slope, the market has been be bifurcated into steep slope roofs and low slope roofs. Low slope roofs was the dominant segment with more than 60% share of the market in 2017. In terms of roof type, the cool roofs market has been classified into coated roofs, single-ply membranes, tiles & slates, foam roofs, modified bitumen & built-up roofing systems, asphalt shingles, metal roofs, and others (including wood shake, clay, and concrete). Single-ply membranes was the dominant segment, accounting for about 30% share of the market share in 2017. These membranes are widely employed in low sloped roofs that require extensive repairs. The modified bitumen & built-up roofing systems segment is expected to expand significantly in the near future, due to the increase in demand for durable roofing materials. Metal roofs and coated roofs segments are also gaining momentum in the cool roofs market owing to the rise in demand for low cost and green roofing materials.
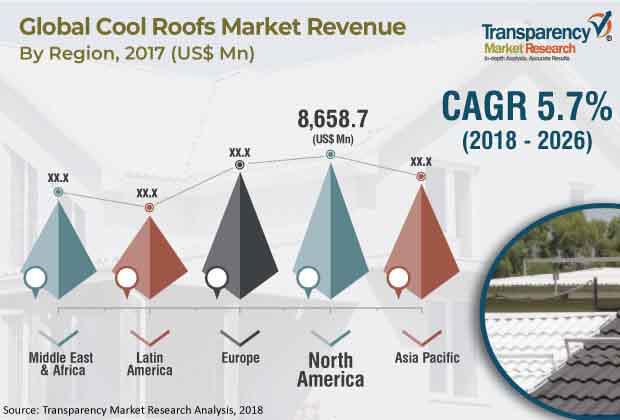
Based on application, the global cool roofs market has been segregated into residential, commercial, and industrial. Demand for cool roofs is largely driven by rise in output of the construction industry. Growth in residential and commercial sectors, particularly in Asia Pacific, is driving the demand for cool roofs. In terms of region, the cool roofs market has been split into North America, Latin America, Europe, Asia Pacific, and Middle East & Africa. North America experienced the maximum demand for cool roofs in 2017. The region accounted for more than 70% share of the global market in 2017, led by the rise in consumption of cool roofs in the U.S. and Canada. The market in Asia Pacific is estimated to expand at a significant pace during the forecast period due to the growth in the construction industry in developing economies such as India, Vietnam, and the Philippines; and rapid urbanization. The cool roofs market in Germany, the U.K., Italy, France, and Russia in Europe is fragmented. The market in Middle East & Africa and Latin America is projected to expand at a moderate pace during the forecast period. High demand for energy-efficient, durable, and low-cost cool roofs and tax benefits offered by governments of various countries are prominent factors likely to augment the cool roofs market in Latin America and Middle East & Africa during the forecast period.
Key players profiled in the report on the global cool roofs market are Owens Corning, Certain Teed Corporation, GAF Materials Corporation, Tamko Building Products, Inc., IKO Industries Ltd., ATAS International Inc., Henry Company, PABCO Building Products, LLC., Malarkey Roofing, and Polyglass S.p.A.
1. Preface
1.1. Report Scope
1.2. Market Segmentation
1.3. Research Highlights
1.4. Key Research Objectives
2. Assumptions and Research Methodology
3. Executive Summary
4. Market Overview
4.1. Introduction
4.1.1. Product Definition
4.1.2. Key Applications
4.1.3. Comparison of Roof Technologies
4.1.4. Market Indicators
5. Market Dynamics
5.1. Drivers
5.2. Restraints
5.3. Opportunities
5.4. Porter's Five Forces Analysis
5.5. Value Chain Analysis
5.6. Regulatory Landscape
5.7. Price Trend Analysis
5.8. List of Key Manufacturers
6. Global Cool Roofs Market Analysis, by Roof Type
7. Global Cool Roofs Market Analysis, by Roof Slope
8. Global Cool Roofs Market Analysis, by Application
9. Global Cool Roofs Market Analysis, by Region
10. North America Cool Roofs Market Analysis, by Roof Type
11. North America Cool Roofs Market Analysis, by Roof Slope
12. North America Cool Roofs Market Analysis, by Application
13. North America Cool Roofs Market Analysis, by Country
13.1. U.S. Cool Roofs Market Forecast, 2017–2026
13.2. Canada Cool Roofs Market Forecast, 2017–2026
14. Europe Cool Roofs Market Analysis, by Roof Type
15. Europe Cool Roofs Market Analysis, by Roof Slope
16. Europe Cool Roofs Market Analysis, by Application
17. Europe Cool Roofs Market Analysis, by Country and Sub-region
17.1. Germany Cool Roofs Market Forecast, 2017–2026
17.2. U.K. Cool Roofs Market Forecast, 2017–2026
17.3. France Cool Roofs Market Forecast, 2017–2026
17.4. Italy Cool Roofs Market Forecast, 2017–2026
17.5. Spain Cool Roofs Market Forecast, 2017–2026
17.6. Russia Cool Roofs Market Forecast, 2017–2026
17.7. Rest of Europe Cool Roofs Market Forecast, 2017–2026
18. Asia Pacific Cool Roofs Market Analysis, by Roof Type
19. Asia Pacific Cool Roofs Market Analysis, by Roof Slope
20. Asia Pacific Cool Roofs Market Analysis, by Application
21. Asia Pacific Cool Roofs Market Analysis, by Country and Sub-region
21.1. China Cool Roofs Market Forecast, 2017–2026
21.2. India Cool Roofs Market Forecast, 2017–2026
21.3. Japan Cool Roofs Market Forecast, 2017–2026
21.4. ASEAN Cool Roofs Market Forecast, 2017–2026
21.5. Rest of Asia Pacific Cool Roofs Market Forecast, 2017–2026
22. Latin America Cool Roofs Market Analysis, by Roof Type
23. Latin America Cool Roofs Market Analysis, by Roof Slope
24. Latin America Cool Roofs Market Analysis, by Application
25. Latin America Cool Roofs Market Analysis, by Country and Sub-region
25.1. Brazil Cool Roofs Market Forecast, 2017–2026
25.2. Mexico Cool Roofs Market Forecast, 2017–2026
25.3. Rest of Latin America Cool Roofs Market Forecast, 2017–2026
26. Middle East & Africa Cool Roofs Market Analysis, by Roof Type
27. Middle East & Africa Cool Roofs Market Analysis, by Roof Slope
28. Middle East & Africa Cool Roofs Market Analysis, by Application
29. Middle East & Africa Cool Roofs Market Analysis, by Country and Sub-region
29.1. GCC Cool Roofs Market Forecast, 2017–2026
29.2. South Africa Cool Roofs Market Forecast, 2017–2026
29.3. Rest of Middle East & Africa Cool Roofs Market Forecast, 2017–2026
30. Competition Landscape
30.1. Cool Roofs Market Share Analysis, by Company (2017)
30.2. Product Mapping
30.3. Company Profile
30.3.1. Owens Corning
30.3.2. CertainTeed Corporation
30.3.3. GAF Materials Corporation
30.3.4. Tamko Building Products, Inc.
30.3.5. IKO Industries Ltd.
30.3.6. ATAS International Inc.
30.3.7. Henry
30.3.8. PABCO Building Products, LLC
30.3.9. Malarkey Roofing
30.3.10. POLYGLASS S.p.A.
List of Tables
Table 1: Global Cool Roofs Market Volume (Million Square Meters) Forecast, by Roof Type, 2017–2026
Table 2: Global Cool Roofs Market Value (US$ Mn) Forecast, by Roof Type, 2017–2026
Table 3: Global Cool Roofs Market Volume (Million Square Meters) Forecast, by Roof Slope, 2017–2026
Table 4: Global Cool Roofs Market Value (US$ Mn) Forecast, by Roof Slope, 2017–2026
Table 5: Global Cool Roofs Market Volume (Million Square Meters) Forecast, by Application, 2017–2026
Table 6: Global Cool Roofs Market Value (US$ Mn) Forecast, by Application, 2017–2026
Table 7: Global Cool Roofs Market Volume (Million Square Meters) Forecast, by Region, 2017–2026
Table 8: Global Cool Roofs Market Value (US$ Mn) Forecast, by Region, 2017–2026
Table 9: North America Cool Roofs Market Volume (Million Square Meters) Forecast, by Roof Type, 2017–2026
Table 10: North America Cool Roofs Market Value (US$ Mn) Forecast, by Roof Type, 2017–2026
Table 11: North America Cool Roofs Market Volume (Million Square Meters) Forecast, by Roof Slope, 2017–2026
Table 12: North America Cool Roofs Market Value (US$ Mn) Forecast, by Roof Slope, 2017–2026
Table 13: North America Cool Roofs Market Volume (Million Square Meters) Forecast, by Application, 2017–2026
Table 14: North America Cool Roofs Market Value (US$ Mn) Forecast, by Application, 2017–2026
Table 15: North America Cool Roofs Market Volume (Million Square Meters) Forecast, by Country, 2017–2026
Table 16: North America Cool Roofs Market Value (US$ Mn) Forecast, by Country, 2017–2026
Table 17: U.S. Cool Roofs Market Volume (Million Square Meters) Forecast, by Roof Type, 2017–2026
Table 18: U.S. Cool Roofs Market Value (US$ Mn) Forecast, by Roof Type, 2017–2026
Table 19: North America Cool Roofs Market Volume (Million Square Meters) Forecast, by Roof Slope, 2017–2026
Table 20: North America Cool Roofs Market Value (US$ Mn) Forecast, by Roof Slope, 2017–2026
Table 21: North America Cool Roofs Market Volume (Million Square Meters) Forecast, by Application, 2017–2026
Table 22: North America Cool Roofs Market Value (US$ Mn) Forecast, by Application, 2017–2026
Table 23: Canada Cool Roofs Market Volume (Million Square Meters) Forecast, by Roof Type, 2017–2026
Table 24: Canada Cool Roofs Market Value (US$ Mn) Forecast, by Roof Type, 2017–2026
Table 25: North America Cool Roofs Market Volume (Million Square Meters) Forecast, by Roof Slope, 2017–2026
Table 26: North America Cool Roofs Market Value (US$ Mn) Forecast, by Roof Slope, 2017–2026
Table 27: North America Cool Roofs Market Volume (Million Square Meters) Forecast, by Application, 2017–2026
Table 28: North America Cool Roofs Market Value (US$ Mn) Forecast, by Application, 2017–2026
Table 29: Europe Cool Roofs Market Volume (Million Square Meters) Forecast, by Roof Type, 2017–2026
Table 30: Europe Cool Roofs Market Value (US$ Mn) Forecast, by Roof Type, 2017–2026
Table 31: Europe Cool Roofs Market Volume (Million Square Meters) Forecast, by Roof Slope, 2017–2026
Table 32: Europe Cool Roofs Market Value (US$ Mn) Forecast, by Roof Slope, 2017–2026
Table 33: Europe Cool Roofs Market Volume (Million Square Meters) Forecast, by Application, 2017–2026
Table 34: Europe Cool Roofs Market Value (US$ Mn) Forecast, by Application, 2017–2026
Table 35: Europe Cool Roofs Market Volume (Million Square Meters) Forecast, by Country and Sub-region, 2017–2026
Table 36: Europe Cool Roofs Market Value (US$ Mn) Forecast, by Country and Sub-region, 2017–2026
Table 37: Germany Cool Roofs Market Volume (Million Square Meters) Forecast, by Roof Type, 2017–2026
Table 38: Germany Cool Roofs Market Value (US$ Mn) Forecast, by Roof Type, 2017–2026
Table 39: Germany Cool Roofs Market Volume (Million Square Meters) Forecast, by Roof Slope, 2017–2026
Table 40: Germany Cool Roofs Market Value (US$ Mn) Forecast, by Roof Slope, 2017–2026
Table 41: Germany Cool Roofs Market Volume (Million Square Meters) Forecast, by Application, 2017–2026
Table 42: Germany Cool Roofs Market Value (US$ Mn) Forecast, by Application, 2017–2026
Table 43: France Cool Roofs Market Volume (Million Square Meters) Forecast, by Roof Type, 2017–2026
Table 44: France Cool Roofs Market Value (US$ Mn) Forecast, by Roof Type, 2017–2026
Table 45: France Cool Roofs Market Volume (Million Square Meters) Forecast, by Roof Slope, 2017–2026
Table 46: France Cool Roofs Market Value (US$ Mn) Forecast, by Roof Slope, 2017–2026
Table 47: France Cool Roofs Market Volume (Million Square Meters) Forecast, by Application, 2017–2026
Table 48: France Cool Roofs Market Value (US$ Mn) Forecast, by Application, 2017–2026
Table 49: U.K. Cool Roofs Market Volume (Million Square Meters) Forecast, by Roof Type, 2017–2026
Table 50: U.K. Cool Roofs Market Value (US$ Mn) Forecast, by Roof Type, 2017–2026
Table 51: U.K. Cool Roofs Market Volume (Million Square Meters) Forecast, by Roof Slope, 2017–2026
Table 52: U.K. Cool Roofs Market Value (US$ Mn) Forecast, by Roof Slope, 2017–2026
Table 53: U.K. Cool Roofs Market Volume (Million Square Meters) Forecast, by Application, 2017–2026
Table 54: U.K. Cool Roofs Market Value (US$ Mn) Forecast, by Application, 2017–2026
Table 55: Italy Cool Roofs Market Volume (Million Square Meters) Forecast, by Roof Type, 2017–2026
Table 56: Italy Cool Roofs Market Value (US$ Mn) Forecast, by Roof Type, 2017–2026
Table 57: Italy Cool Roofs Market Volume (Million Square Meters) Forecast, by Roof Slope, 2017–2026
Table 58: Italy Cool Roofs Market Value (US$ Mn) Forecast, by Roof Slope, 2017–2026
Table 59: Italy Cool Roofs Market Volume (Million Square Meters) Forecast, by Application, 2017–2026
Table 60: Italy Cool Roofs Market Value (US$ Mn) Forecast, by Application, 2017–2026
Table 61: Spain Cool Roofs Market Volume (Million Square Meters) Forecast, by Roof Type, 2017–2026
Table 62: Spain Cool Roofs Market Value (US$ Mn) Forecast, by Roof Type, 2017–2026
Table 63: Spain Cool Roofs Market Volume (Million Square Meters) Forecast, by Roof Slope, 2017–2026
Table 64: Spain Cool Roofs Market Value (US$ Mn) Forecast, by Roof Slope, 2017–2026
Table 65: Spain Cool Roofs Market Volume (Million Square Meters) Forecast, by Application, 2017–2026
Table 66: Spain Cool Roofs Market Value (US$ Mn) Forecast, by Application, 2017–2026
Table 67: Russia & CIS Cool Roofs Market Volume (Million Square Meters) Forecast, by Roof Type, 2017–2026
Table 68: Russia & CIS Cool Roofs Market Value (US$ Mn) Forecast, by Roof Type, 2017–2026
Table 69: Russia & CIS Cool Roofs Market Volume (Million Square Meters) Forecast, by Roof Slope, 2017–2026
Table 70: Russia & CIS Cool Roofs Market Value (US$ Mn) Forecast, by Roof Slope, 2017–2026
Table 71: Russia & CIS Cool Roofs Market Volume (Million Square Meters) Forecast, by Application, 2017–2026
Table 72: Russia & CIS Cool Roofs Market Value (US$ Mn) Forecast, by Application, 2017–2026
Table 73: Rest of Europe Cool Roofs Market Volume (Million Square Meters) Forecast, by Roof Type, 2017–2026
Table 74: Rest of Europe Cool Roofs Market Value (US$ Mn) Forecast, by Roof Type, 2017–2026
Table 75: Rest of Europe Cool Roofs Market Volume (Million Square Meters) Forecast, by Roof Slope, 2017–2026
Table 76: Rest of Europe Cool Roofs Market Value (US$ Mn) Forecast, by Roof Slope, 2017–2026
Table 77: Rest of Europe Cool Roofs Market Volume (Million Square Meters) Forecast, by Application, 2017–2026
Table 78: Rest of Europe Cool Roofs Market Value (US$ Mn) Forecast, by Application, 2017–2026
Table 79: Asia Pacific Cool Roofs Market Volume (Million Square Meters) Forecast, by Roof Type, 2017–2026
Table 80: Asia Pacific Cool Roofs Market Value (US$ Mn) Forecast, by Roof Type, 2017–2026
Table 81: Asia Pacific Cool Roofs Market Volume (Million Square Meters) Forecast, by Roof Slope, 2017–2026
Table 82: Asia Pacific Cool Roofs Market Value (US$ Mn) Forecast, by Roof Slope, 2017–2026
Table 83: Asia Pacific Cool Roofs Market Volume (Million Square Meters) Forecast, by Application, 2017–2026
Table 84: Asia Pacific Cool Roofs Market Value (US$ Mn) Forecast, by Application, 2017–2026
Table 85: Asia Pacific Cool Roofs Market Volume (Million Square Meters) Forecast, by Country and Sub-region, 2017–2026
Table 86: Asia Pacific Cool Roofs Market Value (US$ Mn) Forecast, by Country and Sub-region, 2017–2026
Table 87: China Cool Roofs Market Volume (Million Square Meters) Forecast, by Roof Type, 2017–2026
Table 88: China Cool Roofs Market Value (US$ Mn) Forecast, by Roof Type, 2017–2026
Table 89: China Cool Roofs Market Volume (Million Square Meters) Forecast, by Roof Slope, 2017–2026
Table 90: China Cool Roofs Market Value (US$ Mn) Forecast, by Roof Slope, 2017–2026
Table 91: China Cool Roofs Market Volume (Million Square Meters) Forecast, by Application, 2017–2026
Table 92: China Cool Roofs Market Value (US$ Mn) Forecast, by Application, 2017–2026
Table 93: India Cool Roofs Market Volume (Million Square Meters) Forecast, by Roof Type, 2017–2026
Table 94: India Cool Roofs Market Value (US$ Mn) Forecast, by Roof Type, 2017–2026
Table 95: India Cool Roofs Market Volume (Million Square Meters) Forecast, by Roof Slope, 2017–2026
Table 96: India Cool Roofs Market Value (US$ Mn) Forecast, by Roof Slope, 2017–2026
Table 97: India Cool Roofs Market Volume (Million Square Meters) Forecast, by Application, 2017–2026
Table 98: India Cool Roofs Market Value (US$ Mn) Forecast, by Application, 2017–2026
Table 99: Japan Cool Roofs Market Volume (Million Square Meters) Forecast, by Roof Type, 2017–2026
Table 100: Japan Cool Roofs Market Value (US$ Mn) Forecast, by Roof Type, 2017–2026
Table 101: Japan Cool Roofs Market Volume (Million Square Meters) Forecast, by Roof Slope, 2017–2026
Table 102: Japan Cool Roofs Market Value (US$ Mn) Forecast, by Roof Slope, 2017–2026
Table 103: Japan Cool Roofs Market Volume (Million Square Meters) Forecast, by Application, 2017–2026
Table 104: Japan Cool Roofs Market Value (US$ Mn) Forecast, by Application, 2017–2026
Table 105: ASEAN Cool Roofs Market Volume (Million Square Meters) Forecast, by Roof Type, 2017–2026
Table 106: ASEAN Cool Roofs Market Value (US$ Mn) Forecast, by Roof Type, 2017–2026
Table 107: ASEAN Cool Roofs Market Volume (Million Square Meters) Forecast, by Roof Slope, 2017–2026
Table 108: ASEAN Cool Roofs Market Value (US$ Mn) Forecast, by Roof Slope, 2017–2026
Table 109: ASEAN Cool Roofs Market Volume (Million Square Meters) Forecast, by Application, 2017–2026
Table 110: ASEAN Cool Roofs Market Value (US$ Mn) Forecast, by Application, 2017–2026
Table 111: Rest of Asia Pacific Cool Roofs Market Volume (Million Square Meters) Forecast, by Roof Type, 2017–2026
Table 112: Rest of Asia Pacific Cool Roofs Market Value (US$ Mn) Forecast, by Roof Type, 2017–2026
Table 113: Rest of Asia Pacific Cool Roofs Market Volume (Million Square Meters) Forecast, by Roof Slope, 2017–2026
Table 114: Rest of Asia Pacific Cool Roofs Market Value (US$ Mn) Forecast, by Roof Slope, 2017–2026
Table 115: Rest of Asia Pacific Cool Roofs Market Volume (Million Square Meters) Forecast, by Application, 2017–2026
Table 116: Rest of Asia Pacific Cool Roofs Market Value (US$ Mn) Forecast, by Application, 2017–2026
Table 117: Latin America Cool Roofs Market Volume (Million Square Meters) Forecast, by Roof Type, 2017–2026
Table 118: Latin America Cool Roofs Market Value (US$ Mn) Forecast, by Roof Type, 2017–2026
Table 119: Latin America Cool Roofs Market Volume (Million Square Meters) Forecast, by Roof Slope, 2017–2026
Table 120: Latin America Cool Roofs Market Value (US$ Mn) Forecast, by Roof Slope, 2017–2026
Table 121: Latin America Cool Roofs Market Volume (Million Square Meters) Forecast, by Application, 2017–2026
Table 122: Latin America Cool Roofs Market Value (US$ Mn) Forecast, by Application, 2017–2026
Table 123: Latin America Cool Roofs Market Volume (Million Square Meters) Forecast, by Country and Sub-region, 2017–2026
Table 124: Latin America Cool Roofs Market Value (US$ Mn) Forecast, by Country and Sub-region, 2017–2026
Table 125: Brazil Cool Roofs Market Volume (Million Square Meters) Forecast, by Roof Type, 2017–2026
Table 126: Brazil Cool Roofs Market Value (US$ Mn) Forecast, by Roof Type, 2017–2026
Table 127: Brazil Cool Roofs Market Volume (Million Square Meters) Forecast, by Roof Slope, 2017–2026
Table 128: Brazil Cool Roofs Market Value (US$ Mn) Forecast, by Roof Slope, 2017–2026
Table 129: Brazil Cool Roofs Market Volume (Million Square Meters) Forecast, by Application, 2017–2026
Table 130: Brazil Cool Roofs Market Value (US$ Mn) Forecast, by Application, 2017–2026
Table 131: Mexico Cool Roofs Market Volume (Million Square Meters) Forecast, by Roof Type, 2017–2026
Table 132: Mexico Cool Roofs Market Value (US$ Mn) Forecast, by Roof Type, 2017–2026
Table 133: Mexico Cool Roofs Market Volume (Million Square Meters) Forecast, by Roof Slope, 2017–2026
Table 134: Mexico Cool Roofs Market Value (US$ Mn) Forecast, by Roof Slope, 2017–2026
Table 135: Mexico Cool Roofs Market Volume (Million Square Meters) Forecast, by Application, 2017–2026
Table 136: Mexico Cool Roofs Market Value (US$ Mn) Forecast, by Application, 2017–2026
Table 137: Rest of Latin America Cool Roofs Market Volume (Million Square Meters) Forecast, by Roof Type, 2017–2026
Table 138: Rest of Latin America Cool Roofs Market Value (US$ Mn) Forecast, by Roof Type, 2017–2026
Table 139: Rest of Latin America Cool Roofs Market Volume (Million Square Meters) Forecast, by Roof Slope, 2017–2026
Table 140: Rest of Latin America Cool Roofs Market Value (US$ Mn) Forecast, by Roof Slope, 2017–2026
Table 141: Rest of Latin America Cool Roofs Market Volume (Million Square Meters) Forecast, by Application, 2017–2026
Table 142: Rest of Latin America Cool Roofs Market Value (US$ Mn) Forecast, by Application, 2017–2026
Table 143: Middle East & Africa Cool Roofs Market Volume (Million Square Meters) Forecast, by Roof Type, 2017–2026
Table 144: Middle East & Africa Cool Roofs Market Value (US$ Mn) Forecast, by Roof Type, 2017–2026
Table 145: Middle East & Africa Cool Roofs Market Volume (Million Square Meters) Forecast, by Roof Slope, 2017–2026
Table 146: Middle East & Africa Cool Roofs Market Value (US$ Mn) Forecast, by Roof Slope, 2017–2026
Table 147: Middle East & Africa Cool Roofs Market Volume (Million Square Meters) Forecast, by Application, 2017–2026
Table 148: Middle East & Africa Cool Roofs Market Value (US$ Mn) Forecast, by Application, 2017–2026
Table 149: Middle East & Africa Cool Roofs Market Volume (Million Square Meters) Forecast, by Country and Sub-region, 2017–2026
Table 150: Middle East & Africa Cool Roofs Market Value (US$ Mn) Forecast, by Country and Sub-region, 2017–2026
Table 151: GCC Cool Roofs Market Volume (Million Square Meters) Forecast, by Roof Type, 2017–2026
Table 152: GCC Cool Roofs Market Value (US$ Mn) Forecast, by Roof Type, 2017–2026
Table 153: GCC Cool Roofs Market Volume (Million Square Meters) Forecast, by Roof Slope, 2017–2026
Table 154: GCC Cool Roofs Market Value (US$ Mn) Forecast, by Roof Slope, 2017–2026
Table 155: GCC Cool Roofs Market Volume (Million Square Meters) Forecast, by Application, 2017–2026
Table 156: GCC Cool Roofs Market Value (US$ Mn) Forecast, by Application, 2017–2026
Table 157: South Africa Cool Roofs Market Volume (Million Square Meters) Forecast, by Roof Type, 2017–2026
Table 158: South Africa Cool Roofs Market Value (US$ Mn) Forecast, by Roof Type, 2017–2026
Table 159: South Africa Cool Roofs Market Volume (Million Square Meters) Forecast, by Roof Slope, 2017–2026
Table 160: South Africa Cool Roofs Market Value (US$ Mn) Forecast, by Roof Slope, 2017–2026
Table 161: South Africa Cool Roofs Market Volume (Million Square Meters) Forecast, by Application, 2017–2026
Table 162: South Africa Cool Roofs Market Value (US$ Mn) Forecast, by Application, 2017–2026
Table 163: Rest of Middle East & Africa Cool Roofs Market Volume (Million Square Meters) Forecast, by Roof Type, 2017–2026
Table 164: Rest of Middle East & Africa Cool Roofs Market Value (US$ Mn) Forecast, by Roof Type, 2017–2026
Table 165: Rest of Middle East & Africa Cool Roofs Market Volume (Million Square Meters) Forecast, by Roof Slope, 2017–2026
Table 166: Rest of Middle East & Africa Cool Roofs Market Value (US$ Mn) Forecast, by Roof Slope, 2017–2026
Table 167: Rest of Middle East & Africa Cool Roofs Market Volume (Million Square Meters) Forecast, by Application, 2017–2026
Table 168: Rest of Middle East & Africa Cool Roofs Market Value (US$ Mn) Forecast, by Application, 2017–2026
List of Figures
Figure 1: Cool Roofs Market Value Share, by Application, 2017
Figure 2: Key Analysis
Figure 3: Cool Roofs Market Value (US$ Mn), by Region, 2017
Figure 4: Global Cool Roofs Price Trend Analysis, US$ Per Square Meter)
Figure 5: Global Cool Roofs Market Volume (Million Square Meters) Forecast, 2017–2026
Figure 6: Global Cool Roofs Market Value (US$ Mn) Forecast, 2017–2026
Figure 7: Global Cool Roofs Market Volume Analysis, by Roof Type, 2017 and 2026
Figure 8: Global Cool Roofs Market Attractiveness, by Roof Type
Figure 9: Global Cool Roofs Market Value Analysis, by Roof Slope, 2017 and 2026
Figure 10: Global Cool Roofs Market Attractiveness, by Roof Slope
Figure 11: Global Cool Roofs Market Value Analysis, by Application, 2017 and 2026
Figure 12: Global Cool Roofs Market Attractiveness, by Application
Figure 13: Global Cool Roofs Market Volume Share, by Region, 2017 and 2026
Figure 14: Global Cool Roofs Market Attractiveness, by Region
Figure 15: North America Cool Roofs Market Volume (Million Square Meters) Forecast, 2017–2026
Figure 16: North America Cool Roofs Market Value (US$ Mn) Forecast, 2017–2026
Figure 17: North America Cool Roofs Market Volume Analysis, by Roof Type, 2017 and 2026
Figure 18: North America Cool Roofs Market Attractiveness, by Roof Type
Figure 19: North America Cool Roofs Market Value Analysis, by Roof Slope, 2017 and 2026
Figure 20: North America Cool Roofs Market Attractiveness, by Roof Slope
Figure 21: North America Cool Roofs Market Value Analysis, by Application, 2017 and 2026
Figure 22: North America Cool Roofs Market Attractiveness, by Application
Figure 23: North America Cool Roofs Market Volume Analysis, by Country, 2017 and 2026
Figure 24: North America Cool Roofs Market Attractiveness, by Country
Figure 25: Europe Cool Roofs Market Volume (Million Square Meters) Forecast, 2017–2026
Figure 26: Europe Cool Roofs Market Value (US$ Mn) Forecast, 2017–2026
Figure 27: Europe Cool Roofs Market Volume Analysis, by Roof Type, 2017 and 2026
Figure 28: Europe Cool Roofs Market Attractiveness, by Roof Type
Figure 29: Europe Cool Roofs Market Value Analysis, by Roof Slope, 2017 and 2026
Figure 30: Europe Cool Roofs Market Attractiveness, by Roof Slope
Figure 31: Europe Cool Roofs Market Value Analysis, by Application, 2017 and 2026
Figure 32: Europe Cool Roofs Market Attractiveness, by Application
Figure 35: Europe Cool Roofs Market Volume Share, by Country and Sub-region, 2017 and 2026
Figure 36: Europe Cool Roofs Market Attractiveness, by Country and Sub-region
Figure 35: Asia Pacific Cool Roofs Market Volume (Million Square Meters) Forecast, 2017–2026
Figure 36: Asia Pacific Cool Roofs Market Value (US$ Mn) Forecast, 2017–2026
Figure 37: Asia Pacific Cool Roofs Market Volume Analysis, by Roof Type, 2017 and 2026
Figure 38: Asia Pacific Cool Roofs Market Attractiveness, by Roof Type
Figure 39: Asia Pacific Cool Roofs Market Value Analysis, by Roof Slope, 2017 and 2026
Figure 40: Asia Pacific Cool Roofs Market Attractiveness, by Roof Slope
Figure 41: Asia Pacific Cool Roofs Market Value Analysis, by Application, 2017 and 2026
Figure 42: Asia Pacific Cool Roofs Market Attractiveness, by Application
Figure 43: Asia Pacific Cool Roofs Market Volume Analysis, by Country and Sub-region, 2017 and 2026
Figure 44: Asia Pacific Cool Roofs Market Attractiveness, by Country and Sub-region
Figure 45: Latin America Cool Roofs Market Volume (Million Square Meters) Forecast, 2017–2026
Figure 46: Latin America Cool Roofs Market Value (US$ Mn) Forecast, 2017–2026
Figure 47: Latin America Cool Roofs Market Volume Analysis, by Roof Type, 2017 and 2026
Figure 48: Latin America Cool Roofs Market Attractiveness, by Roof Type
Figure 49: Latin America Cool Roofs Market Value Analysis, by Roof Slope, 2017 and 2026
Figure 50: Latin America Cool Roofs Market Attractiveness, by Roof Slope
Figure 51: Latin America Cool Roofs Market Value Analysis, by Application, 2017 and 2026
Figure 52: Latin America Cool Roofs Market Attractiveness, by Application
Figure 53: Latin America Metal Roofing Market Value Analysis, by Country and Sub-region, 2017 and 2028
Figure 54: Latin America Metal Roofing Market Attractiveness, by Country and Sub-region
Figure 55: Middle East & Africa Cool Roofs Market Volume (Million Square Meters) Forecast, 2017–2026
Figure 56: Middle East & Africa Cool Roofs Market Value (US$ Mn) Forecast, 2017–2026
Figure 57: Middle East & Africa Cool Roofs Market Volume Analysis, by Roof Type, 2017 and 2026
Figure 58: Middle East & Africa Cool Roofs Market Attractiveness, by Roof Type
Figure 59: Middle East & Africa Cool Roofs Market Value Analysis, by Roof Slope, 2017 and 2026
Figure 60: Middle East & Africa Cool Roofs Market Attractiveness, by Roof Slope
Figure 61: Middle East & Africa Cool Roofs Market Value Analysis, by Application, 2017 and 2026
Figure 62: Middle East & Africa Cool Roofs Market Attractiveness, by Application
Figure 63: Middle East & Africa Metal Roofing Market Value Analysis, by Country and sub-region, 2017 and 2028
Figure 64: Middle East & Africa Metal Roofing Market Attractiveness, by Country and Sub-region
Copyright © Transparency Market Research, Inc. All Rights reserved
Trust Online

Cool Roofs Market