
Reports
Reports
Key players in the global compression therapy market are engaged in regulatory approvals, technologically advanced products, launch of new products, and acquisition & collaborative agreements with other companies. These strategies are likely to fuel the growth of the global compression therapy market. A few expansion strategies adopted by players operating in the global compression therapy market are:
The report on the global compression therapy market discussed individual strategies, followed by company profiles of manufacturers of compression therapy. The competitive landscape section has been included in the report to provide readers with a dashboard view and a company market share analysis of key players operating in the global compression therapy market.
Compression therapy market is projected to reach a value of US$ 5,157.4 million by the end of 2027
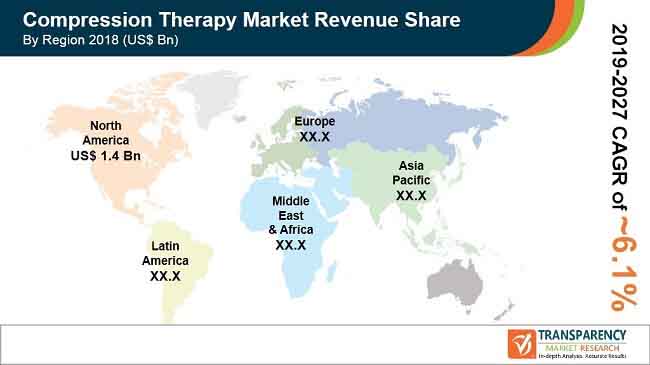
Compression therapy market is anticipated to grow at a CAGR of 6.1% during the forecast period
North America accounted for a major share of the global compression therapy market
Compression therapy market is driven by rising sports injuries, increase in the number of orthopedic surgeries, and rapidly growing obese population
Key players in the global compression therapy market include 3M Health Care, ArjoHuntleigh, Bio Compression Systems, Inc., BSN Medical, Covidien plc, medi GmbH & Co KG, PAUL HARTMANN AG, and SIGVARIS MANAGEMENT AG, among others
1. Preface
1.1. Market Definition and Scope
1.2. Market Segmentation
1.3. Key Research Objectives
1.4. Research Highlights
2. Assumptions and Research Methodology
3. Executive Summary: Global Compression therapy Market
4. Market Overview
4.1. Introduction
4.1.1. Definition
4.1.2. Industry Evolution / Developments
4.2. Overview
4.3. Market Dynamics
4.3.1. Drivers
4.3.2. Restraints
4.3.3. Opportunities
4.4. Global Compression therapy Market Analysis and Forecast, 2017-2027
4.4.1. Market Revenue Projections (US$ Mn)
5. Key Insights
5.1. Porter’s Five Forces Analysis
5.2. Heat Map Analysis, by Key Players
5.3. Value Chain Analysis
6. Global Compression therapy Market Analysis and Forecast, by Technology
6.1. Introduction & Definition
6.1.1. Key Findings / Developments
6.2. Global Compression therapy Market Value Forecast, by Technology, 2017-2027
6.2.1. Static
6.2.2. Dynamic
6.3. Global Compression therapy Market Attractiveness, by Technology
7. Global Compression therapy Market Analysis and Forecast, by Product
7.1. Introduction & Definition
7.1.1. Key Findings / Developments
7.2. Global Compression therapy Market Value Forecast, by Product, 2017-2027
7.2.1. Compression Pump
7.2.1.1. Intermittent
7.2.1.2. Sequential
7.2.2. Compression Stocking
7.2.3. Compression Bandages
7.2.4. Compression Tapes
7.3. Global Compression therapy Market Attractiveness, by Product
8. Global Compression therapy Market Analysis and Forecast, by Type
8.1. Introduction & Definition
8.1.1. Key Findings / Developments
9. Global Compression therapy Market Analysis and Forecast, by Region
9.1. Key Findings
9.2. Global Compression therapy Market Value Forecast, by Region
9.2.1. North America
9.2.2. Europe
9.2.3. Asia Pacific
9.2.4. Latin America
9.2.5. Middle East & Africa
9.3. North America Compression therapy Market Attractiveness, by Region
10. North America Compression therapy Market Analysis and Forecast
10.1. Introduction
10.1.1. Key Findings
10.2. North America Compression therapy Market Value (US$ Mn) Forecast, by Technology, 2017-2027
10.2.1. Static
10.2.2. Dynamic
10.3. North America Compression therapy Market Value (US$ Mn) Forecast, by Product, 2017-2027
10.3.1. Compression Pump
10.3.1.1. Intermittent
10.3.1.2. Sequential
10.3.2. Compression Stocking
10.3.3. Compression Bandages
10.3.4. Compression Tapes
10.4. North America Compression therapy Market Value (US$ Mn) Forecast, by Country, 2017-2027
10.4.1. U.S.
10.4.2. Canada
10.5. North America Compression therapy Market Attractiveness Analysis
10.5.1. By Technology
10.5.2. By Product
10.5.3. By Country
11. Europe Compression therapy Market Analysis and Forecast
11.1. Introduction
11.1.1. Key Findings
11.2. Europe Compression therapy Market Value (US$ Mn) Forecast, by Technology, 2017-2027
11.2.1. Static
11.2.2. Dynamic
11.3. Europe Compression therapy Market Value (US$ Mn) Forecast, by Product, 2017-2027
11.3.1. Compression Pump
11.3.1.1. Intermittent
11.3.1.2. Sequential
11.3.2. Compression Stocking
11.3.3. Compression Bandages
11.3.4. Compression Tapes
11.4. Europe Compression therapy Market Value (US$ Mn) Forecast, by Country/Sub-region, 2017-2027
11.4.1. Germany
11.4.2. U.K.
11.4.3. France
11.4.4. Spain
11.4.5. Italy
11.4.6. Rest of Europe
11.5. Europe Compression therapy Market Attractiveness Analysis
11.5.1. By Technology
11.5.2. By Product
11.5.3. By Country/Sub-region
12. Asia Pacific Compression therapy Market Analysis and Forecast
12.1. Introduction
12.1.1. Key Findings
12.2. Asia Pacific Compression therapy Market Value (US$ Mn) Forecast, by Technology, 2017-2027
12.2.1. Static
12.2.2. Dynamic
12.3. Asia Pacific Compression therapy Market Value (US$ Mn) Forecast, by Product, 2017-2027
12.3.1. Compression Pump
12.3.1.1. Intermittent
12.3.1.2. Sequential
12.3.2. Compression Stocking
12.3.3. Compression Bandages
12.3.4. Compression Tapes
12.4. Asia Pacific Compression therapy Market Value (US$ Mn) Forecast, by Country/Sub-region, 2017-2027
12.4.1. China
12.4.2. Japan
12.4.3. India
12.4.4. Australia & New Zealand
12.4.5. Rest of Asia Pacific
12.5. Asia Pacific Compression therapy Market Attractiveness Analysis
12.5.1. By Technology
12.5.2. By Product
12.5.3. By Country/Sub-region
13. Latin America Compression therapy Market Analysis and Forecast
13.1. Introduction
13.1.1. Key Findings
13.2. Latin America Compression therapy Market Value (US$ Mn) Forecast, by Technology, 2017-2027
13.2.1. Static
13.2.2. Dynamic
13.3. Latin America Compression therapy Market Value (US$ Mn) Forecast, by Product, 2017-2027
13.3.1. Compression Pump
13.3.1.1. Intermittent
13.3.1.2. Sequential
13.3.2. Compression Stocking
13.3.3. Compression Bandages
13.3.4. Compression Tapes
13.4. Latin America Compression therapy Market Value (US$ Mn) Forecast, by Country/Sub-region, 2017-2027
13.4.1. Brazil
13.4.2. Mexico
13.4.3. Rest of Latin America Latin America
13.5. Latin America Compression therapy Market Attractiveness Analysis
13.5.1. By Technology
13.5.2. By Product
13.5.3. By Country/Sub-region
14. Middle East & Africa Compression therapy Market Analysis and Forecast
14.1. Introduction
14.1.1. Key Findings
14.2. Middle East & Africa Compression therapy Market Value (US$ Mn) Forecast, by Technology, 2017-2027
14.2.1. Static
14.2.2. Dynamic
14.3. Middle East & Africa Compression therapy Market Value (US$ Mn) Forecast, by Product, 2017-2027
14.3.1. Compression Pump
14.3.1.1. Intermittent
14.3.1.2. Sequential
14.3.2. Compression Stocking
14.3.3. Compression Bandages
14.3.4. Compression Tapes
14.4. Middle East & Africa Compression therapy Market Value (US$ Mn) Forecast, by Country/Sub-region, 2017-2027
14.4.1. GCC Countries
14.4.2. South Africa
14.4.3. Rest of Middle East & Africa
14.5. Middle East & Africa Compression therapy Market Attractiveness Analysis
14.5.1. By Technology
14.5.2. By Product
14.5.3. By Country/Sub-region
15. Competition Landscape
15.1. Market Player - Competition Matrix (by Tier and Size of companies)
15.2. Market Share / Position Analysis, by Company, 2018
15.3. Company Profiles
15.3.1. 3M Health Care
15.3.1.1. Company Overview (HQ, Business Segments, Employee Strength)
15.3.1.2. Growth Strategies
15.3.1.3. SWOT Analysis
15.3.2. ArjoHuntleigh
15.3.2.1. Company Overview (HQ, Business Segments, Employee Strength)
15.3.2.2. Growth Strategies
15.3.2.3. SWOT Analysis
15.3.3. Bio Compression Systems, Inc.
15.3.3.1. Company Overview (HQ, Business Segments, Employee Strength)
15.3.3.2. Growth Strategies
15.3.3.3. SWOT Analysis
15.3.4. BSN Medical
15.3.4.1. Company Overview (HQ, Business Segments, Employee Strength)
15.3.4.2. Growth Strategies
15.3.4.3. SWOT Analysis
15.3.5. Covidien plc
15.3.5.1. Company Overview (HQ, Business Segments, Employee Strength)
15.3.5.2. Growth Strategies
15.3.5.3. SWOT Analysis
15.3.6. medi GmbH & Co KG
15.3.6.1. Company Overview (HQ, Business Segments, Employee Strength)
15.3.6.2. Growth Strategies
15.3.6.3. SWOT Analysis
15.3.7. PAUL HARTMANN AG
15.3.7.1. Company Overview (HQ, Business Segments, Employee Strength)
15.3.7.2. Growth Strategies
15.3.7.3. SWOT Analysis
15.3.8. SIGVARIS MANAGEMENT AG
15.3.8.1. Company Overview (HQ, Business Segments, Employee Strength)
15.3.8.2. Growth Strategies
15.3.8.3. SWOT Analysis
List of Tables
Table 1: Global Compression therapy Market Value (US$ Mn) Forecast, by Technology, 2017-2027
Table 2: Global Compression therapy Market Value (US$ Mn) Forecast, by Product, 2017-2027
Table 3: Global Compression therapy Market Value (US$ Mn) Forecast, by Compression Pump, 2017-2027
Table 4: Global Compression therapy Market Value (US$ Mn) Forecast, by Region, 2017-2027
Table 5: North America Compression therapy Market Value (US$ Mn) Forecast, by Country/Sub-region, 2017-2027
Table 6: North America Compression therapy Market Value (US$ Mn) Forecast, by Technology, 2017-2027
Table 7: North America Compression therapy Market Value (US$ Mn) Forecast, by Product, 2017-2027
Table 8: North America Compression therapy Market Value (US$ Mn) Forecast, by Compression Pump, 2017-2027
Table 9: Europe Compression therapy Market Value (US$ Mn) Forecast, by Country/Sub-region, 2017-2027
Table 10: Europe Compression therapy Market Value (US$ Mn) Forecast, by Technology, 2017-2027
Table 11: Europe Compression therapy Market Value (US$ Mn) Forecast, by Product, 2017-2027
Table 12: Europe Compression therapy Market Value (US$ Mn) Forecast, by Compression Pump, 2017-2027
Table 13: Asia Pacific Compression therapy Market Value (US$ Mn) Forecast, by Country/Sub-region, 2017-2027
Table 14: Asia Pacific Compression therapy Market Value (US$ Mn) Forecast, by Technology, 2017-2027
Table 15: Asia Pacific Compression therapy Market Value (US$ Mn) Forecast, by Product, 2017-2027
Table 16: Asia Pacific Compression therapy Market Value (US$ Mn) Forecast, by Compression Pump, 2017-2027
Table 17: Latin America Compression therapy Market Value (US$ Mn) Forecast, by Country/Sub-region, 2017-2027
Table 18: Latin America Compression therapy Market Value (US$ Mn) Forecast, by Technology, 2017-2027
Table 19: Latin America Compression therapy Market Value (US$ Mn) Forecast, by Product, 2017-2027
Table 20: Latin America Compression therapy Market Value (US$ Mn) Forecast, by Compression Pump, 2017-2027
Table 21: Middle East & Africa Compression therapy Market Value (US$ Mn) Forecast, by Country/Sub-region, 2017-2027
Table 22: Middle East & Africa Compression therapy Market Value (US$ Mn) Forecast, by Technology, 2017-2027
Table 23: Middle East & Africa Compression therapy Market Value (US$ Mn) Forecast, by Product, 2017-2027
Table 24: Middle East & Africa Compression therapy Market Value (US$ Mn) Forecast, by Compression Pump, 2017-2027
List of Figures
Figure 1: Global Compression therapy Market Value (US$ Mn) and Distribution (%), by Region, 2018 and 2027
Figure 2: Global Compression therapy Market Value (US$ Mn) and Forecast, 2019-2027
Figure 3: Global Compression therapy Market Value Share (%), by Technology, 2018
Figure 4: Global Compression therapy Market Value Share (%), by Product, 2018
Figure 5: Global Compression therapy Market Value Share (%), by Region, 2018
Figure 6: Global Compression therapy Market Value Share Analysis, by Technology, 2018 and 2027
Figure 7: Global Compression therapy Market Attractiveness, by Technology, 2019-2027
Figure 8: Global Compression therapy Market Revenue (US$ Mn) and Y-o-Y Growth (%), by Static, 2017-2027
Figure 9: Global Compression therapy Market Revenue (US$ Mn) and Y-o-Y Growth (%), by Dynamic, 2017-2027
Figure 10: Global Compression therapy Market Value Share Analysis, by Product, 2018 and 2027
Figure 11: Global Compression therapy Market Attractiveness, by Product, 2019-2027
Figure 12: Global Compression therapy Market Revenue (US$ Mn) and Y-o-Y Growth (%), by Compression Pumps, 2017-2027
Figure 13: Global Compression therapy Market Revenue (US$ Mn) and Y-o-Y Growth (%), by Compression Stocking, 2017-2027
Figure 14: Global Compression therapy Market Revenue (US$ Mn) and Y-o-Y Growth (%), by Compression Bandages, 2017-2027
Figure 15: Global Compression therapy Market Revenue (US$ Mn) and Y-o-Y Growth (%), by Compression Tapes, 2017-2027
Figure 16: Global Compression therapy Market Value Share, by Region, 2018 and 2027
Figure 17: Global Compression therapy Market Attractiveness, by Region, 2019-2027
Figure 18: North America Compression therapy Market Value (US$ Mn) Forecast and Y-o-Y Growth (%) Projection, 2017-2027
Figure 19: North America Compression therapy Market Value Share Analysis, by Country, 2018 and 2027
Figure 20: North America Compression therapy Market Attractiveness, by Country, 2019-2027
Figure 21: North America Compression therapy Market Value Share Analysis, by Technology, 2018 and 2027
Figure 22: North America Compression therapy Market Attractiveness, by Technology, 2019-2027
Figure 23: North America Compression therapy Market Value Share Analysis, by Product, 2018 and 2027
Figure 24: North America Compression therapy Market Attractiveness, by Product, 2019-2027
Figure 25: Europe Compression therapy Market Value (US$ Mn) Forecast and Y-o-Y Growth (%) Projection, 2017-2027
Figure 26: Europe Compression therapy Market Value Share Analysis, by Country/Sub-region, 2018 and 2027
Figure 27: Europe Compression therapy Market Attractiveness, by Country/Sub-region, 2019-2027
Figure 28: Europe Compression therapy Market Value Share Analysis, by Technology, 2018 and 2027
Figure 29: Europe Compression therapy Market Attractiveness, by Technology, 2019-2027
Figure 30: Europe Compression therapy Market Value Share Analysis, by Product, 2018 and 2027
Figure 31: Europe Compression therapy Market Attractiveness, by Product, 2019-2027
Figure 32: Asia Pacific Compression therapy Market Value (US$ Mn) Forecast and Y-o-Y Growth (%) Projection, 2017-2027
Figure 33: Asia Pacific Compression therapy Market Value Share Analysis, by Country/Sub-region, 2018 and 2027
Figure 34: Asia Pacific Compression therapy Market Attractiveness, by Country/Sub-region, 2019-2027
Figure 35: Asia Pacific Compression therapy Market Value Share Analysis, by Technology, 2018 and 2027
Figure 36: Asia Pacific Compression therapy Market Attractiveness, by Technology, 2019-2027
Figure 37: Asia Pacific Compression therapy Market Value Share Analysis, by Product, 2018 and 2027
Figure 38: Asia Pacific Compression therapy Market Attractiveness, by Product, 2019-2027
Figure 39: Latin America Compression therapy Market Value (US$ Mn) Forecast and Y-o-Y Growth (%) Projection, 2017-2027
Figure 40: Latin America Compression therapy Market Value Share Analysis, by Country/Sub-region, 2018 and 2027
Figure 41: Latin America Compression therapy Market Attractiveness, by Country/Sub-region, 2019-2027
Figure 42: Latin America Compression therapy Market Value Share Analysis, by Technology, 2018 and 2027
Figure 43: Latin America Compression therapy Market Attractiveness, by Technology, 2019-2027
Figure 44: Latin America Compression therapy Market Value Share Analysis, by Product, 2018 and 2027
Figure 45: Latin America Compression therapy Market Attractiveness, by Product, 2019-2027
Figure 46: Middle East & Africa Compression therapy Market Value (US$ Mn) Forecast and Y-o-Y Growth (%) Projection, 2017-2027
Figure 47: Middle East & Africa Compression therapy Market Value Share Analysis, by Country/Sub-region, 2018 and 2027
Figure 48: Middle East & Africa Compression therapy Market Attractiveness, by Country/Sub-region, 2019-2027
Figure 49: Middle East & Africa Compression therapy Market Value Share Analysis, by Technology, 2018 and 2027
Figure 50: Middle East & Africa Compression therapy Market Attractiveness, by Technology, 2019-2027
Figure 51: Middle East & Africa Compression therapy Market Value Share Analysis, by Product, 2018 and 2027
Figure 52: Middle East & Africa Compression therapy Market Attractiveness, by Product, 2019-2027
Copyright © Transparency Market Research, Inc. All Rights reserved
Trust Online

Compression Therapy Market