
Reports
Reports
The global chlorine market is foreseen to draw a handsome growth owing to well-paid applications such as ethylene dichloride (EDC)/polyvinyl chloride (PVC), aromatics, propylene oxide, isocyanates, and chlorinated intermediaries. Prophesied to account for a higher consumption of chlorine, EDC/PVC could be highly demanded in the prospering construction sector. Asia Pacific is foretold to be a choice market for capacity expansion, taking in view the rising demands from the booming chemicals sector and plastics industry. Increasing residential requirements in India and China could script the growth of business prospects in the market.
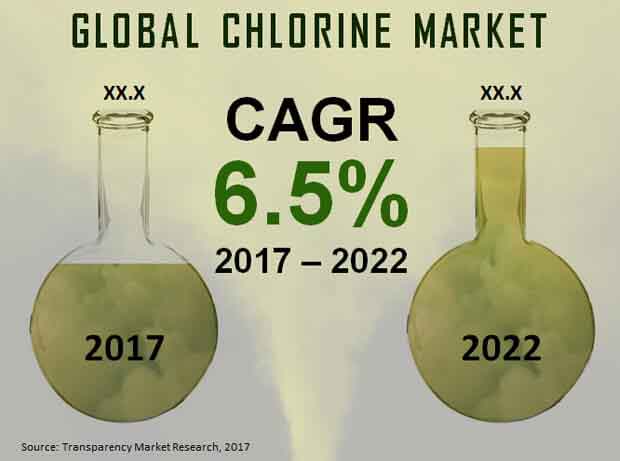
The global chlorine market is predicted to rise at a 6.5% CAGR to achieve a US$42.7 bn by the completion of 2022. In 2017, the market earned a US$31.1 bn.
The world chlorine market is prognosticated to see a classification into vinyls, organic chemicals, water treatment, and chlorinated intermediates, as per the segmentation by end use. By the end of the forecast period, vinyls could account for a king’s share in the market while earning a revenue of US$19.5 bn. On an annual basis, this end-use segment is estimated to expand at a US$1.0 bn between 2017 and 2022. The absolute growth garnered by the segment could be greater than any other in the same segmentation class. The dominance of vinyls in the market could be witnessed throughout the course of the forecast period.
A proper study of various segmentations of the world chlorine market is envisioned to play an important role in the advancement of players in the foreseeable future. Buyers of the report could be able to understand the growth of each critical segment in advance and accordingly prepare their strategies for future progress in the market.
On the basis of regional segmentation, the international chlorine market is anticipated to award Asia Pacific except Japan (APEJ) for its matchless revenue growth in the coming years. By 2022 end, the region could rake in a US$23.0 bn. It is envisaged to be one of the most lucrative regions for the market. The dominance of APEJ could continue to take shape even until the final forecast year.
Next on the list of most attractive markets for chlorine could be North America with a US$7.4 bn approximated to be earned by 2022. Japan is projected to expand at a CAGR of 6.1%, which could be close to that of North America. With an absolute revenue prospect of US$1.2 bn expected to be achieved during the forecast timeframe, Europe could be another region to look out for favorable opportunities. However, the Middle East and Africa (MEA) is forecasted to showcase a sluggish growth in the near future.
Some of the leading companies operating in the worldwide chlorine market could be Ercros S.A, Olin Corporation, BASF SE, PPG Industries, Occidental Petroleum Corporation, FMC Corporation, Hanwha Chemical Corporation, Ineos Group Ltd., Tata Chemicals Ltd., and Tosoh Corporation.
Extensive Use in Several Chemical Processes to Benefit Global Chlorine Market
Chlorine is utilized as a raw material in a wide variety of chemical applications. It is also a necessary material in the manufacturing of PVC, which is in high demand in the packaging, automotive, and construction industries. The global chlorine market is expected to be driven by these factors. The rising demand for chlorine in numerous industrial applications for the production of various intermediate products such as chlorides, hydrochloric acid, and other chemicals is anticipated to fuel growth of the market.
The continuing global pandemic, as well as the accompanying guidelines designed to resolve public health and safety issues, has resulted in an increase in demand for disinfectant products. Companies all over the world are increasing production to meet the unexpected surge in demand from individual households, municipal authorities, grocery stores, and healthcare organizations.
Demand to Gather Momentum from High Use of Chlorine in the Water Treatment Process
Chlorine derivatives are often utilized in metal separation, organic and inorganic chemicals, disinfection, bleaching, and among other things. Chlorine is widely regarded as a powerful disinfectant that is commonly utilized in the process of water treatment. Demand for chlorine in water treatment is projected to increase as the industrial water treatment industry and residential sector are set to expand. In the papermaking process, caustic soda from the chlorine industry is utilized to pulp wood chips. Chlorine compounds also find use in the bleaching of wood and paper pulp. As a result, the expansion of the paper industry is anticipated to push the global chlorine market forward.
In the agriculture industry, different inorganic chlorides are also utilized. Phosphorus and sulphur chlorides, for example, are required as intermediates in agrochemicals like herbicides and pesticides. Such extensive use of the chemical is anticipated to support growth of the global chlorine market in the years to come. Volatility in price, owing to inconsistent demand and supply, are anticipated to be an obstacle for major industry players in the Asia Pacific region. When chlorine is exposed to other substances, it becomes extremely reactive, increasing the possibility of mishandling. Chlorine's toxicological effects contribute to difficulties of the market.
1. Global Chlorine Market - Executive Summary
2. Global Chlorine Market Overview
2.1. Introduction
2.1.1. Global Chlorine Market Taxonomy
2.1.2. Global Chlorine Market Definition
2.2. Global Chlorine Market Size (US$ Mn) and Forecast, 2012-2022
2.2.1. Global Chlorine Market Y-o-Y Growth
2.3. Global Chlorine Market Dynamics
2.4. Supply Chain
2.5. Cost Structure
2.6. Pricing Analysis
2.7. Raw Material Sourcing Strategy and Analysis
2.8. Supplier List
2.9. Key Participants Market Presence (Intensity Map) By Region
3. Global Chlorine Market Analysis and Forecast By End Use
3.1. Global Chlorine Market Size and Forecast By End Use, 2012-2022
3.1.1. Vinyls Market Size and Forecast, 2012-2022
3.1.1.1. Revenue (US$ Mn) Comparison, By Region
3.1.1.2. Market Share Comparison, By Region
3.1.1.3. Y-o-Y growth Comparison, By Region
3.1.2. Organic Chemicals Market Size and Forecast, 2012-2022
3.1.2.1. Revenue (US$ Mn) Comparison, By Region
3.1.2.2. Market Share Comparison, By Region
3.1.2.3. Y-o-Y growth Comparison, By Region
3.1.3. Water Treatment Market Size and Forecast, 2012-2022
3.1.3.1. Revenue (US$ Mn) Comparison, By Region
3.1.3.2. Market Share Comparison, By Region
3.1.3.3. Y-o-Y growth Comparison, By Region
3.1.4. Chlorinated Intermediates Market Size and Forecast, 2012-2022
3.1.4.1. Revenue (US$ Mn) Comparison, By Region
3.1.4.2. Market Share Comparison, By Region
3.1.4.3. Y-o-Y growth Comparison, By Region
4. Global Chlorine Market Analysis and Forecast By Region
4.1. Global Chlorine Market Size and Forecast, 2012-2022
4.1.1. North America Chlorine Market Size and Forecast, 2012-2022
4.1.1.1. Revenue (US$ Mn) Comparison, By End Use
4.1.2. Latin America Chlorine Market Size and Forecast, 2012-2022
4.1.2.1. Revenue (US$ Mn) Comparison, By End Use
4.1.3. Europe Chlorine Market Size and Forecast, 2012-2022
4.1.3.1. Revenue (US$ Mn) Comparison, By End Use
4.1.4. Japan Chlorine Market Size and Forecast, 2012-2022
4.1.4.1. Revenue (US$ Mn) Comparison, By End Use
4.1.5. Japan Chlorine Market Size and Forecast, 2012-2022
4.1.5.1. Revenue (US$ Mn) Comparison, By End Use
4.1.6. MEA Chlorine Market Size and Forecast, 2012-2022
4.1.6.1. Revenue (US$ Mn) Comparison, By End Use
5. North America Chlorine Market Analysis and Forecast, By Country, 2012-2022
5.1. US Chlorine Market Size and Forecast, 2012-2022
5.1.1. Revenue (US$ Mn) Comparison, By End Use
5.2. Canada Chlorine Market Size and Forecast, 2012-2022
5.2.1. Revenue (US$ Mn) Comparison, By End Use
6. Latin America Chlorine Market Analysis and Forecast, By Country, 2012-2022
6.1. Chlorine Market Size and Forecast, 2012-2022
6.1.1. Revenue (US$ Mn) Comparison, By End Use
6.2. Mexico Chlorine Market Size and Forecast, 2012-2022
6.2.1. Revenue (US$ Mn) Comparison, By End Use
6.3. Argentina Chlorine Market Size and Forecast, 2012-2022
6.3.1. Revenue (US$ Mn) Comparison, By End Use
7. Europe Chlorine Market Analysis and Forecast, By Country, 2012-2022
7.1. Germany Chlorine Market Size and Forecast, 2012-2022
7.1.1. Revenue (US$ Mn) Comparison, By End Use
7.2. France Chlorine Market Size and Forecast, 2012-2022
7.2.1. Revenue (US$ Mn) Comparison, By End Use
7.3. U.K. Chlorine Market Size and Forecast, 2012-2022
7.3.1. Revenue (US$ Mn) Comparison, By End Use
7.4. Italy Chlorine Market Size and Forecast, 2012-2022
7.4.1. Revenue (US$ Mn) Comparison, By End Use
7.5. Spain Chlorine Market Size and Forecast, 2012-2022
7.5.1. Revenue (US$ Mn) Comparison, By End Use
7.6. Spain Chlorine Market Size and Forecast, 2012-2022
7.6.1. Revenue (US$ Mn) Comparison, By End Use
8. Japan Chlorine Market Analysis and Forecast, By Country, 2012-2022
8.1. Russia Chlorine Market Size and Forecast, 2012-2022
8.1.1. Revenue (US$ Mn) Comparison, By End Use
9. APEJ Chlorine Market Analysis and Forecast, By Country, 2012-2022
9.1. China Chlorine Market Size and Forecast, 2012-2022
9.1.1. Revenue (US$ Mn) Comparison, By End Use
9.2. Korea Chlorine Market Size and Forecast, 2012-2022
9.2.1. Revenue (US$ Mn) Comparison, By End Use
9.3. Taiwan Chlorine Market Size and Forecast, 2012-2022
9.3.1. Revenue (US$ Mn) Comparison, By End Use
9.4. India Chlorine Market Size and Forecast, 2012-2022
9.4.1. Revenue (US$ Mn) Comparison, By End Use
9.5. Malaysia Chlorine Market Size and Forecast, 2012-2022
9.5.1. Revenue (US$ Mn) Comparison, By End Use
9.6. Indonesia Chlorine Market Size and Forecast, 2012-2022
9.6.1. Revenue (US$ Mn) Comparison, By End Use
10. MEA Chlorine Market Analysis and Forecast, By Country, 2012-2022
10.1. GCC Countries Chlorine Market Size and Forecast, 2012-2022
10.1.1. Revenue (US$ Mn) Comparison, By End Use
10.2. South Africa Chlorine Market Size and Forecast, 2012-2022
10.2.1. Revenue (US$ Mn) Comparison, By End Use
11. Global Chlorine Market Company Share, Competition Landscape and Company Profiles
11.1. Company Share Analysis
11.2. Competition Landscape
11.3. Company Profiles
11.3.1. Ercros S.A
11.3.2. Olin Corporation
11.3.3. BASF SE
11.3.4. PPG Industries
11.3.5. Occidental Petroleum Corporation
11.3.6. FMC Corporation
11.3.7. Hanwha Chemical Corporation
11.3.8. Ineos Group Ltd.
11.3.9. Tata Chemicals Ltd.
11.3.10. Tosoh Corporation
12. Research Methodology
13. Secondary and Primary Sources
14. Assumptions and Acronyms
15. Disclaimer
List of Tables
TABLE 1 Global Chlorine Market Value (US$ Mn), 2012-2016
TABLE 2 Global Chlorine Market Value (US$ Mn), 2017-2022
TABLE 3 Global Chlorine Market Value (US$ Mn) and Y-o-Y, 2015-2022
TABLE 4 Global Vinyls Segment Value (US$ Mn), By Region 2012-2016
TABLE 5 Global Vinyls Segment Value (US$ Mn), By Region 2017-2022
TABLE 6 Global Vinyls Segment Market Share, By Region 2012-2016
TABLE 7 Global Vinyls Segment Market Share, By Region 2017-2022
TABLE 8 Global Vinyls Segment Y-o-Y, By Region 2015-2022
TABLE 9 Global Organic Chemicals Segment Value (US$ Mn), By Region 2012-2016
TABLE 10 Global Organic Chemicals Segment Value (US$ Mn), By Region 2017-2022
TABLE 11 Global Organic Chemicals Segment Market Share, By Region 2012-2016
TABLE 12 Global Organic Chemicals Segment Market Share, By Region 2017-2022
TABLE 13 Global Organic Chemicals Segment Y-o-Y, By Region 2015-2022
TABLE 14 Global Water Treatment Segment Value (US$ Mn), By Region 2012-2016
TABLE 15 Global Water Treatment Segment Value (US$ Mn), By Region 2017-2022
TABLE 16 Global Water Treatment Segment Market Share, By Region 2012-2016
TABLE 17 Global Water Treatment Segment Market Share, By Region 2017-2022
TABLE 18 Global Water Treatment Segment Y-o-Y, By Region 2015-2022
TABLE 19 Global Chlorinated Intermediates Segment Value (US$ Mn), By Region 2012-2016
TABLE 20 Global Chlorinated Intermediates Segment Value (US$ Mn), By Region 2017-2022
TABLE 21 Global Chlorinated Intermediates Segment Market Share, By Region 2012-2016
TABLE 22 Global Chlorinated Intermediates Segment Market Share, By Region 2017-2022
TABLE 23 Global Chlorinated Intermediates Segment Y-o-Y, By Region 2015-2022
TABLE 24 North America Chlorine Market Value (US$ Mn), By End Use 2012-2016
TABLE 25 North America Chlorine Market Value (US$ Mn), By End Use 2017-2022
TABLE 26 Latin America Chlorine Market Value (US$ Mn), By End Use 2012-2016
TABLE 27 Latin America Chlorine Market Value (US$ Mn), By End Use 2017-2022
TABLE 28 Europe Chlorine Market Value (US$ Mn), By End Use 2012-2016
TABLE 29 Europe Chlorine Market Value (US$ Mn), By End Use 2017-2022
TABLE 30 Japan Chlorine Market Value (US$ Mn), By End Use 2012-2016
TABLE 31 Japan Chlorine Market Value (US$ Mn), By End Use 2017-2022
TABLE 32 APEJ Chlorine Market Value (US$ Mn), By End Use 2012-2016
TABLE 33 APEJ Chlorine Market Value (US$ Mn), By End Use 2017-2022
TABLE 34 MEA Chlorine Market Value (US$ Mn), By End Use 2012-2016
TABLE 35 MEA Chlorine Market Value (US$ Mn), By End Use 2017-2022
TABLE 36 US Chlorine Market Value (US$ Mn), By End Use 2012-2016
TABLE 37 US Chlorine Market Value (US$ Mn), By End Use 2017-2022
TABLE 38 Canada Chlorine Market Value (US$ Mn), By End Use 2012-2016
TABLE 39 Canada Chlorine Market Value (US$ Mn), By End Use 2017-2022
TABLE 40 Brazil Chlorine Market Value (US$ Mn), By End Use 2012-2016
TABLE 41 Brazil Chlorine Market Value (US$ Mn), By End Use 2017-2022
TABLE 42 Mexico Chlorine Market Value (US$ Mn), By End Use 2012-2016
TABLE 43 Mexico Chlorine Market Value (US$ Mn), By End Use 2017-2022
TABLE 44 Argentina Chlorine Market Value (US$ Mn), By End Use 2012-2016
TABLE 45 Argentina Chlorine Market Value (US$ Mn), By End Use 2017-2022
TABLE 46 Germany Chlorine Market Value (US$ Mn), By End Use 2012-2016
TABLE 47 Germany Chlorine Market Value (US$ Mn), By End Use 2017-2022
TABLE 48 France Chlorine Market Value (US$ Mn), By End Use 2012-2016
TABLE 49 France Chlorine Market Value (US$ Mn), By End Use 2017-2022
TABLE 50 U.K. Chlorine Market Value (US$ Mn), By End Use 2012-2016
TABLE 51 U.K. Chlorine Market Value (US$ Mn), By End Use 2017-2022
TABLE 52 Italy Chlorine Market Value (US$ Mn), By End Use 2012-2016
TABLE 53 Italy Chlorine Market Value (US$ Mn), By End Use 2017-2022
TABLE 54 Spain Chlorine Market Value (US$ Mn), By End Use 2012-2016
TABLE 55 Spain Chlorine Market Value (US$ Mn), By End Use 2017-2022
TABLE 56 Russia Chlorine Market Value (US$ Mn), By End Use 2012-2016
TABLE 57 Russia Chlorine Market Value (US$ Mn), By End Use 2017-2022
TABLE 58 Japan Chlorine Market Value (US$ Mn), By End Use 2012-2016
TABLE 59 Japan Chlorine Market Value (US$ Mn), By End Use 2017-2022
TABLE 60 China Chlorine Market Value (US$ Mn), By End Use 2012-2016
TABLE 61 China Chlorine Market Value (US$ Mn), By End Use 2017-2022
TABLE 62 Korea Chlorine Market Value (US$ Mn), By End Use 2012-2016
TABLE 63 Korea Chlorine Market Value (US$ Mn), By End Use 2017-2022
TABLE 64 Taiwan Chlorine Market Value (US$ Mn), By End Use 2012-2016
TABLE 65 Taiwan Chlorine Market Value (US$ Mn), By End Use 2017-2022
TABLE 66 India Chlorine Market Value (US$ Mn), By End Use 2012-2016
TABLE 67 India Chlorine Market Value (US$ Mn), By End Use 2017-2022
TABLE 68 Malaysia Chlorine Market Value (US$ Mn), By End Use 2012-2016
TABLE 69 Malaysia Chlorine Market Value (US$ Mn), By End Use 2017-2022
TABLE 70 Indonesia Chlorine Market Value (US$ Mn), By End Use 2012-2016
TABLE 71 Indonesia Chlorine Market Value (US$ Mn), By End Use 2017-2022
TABLE 72 GCC Countries Chlorine Market Value (US$ Mn), By End Use 2012-2016
TABLE 73 GCC Countries Chlorine Market Value (US$ Mn), By End Use 2017-2022
TABLE 74 South Africa Chlorine Market Value (US$ Mn), By End Use 2012-2016
TABLE 75 South Africa Chlorine Market Value (US$ Mn), By End Use 2017-2022
List of Figures
FIG. 1 Global Chlorine Market Value (US$ Mn), 2012-2016
FIG. 2 Global Chlorine Market Value (US$ Mn) Forecast, 2017-2022
FIG. 3 Global Chlorine Market Value (US$ Mn) and Y-o-Y, 2015-2022
FIG. 4 Global Vinyls Segment Market Value (US$ Mn) By Region, 2012-2016
FIG. 5 Global Vinyls Segment Market Value (US$ Mn) By Region, 2017-2022
FIG. 6 Global Vinyls Segment Y-o-Y Growth Rate, By Region, 2015-2022
FIG. 7 Global Organic Chemicals Segment Market Value (US$ Mn) By Region, 2012-2016
FIG. 8 Global Organic Chemicals Segment Market Value (US$ Mn) By Region, 2017-2022
FIG. 9 Global Organic Chemicals Segment Y-o-Y Growth Rate, By Region, 2015-2022
FIG. 10 Global Water Treatment Segment Market Value (US$ Mn) By Region, 2012-2016
FIG. 11 Global Water Treatment Segment Market Value (US$ Mn) By Region, 2017-2022
FIG. 12 Global Water Treatment Segment Y-o-Y Growth Rate, By Region, 2015-2022
FIG. 13 Global Chlorinated Intermediates Segment Market Value (US$ Mn) By Region, 2012-2016
FIG. 14 Global Chlorinated Intermediates Segment Market Value (US$ Mn) By Region, 2017-2022
FIG. 15 Global Chlorinated Intermediates Segment Y-o-Y Growth Rate, By Region, 2015-2022
FIG. 16 North America Chlorine Market Value (US$ Mn), By End Use 2012-2016
FIG. 17 North America Chlorine Market Value (US$ Mn), By End Use 2017-2022
FIG. 18 Latin America Chlorine Market Value (US$ Mn), By End Use 2012-2016
FIG. 19 Latin America Chlorine Market Value (US$ Mn), By End Use 2017-2022
FIG. 20 Europe Chlorine Market Value (US$ Mn), By End Use 2012-2016
FIG. 21 Europe Chlorine Market Value (US$ Mn), By End Use 2017-2022
FIG. 22 Japan Chlorine Market Value (US$ Mn), By End Use 2012-2016
FIG. 23 Japan Chlorine Market Value (US$ Mn), By End Use 2017-2022
FIG. 24 APEJ Chlorine Market Value (US$ Mn), By End Use 2012-2016
FIG. 25 APEJ Chlorine Market Value (US$ Mn), By End Use 2017-2022
FIG. 26 MEA Chlorine Market Value (US$ Mn), By End Use 2012-2016
FIG. 27 MEA Chlorine Market Value (US$ Mn), By End Use 2017-2022
Copyright © Transparency Market Research, Inc. All Rights reserved
Trust Online

Chlorine Market