
Reports
Reports
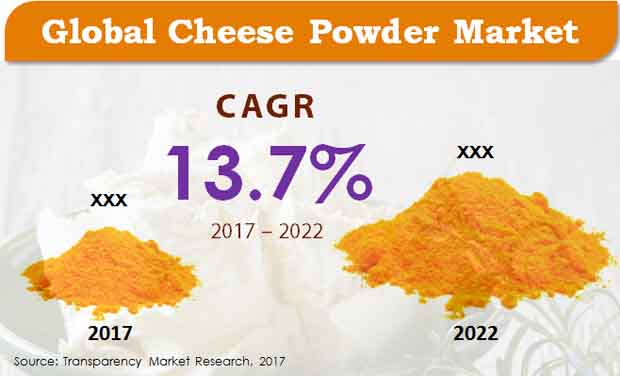
Global Cheese Powder Market: Snapshot
As cheese adds nutrition, taste, and a longer shelf life to food products, its demand in a wide array of food and beverages is rising substantially. Consequently, the global cheese powder market is also witnessing a tremendous increase in its valuation and expansion in its market size. Cheese powder is mainly utilized to add flavors to instant food items, baked food, and seasonings. With the changing lifestyles, where consumers do not have enough time to cook a complete and nutritious meal, they tend to cover up with ready-to-eat meal with nutritious value, which requires cheese powder.
As per Transparency Market Research (TMR), the worldwide market for cheese powder is anticipated offer an opportunity worth US$355.9 mn by 2017. Further, the market is projected to strengthen at an impressive CAGR of 13.70% over the period from 2017 to 2022 and reach a value of US$677 mn by the end of 2022.
Demand for Cheddar Cheese to Continue to be Strong
The global market for cheese powder is broadly assessed on the basis of the type of the product, end user, and the application. Based on the type of product, the market is segmented into Swiss cheese powder, cheddar cheese powder, mozzarella cheese powder, parmesan cheese powder, and blue cheese powder. The demand for cheddar cheese powder is comparatively greater than other types of cheese powder, making it the leading product segment of the global cheese powder market. Cheddar cheese powder is likely to remain witnessing a strong demand over the next few years, thanks to the increasing preference for convenience food items across the world.
By the application, the worldwide market for cheese powder is categorized into sweet and savory snacks, bakery and confectionery, ready meals, sauces, dips, dressings, and condiments. Sauces dips, dressings, and condiments are reporting the most prominent demand for cheese powder, worldwide, and is closely followed by sweet and savory snacks. Various industries, such as food and beverages, and individual consumers have surfaced as the key end user of cheese powder, globally.
North America to Remain Top Consumer of Cheese Powder in Near Future
In terms of the geography, the worldwide market for cheese powder is spread across Europe, Asia Pacific excluding Japan (APEJ), North America, Latin America, the Middle East and Africa (MEA), and Japan. Proliferating at a CAGR of 12.70% between 2017 and 2022, North America, the current market leader, is anticipated to continue on the top over the next few years. The increasing preference for convenience food items among consumers is the key factor behind the substantial rise on this regional market. With the augmenting consumer pool of ready-to-eat meals, Europe is also registering a steady rise in its cheese powder market.
Among other regional markets, Asia Pacific excluding Japan is expected to demonstrate the most promising opportunities for growth in the near future, owing the high population density in this region. The rise in disposable income of consumer, enabling them to afford expensive food products, is also projected to propel the APEJ market for cheese powder in the years to come.
Kraft Heinz Co., Kerry Group Plc, Thornico A/S, Dairy Farmers of America Inc., Land O'Lakes Inc., Bluegrass Dairy & Food Inc., All American Foods Inc., Aarkay Food Products Ltd., Kanegrade Ltd., and Archer-Daniels-Midland Co. are some of the leading cheese powder vendors across the world.
Booming Popularity among the Global Populace to Boost the Growth Opportunities across the Cheese Powder Market
Cheese has emerged as a favorite food item among a massive chunk of the global populace. The growing commercialization of cheese across the food sector and the development of many varieties related to cheese are further helping in increasing the popularity. Cheese powder is one of the varieties. The extensive popularity of cheese powder among many individuals will bring tremendous growth opportunities. Based on all these factors, the global cheese powder market will witness promising growth opportunities across the assessment period of 2017-2022.
1. Global Cheese Powder Market - Executive Summary
2. Global Cheese Powder Market Overview
2.1. Introduction
2.1.1. Global Cheese Powder Market Taxonomy
2.1.2. Global Cheese Powder Market Definition
2.2. Global Cheese Powder Market Size (US$ Mn) and Forecast, 2012-2022
2.2.1. Global Cheese Powder Market Y-o-Y Growth
2.3. Global Cheese Powder Market Dynamics
2.4. Supply Chain
2.5. Cost Structure
2.6. Parent Market Overview
2.7. Key Developments Regional
2.8. List of Distributors
2.9. Key Participants Market Presence (Intensity Map) By Region
3. Global Cheese Powder Market Analysis and Forecast By Product Type
3.1. Global Cheese Powder Market Size and Forecast By Product Type, 2012-2022
3.1.1. Cheddar Market Size and Forecast, 2012-2022
3.1.1.1. Revenue (US$ Mn) Comparison, By Region
3.1.1.2. Market Share Comparison, By Region
3.1.1.3. Y-o-Y growth Comparison, By Region
3.1.2. Swiss Market Size and Forecast, 2012-2022
3.1.2.1. Revenue (US$ Mn) Comparison, By Region
3.1.2.2. Market Share Comparison, By Region
3.1.2.3. Y-o-Y growth Comparison, By Region
3.1.3. Mozzarella Market Size and Forecast, 2012-2022
3.1.3.1. Revenue (US$ Mn) Comparison, By Region
3.1.3.2. Market Share Comparison, By Region
3.1.3.3. Y-o-Y growth Comparison, By Region
3.1.4. Parmesan Market Size and Forecast, 2012-2022
3.1.4.1. Revenue (US$ Mn) Comparison, By Region
3.1.4.2. Market Share Comparison, By Region
3.1.4.3. Y-o-Y growth Comparison, By Region
3.1.5. Blue Market Size and Forecast, 2012-2022
3.1.5.1. Revenue (US$ Mn) Comparison, By Region
3.1.5.2. Market Share Comparison, By Region
3.1.5.3. Y-o-Y growth Comparison, By Region
3.1.6. Others Market Size and Forecast, 2012-2022
3.1.6.1. Revenue (US$ Mn) Comparison, By Region
3.1.6.2. Market Share Comparison, By Region
3.1.6.3. Y-o-Y growth Comparison, By Region
4. Global Cheese Powder Market Analysis and Forecast By End User
4.1. Global Cheese Powder Market Size and Forecast By End User, 2012-2022
4.1.1. Industrial Market Size and Forecast, 2012-2022
4.1.1.1. Revenue (US$ Mn) Comparison, By Region
4.1.1.2. Market Share Comparison, By Region
4.1.1.3. Y-o-Y growth Comparison, By Region
4.1.2. Individual Consumer Market Size and Forecast, 2012-2022
4.1.2.1. Revenue (US$ Mn) Comparison, By Region
4.1.2.2. Market Share Comparison, By Region
4.1.2.3. Y-o-Y growth Comparison, By Region
5. Global Cheese Powder Market Analysis and Forecast By Application
5.1. Global Cheese Powder Market Size and Forecast By Application, 2012-2022
5.1.1. Bakery & confectionery Market Size and Forecast, 2012-2022
5.1.1.1. Revenue (US$ Mn) Comparison, By Region
5.1.1.2. Market Share Comparison, By Region
5.1.1.3. Y-o-Y growth Comparison, By Region
5.1.2. Sweet & Savory Snacks Market Size and Forecast, 2012-2022
5.1.2.1. Revenue (US$ Mn) Comparison, By Region
5.1.2.2. Market Share Comparison, By Region
5.1.2.3. Y-o-Y growth Comparison, By Region
5.1.3. Sauces, Dressings, Dips, and Condiments Market Size and Forecast, 2012-2022
5.1.3.1. Revenue (US$ Mn) Comparison, By Region
5.1.3.2. Market Share Comparison, By Region
5.1.3.3. Y-o-Y growth Comparison, By Region
5.1.4. Ready Meals Market Size and Forecast, 2012-2022
5.1.4.1. Revenue (US$ Mn) Comparison, By Region
5.1.4.2. Market Share Comparison, By Region
5.1.4.3. Y-o-Y growth Comparison, By Region
5.1.5. Other Application Market Size and Forecast, 2012-2022
5.1.5.1. Revenue (US$ Mn) Comparison, By Region
5.1.5.2. Market Share Comparison, By Region
5.1.5.3. Y-o-Y growth Comparison, By Region
6. Global Cheese Powder Market Analysis and Forecast By Region
6.1. Global Cheese Powder Market Size and Forecast, 2012-2022
6.1.1. North America Cheese Powder Market Size and Forecast, 2012-2022
6.1.1.1. Revenue (US$ Mn) Comparison, By Product Type
6.1.1.2. Revenue (US$ Mn) Comparison, By End User
6.1.1.3. Revenue (US$ Mn) Comparison, By Application
6.1.2. Latin America Cheese Powder Market Size and Forecast, 2012-2022
6.1.2.1. Revenue (US$ Mn) Comparison, By Product Type
6.1.2.2. Revenue (US$ Mn) Comparison, By End User
6.1.2.3. Revenue (US$ Mn) Comparison, By Application
6.1.3. Europe Cheese Powder Market Size and Forecast, 2012-2022
6.1.3.1. Revenue (US$ Mn) Comparison, By Product Type
6.1.3.2. Revenue (US$ Mn) Comparison, By End User
6.1.3.3. Revenue (US$ Mn) Comparison, By Application
6.1.4. Japan Cheese Powder Market Size and Forecast, 2012-2022
6.1.4.1. Revenue (US$ Mn) Comparison, By Product Type
6.1.4.2. Revenue (US$ Mn) Comparison, By End User
6.1.4.3. Revenue (US$ Mn) Comparison, By Application
6.1.5. APEJ Cheese Powder Market Size and Forecast, 2012-2022
6.1.5.1. Revenue (US$ Mn) Comparison, By Product Type
6.1.5.2. Revenue (US$ Mn) Comparison, By End User
6.1.5.3. Revenue (US$ Mn) Comparison, By Application
6.1.6. MEA Cheese Powder Market Size and Forecast, 2012-2022
6.1.6.1. Revenue (US$ Mn) Comparison, By Product Type
6.1.6.2. Revenue (US$ Mn) Comparison, By End User
6.1.6.3. Revenue (US$ Mn) Comparison, By Application
7. North America Cheese Powder Market Analysis and Forecast, By Country, 2012-2022
7.1. US Cheese Powder Market Size and Forecast, 2012-2022
7.1.1. Revenue (US$ Mn) Comparison, By Product Type
7.1.2. Revenue (US$ Mn) Comparison, By End User
7.1.3. Revenue (US$ Mn) Comparison, By Application
7.2. Canada Cheese Powder Market Size and Forecast, 2012-2022
7.2.1. Revenue (US$ Mn) Comparison, By Product Type
7.2.2. Revenue (US$ Mn) Comparison, By End User
7.2.3. Revenue (US$ Mn) Comparison, By Application
8. Latin America Cheese Powder Market Analysis and Forecast, By Country, 2012-2022
8.1. Brazil Cheese Powder Market Size and Forecast, 2012-2022
8.1.1. Revenue (US$ Mn) Comparison, By Product Type
8.1.2. Revenue (US$ Mn) Comparison, By End User
8.1.3. Revenue (US$ Mn) Comparison, By Application
8.2. Mexico Cheese Powder Market Size and Forecast, 2012-2022
8.2.1. Revenue (US$ Mn) Comparison, By Product Type
8.2.2. Revenue (US$ Mn) Comparison, By End User
8.2.3. Revenue (US$ Mn) Comparison, By Application
8.3. Argentina Cheese Powder Market Size and Forecast, 2012-2022
8.3.1. Revenue (US$ Mn) Comparison, By Product Type
8.3.2. Revenue (US$ Mn) Comparison, By End User
8.3.3. Revenue (US$ Mn) Comparison, By Application
9. Europe Cheese Powder Market Analysis and Forecast, By Country, 2012-2022
9.1. Germany Cheese Powder Market Size and Forecast, 2012-2022
9.1.1. Revenue (US$ Mn) Comparison, By Product Type
9.1.2. Revenue (US$ Mn) Comparison, By End User
9.1.3. Revenue (US$ Mn) Comparison, By Application
9.2. UK Cheese Powder Market Size and Forecast, 2012-2022
9.2.1. Revenue (US$ Mn) Comparison, By Product Type
9.2.2. Revenue (US$ Mn) Comparison, By End User
9.2.3. Revenue (US$ Mn) Comparison, By Application
9.3. France Cheese Powder Market Size and Forecast, 2012-2022
9.3.1. Revenue (US$ Mn) Comparison, By Product Type
9.3.2. Revenue (US$ Mn) Comparison, By End User
9.3.3. Revenue (US$ Mn) Comparison, By Application
9.4. Spain Cheese Powder Market Size and Forecast, 2012-2022
9.4.1. Revenue (US$ Mn) Comparison, By Product Type
9.4.2. Revenue (US$ Mn) Comparison, By End User
9.4.3. Revenue (US$ Mn) Comparison, By Application
9.5. Nordic Cheese Powder Market Size and Forecast, 2012-2022
9.5.1. Revenue (US$ Mn) Comparison, By Product Type
9.5.2. Revenue (US$ Mn) Comparison, By End User
9.5.3. Revenue (US$ Mn) Comparison, By Application
9.6. Rest of Europe Cheese Powder Market Size and Forecast, 2012-2022
9.6.1. Revenue (US$ Mn) Comparison, By Product Type
9.6.2. Revenue (US$ Mn) Comparison, By End User
9.6.3. Revenue (US$ Mn) Comparison, By Application
10. Japan Cheese Powder Market Analysis and Forecast, By Country, 2012-2022
10.1. Japan Cheese Powder Market Size and Forecast, 2012-2022
10.1.1. Revenue (US$ Mn) Comparison, By Product Type
10.1.2. Revenue (US$ Mn) Comparison, By End User
10.1.3. Revenue (US$ Mn) Comparison, By Application
11. APEJ Cheese Powder Market Analysis and Forecast, By Country, 2012-2022
11.1. China Cheese Powder Market Size and Forecast, 2012-2022
11.1.1. Revenue (US$ Mn) Comparison, By Product Type
11.1.2. Revenue (US$ Mn) Comparison, By End User
11.1.3. Revenue (US$ Mn) Comparison, By Application
11.2. India Cheese Powder Market Size and Forecast, 2012-2022
11.2.1. Revenue (US$ Mn) Comparison, By Product Type
11.2.2. Revenue (US$ Mn) Comparison, By End User
11.2.3. Revenue (US$ Mn) Comparison, By Application
11.3. Thailand Cheese Powder Market Size and Forecast, 2012-2022
11.3.1. Revenue (US$ Mn) Comparison, By Product Type
11.3.2. Revenue (US$ Mn) Comparison, By End User
11.3.3. Revenue (US$ Mn) Comparison, By Application
11.4. Singapore Cheese Powder Market Size and Forecast, 2012-2022
11.4.1. Revenue (US$ Mn) Comparison, By Product Type
11.4.2. Revenue (US$ Mn) Comparison, By End User
11.4.3. Revenue (US$ Mn) Comparison, By Application
11.5. Australia Cheese Powder Market Size and Forecast, 2012-2022
11.5.1. Revenue (US$ Mn) Comparison, By Product Type
11.5.2. Revenue (US$ Mn) Comparison, By End User
11.5.3. Revenue (US$ Mn) Comparison, By Application
11.6. Rest of APEJ Cheese Powder Market Size and Forecast, 2012-2022
11.6.1. Revenue (US$ Mn) Comparison, By Product Type
11.6.2. Revenue (US$ Mn) Comparison, By End User
11.6.3. Revenue (US$ Mn) Comparison, By Application
12. MEA Cheese Powder Market Analysis and Forecast, By Country, 2012-2022
12.1. GCC Countries Cheese Powder Market Size and Forecast, 2012-2022
12.1.1. Revenue (US$ Mn) Comparison, By Product Type
12.1.2. Revenue (US$ Mn) Comparison, By End User
12.1.3. Revenue (US$ Mn) Comparison, By Application
12.2. South Africa Cheese Powder Market Size and Forecast, 2012-2022
12.2.1. Revenue (US$ Mn) Comparison, By Product Type
12.2.2. Revenue (US$ Mn) Comparison, By End User
12.2.3. Revenue (US$ Mn) Comparison, By Application
12.3. Israel Cheese Powder Market Size and Forecast, 2012-2022
12.3.1. Revenue (US$ Mn) Comparison, By Product Type
12.3.2. Revenue (US$ Mn) Comparison, By End User
12.3.3. Revenue (US$ Mn) Comparison, By Application
12.4. Rest of MEA Cheese Powder Market Size and Forecast, 2012-2022
12.4.1. Revenue (US$ Mn) Comparison, By Product Type
12.4.2. Revenue (US$ Mn) Comparison, By End User
12.4.3. Revenue (US$ Mn) Comparison, By Application
13. Global Cheese Powder Market Company Share, Competition Landscape and Company Profiles
13.1. Company Share Analysis
13.2. Competition Landscape
13.3. Company Profiles
13.3.1. Kerry Group Plc
13.3.2. Land O'Lakes, Inc.
13.3.3. Kraft Heinz Co.
13.3.4. Archer-Daniels-Midland Company
13.3.5. Thornico A/S
13.3.6. Kanegrade Ltd
13.3.7. Bluegrass Dairy & Food, Inc.
13.3.8. Dairy Farmers of America, Inc.
13.3.9. All American Foods, Inc.
13.3.10. Aarkay Food Products Ltd
14. Research Methodology
15. Secondary and Primary Sources
16. Assumptions and Acronyms
17. Disclaimer
List of Tables
TABLE 1 Global Cheese Powder Market Value (US$ Mn), 2012-2016
TABLE 2 Global Cheese Powder Market Value (US$ Mn), 2017-2022
TABLE 3 Global Cheese Powder Market Value (US$ Mn) and Y-o-Y, 2015-2022
TABLE 4 Global Cheddar Segment Value (US$ Mn), By Region 2012-2016
TABLE 5 Global Cheddar Segment Value (US$ Mn), By Region 2017-2022
TABLE 6 Global Cheddar Segment Market Share, By Region 2012-2016
TABLE 7 Global Cheddar Segment Market Share, By Region 2017-2022
TABLE 8 Global Cheddar Segment Y-o-Y, By Region 2015-2022
TABLE 9 Global Swiss Segment Value (US$ Mn), By Region 2012-2016
TABLE 10 Global Swiss Segment Value (US$ Mn), By Region 2017-2022
TABLE 11 Global Swiss Segment Market Share, By Region 2012-2016
TABLE 12 Global Swiss Segment Market Share, By Region 2017-2022
TABLE 13 Global Swiss Segment Y-o-Y, By Region 2015-2022
TABLE 14 Global Mozzarella Segment Value (US$ Mn), By Region 2012-2016
TABLE 15 Global Mozzarella Segment Value (US$ Mn), By Region 2017-2022
TABLE 16 Global Mozzarella Segment Market Share, By Region 2012-2016
TABLE 17 Global Mozzarella Segment Market Share, By Region 2017-2022
TABLE 18 Global Mozzarella Segment Y-o-Y, By Region 2015-2022
TABLE 19 Global Parmesan Segment Value (US$ Mn), By Region 2012-2016
TABLE 20 Global Parmesan Segment Value (US$ Mn), By Region 2017-2022
TABLE 21 Global Parmesan Segment Market Share, By Region 2012-2016
TABLE 22 Global Parmesan Segment Market Share, By Region 2017-2022
TABLE 23 Global Parmesan Segment Y-o-Y, By Region 2015-2022
TABLE 24 Global Blue Segment Value (US$ Mn), By Region 2012-2016
TABLE 25 Global Blue Segment Value (US$ Mn), By Region 2017-2022
TABLE 26 Global Blue Segment Market Share, By Region 2012-2016
TABLE 27 Global Blue Segment Market Share, By Region 2017-2022
TABLE 28 Global Blue Segment Y-o-Y, By Region 2015-2022
TABLE 29 Global Others Segment Value (US$ Mn), By Region 2012-2016
TABLE 30 Global Others Segment Value (US$ Mn), By Region 2017-2022
TABLE 31 Global Others Segment Market Share, By Region 2012-2016
TABLE 32 Global Others Segment Market Share, By Region 2017-2022
TABLE 33 Global Others Segment Y-o-Y, By Region 2015-2022
TABLE 34 Global Industrial Segment Value (US$ Mn), By Region 2012-2016
TABLE 35 Global Industrial Segment Value (US$ Mn), By Region 2017-2022
TABLE 36 Global Industrial Segment Market Share, By Region 2012-2016
TABLE 37 Global Industrial Segment Market Share, By Region 2017-2022
TABLE 38 Global Industrial Segment Y-o-Y, By Region 2015-2022
TABLE 39 Global Individual Consumer Segment Value (US$ Mn), By Region 2012-2016
TABLE 40 Global Individual Consumer Segment Value (US$ Mn), By Region 2017-2022
TABLE 41 Global Individual Consumer Segment Market Share, By Region 2012-2016
TABLE 42 Global Individual Consumer Segment Market Share, By Region 2017-2022
TABLE 43 Global Individual Consumer Segment Y-o-Y, By Region 2015-2022
TABLE 44 Global Bakery & confectionery Segment Value (US$ Mn), By Region 2012-2016
TABLE 45 Global Bakery & confectionery Segment Value (US$ Mn), By Region 2017-2022
TABLE 46 Global Bakery & confectionery Segment Market Share, By Region 2012-2016
TABLE 47 Global Bakery & confectionery Segment Market Share, By Region 2017-2022
TABLE 48 Global Bakery & confectionery Segment Y-o-Y, By Region 2015-2022
TABLE 49 Global Sweet & Savory Snacks Segment Value (US$ Mn), By Region 2012-2016
TABLE 50 Global Sweet & Savory Snacks Segment Value (US$ Mn), By Region 2017-2022
TABLE 51 Global Sweet & Savory Snacks Segment Market Share, By Region 2012-2016
TABLE 52 Global Sweet & Savory Snacks Segment Market Share, By Region 2017-2022
TABLE 53 Global Sweet & Savory Snacks Segment Y-o-Y, By Region 2015-2022
TABLE 54 Global Sauces, Dressings, Dips, and Condiments Segment Value (US$ Mn), By Region 2012-2016
TABLE 55 Global Sauces, Dressings, Dips, and Condiments Segment Value (US$ Mn), By Region 2017-2022
TABLE 56 Global Sauces, Dressings, Dips, and Condiments Segment Market Share, By Region 2012-2016
TABLE 57 Global Sauces, Dressings, Dips, and Condiments Segment Market Share, By Region 2017-2022
TABLE 58 Global Sauces, Dressings, Dips, and Condiments Segment Y-o-Y, By Region 2015-2022
TABLE 59 Global Ready Meals Segment Value (US$ Mn), By Region 2012-2016
TABLE 60 Global Ready Meals Segment Value (US$ Mn), By Region 2017-2022
TABLE 61 Global Ready Meals Segment Market Share, By Region 2012-2016
TABLE 62 Global Ready Meals Segment Market Share, By Region 2017-2022
TABLE 63 Global Ready Meals Segment Y-o-Y, By Region 2015-2022
TABLE 64 Global Other Application Segment Value (US$ Mn), By Region 2012-2016
TABLE 65 Global Other Application Segment Value (US$ Mn), By Region 2017-2022
TABLE 66 Global Other Application Segment Market Share, By Region 2012-2016
TABLE 67 Global Other Application Segment Market Share, By Region 2017-2022
TABLE 68 Global Other Application Segment Y-o-Y, By Region 2015-2022
TABLE 69 North America Cheese Powder Market Value (US$ Mn), By Product Type 2012-2016
TABLE 70 North America Cheese Powder Market Value (US$ Mn), By Product Type 2017-2022
TABLE 71 North America Cheese Powder Market Value (US$ Mn), By End User 2012-2016
TABLE 72 North America Cheese Powder Market Value (US$ Mn), By End User 2017-2022
TABLE 73 North America Cheese Powder Market Value (US$ Mn), By Application 2012-2016
TABLE 74 North America Cheese Powder Market Value (US$ Mn), By Application 2017-2022
TABLE 75 Latin America Cheese Powder Market Value (US$ Mn), By Product Type 2012-2016
TABLE 76 Latin America Cheese Powder Market Value (US$ Mn), By Product Type 2017-2022
TABLE 77 Latin America Cheese Powder Market Value (US$ Mn), By End User 2012-2016
TABLE 78 Latin America Cheese Powder Market Value (US$ Mn), By End User 2017-2022
TABLE 79 Latin America Cheese Powder Market Value (US$ Mn), By Application 2012-2016
TABLE 80 Latin America Cheese Powder Market Value (US$ Mn), By Application 2017-2022
TABLE 81 Europe Cheese Powder Market Value (US$ Mn), By Product Type 2012-2016
TABLE 82 Europe Cheese Powder Market Value (US$ Mn), By Product Type 2017-2022
TABLE 83 Europe Cheese Powder Market Value (US$ Mn), By End User 2012-2016
TABLE 84 Europe Cheese Powder Market Value (US$ Mn), By End User 2017-2022
TABLE 85 Europe Cheese Powder Market Value (US$ Mn), By Application 2012-2016
TABLE 86 Europe Cheese Powder Market Value (US$ Mn), By Application 2017-2022
TABLE 87 Japan Cheese Powder Market Value (US$ Mn), By Product Type 2012-2016
TABLE 88 Japan Cheese Powder Market Value (US$ Mn), By Product Type 2017-2022
TABLE 89 Japan Cheese Powder Market Value (US$ Mn), By End User 2012-2016
TABLE 90 Japan Cheese Powder Market Value (US$ Mn), By End User 2017-2022
TABLE 91 Japan Cheese Powder Market Value (US$ Mn), By Application 2012-2016
TABLE 92 Japan Cheese Powder Market Value (US$ Mn), By Application 2017-2022
TABLE 93 APEJ Cheese Powder Market Value (US$ Mn), By Product Type 2012-2016
TABLE 94 APEJ Cheese Powder Market Value (US$ Mn), By Product Type 2017-2022
TABLE 95 APEJ Cheese Powder Market Value (US$ Mn), By End User 2012-2016
TABLE 96 APEJ Cheese Powder Market Value (US$ Mn), By End User 2017-2022
TABLE 97 APEJ Cheese Powder Market Value (US$ Mn), By Application 2012-2016
TABLE 98 APEJ Cheese Powder Market Value (US$ Mn), By Application 2017-2022
TABLE 99 MEA Cheese Powder Market Value (US$ Mn), By Product Type 2012-2016
TABLE 100 MEA Cheese Powder Market Value (US$ Mn), By Product Type 2017-2022
TABLE 101 MEA Cheese Powder Market Value (US$ Mn), By End User 2012-2016
TABLE 102 MEA Cheese Powder Market Value (US$ Mn), By End User 2017-2022
TABLE 103 MEA Cheese Powder Market Value (US$ Mn), By Application 2012-2016
TABLE 104 MEA Cheese Powder Market Value (US$ Mn), By Application 2017-2022
TABLE 105 US Cheese Powder Market Value (US$ Mn), By Product Type 2012-2016
TABLE 106 US Cheese Powder Market Value (US$ Mn), By Product Type 2017-2022
TABLE 107 US Cheese Powder Market Value (US$ Mn), By End User 2012-2016
TABLE 108 US Cheese Powder Market Value (US$ Mn), By End User 2017-2022
TABLE 109 US Cheese Powder Market Value (US$ Mn), By Application 2012-2016
TABLE 110 US Cheese Powder Market Value (US$ Mn), By Application 2017-2022
TABLE 111 Canada Cheese Powder Market Value (US$ Mn), By Product Type 2012-2016
TABLE 112 Canada Cheese Powder Market Value (US$ Mn), By Product Type 2017-2022
TABLE 113 Canada Cheese Powder Market Value (US$ Mn), By End User 2012-2016
TABLE 114 Canada Cheese Powder Market Value (US$ Mn), By End User 2017-2022
TABLE 115 Canada Cheese Powder Market Value (US$ Mn), By Application 2012-2016
TABLE 116 Canada Cheese Powder Market Value (US$ Mn), By Application 2017-2022
TABLE 117 Brazil Cheese Powder Market Value (US$ Mn), By Product Type 2012-2016
TABLE 118 Brazil Cheese Powder Market Value (US$ Mn), By Product Type 2017-2022
TABLE 119 Brazil Cheese Powder Market Value (US$ Mn), By End User 2012-2016
TABLE 120 Brazil Cheese Powder Market Value (US$ Mn), By End User 2017-2022
TABLE 121 Brazil Cheese Powder Market Value (US$ Mn), By Application 2012-2016
TABLE 122 Brazil Cheese Powder Market Value (US$ Mn), By Application 2017-2022
TABLE 123 Mexico Cheese Powder Market Value (US$ Mn), By Product Type 2012-2016
TABLE 124 Mexico Cheese Powder Market Value (US$ Mn), By Product Type 2017-2022
TABLE 125 Mexico Cheese Powder Market Value (US$ Mn), By End User 2012-2016
TABLE 126 Mexico Cheese Powder Market Value (US$ Mn), By End User 2017-2022
TABLE 127 Mexico Cheese Powder Market Value (US$ Mn), By Application 2012-2016
TABLE 128 Mexico Cheese Powder Market Value (US$ Mn), By Application 2017-2022
TABLE 129 Argentina Cheese Powder Market Value (US$ Mn), By Product Type 2012-2016
TABLE 130 Argentina Cheese Powder Market Value (US$ Mn), By Product Type 2017-2022
TABLE 131 Argentina Cheese Powder Market Value (US$ Mn), By End User 2012-2016
TABLE 132 Argentina Cheese Powder Market Value (US$ Mn), By End User 2017-2022
TABLE 133 Argentina Cheese Powder Market Value (US$ Mn), By Application 2012-2016
TABLE 134 Argentina Cheese Powder Market Value (US$ Mn), By Application 2017-2022
TABLE 135 Germany Cheese Powder Market Value (US$ Mn), By Product Type 2012-2016
TABLE 136 Germany Cheese Powder Market Value (US$ Mn), By Product Type 2017-2022
TABLE 137 Germany Cheese Powder Market Value (US$ Mn), By End User 2012-2016
TABLE 138 Germany Cheese Powder Market Value (US$ Mn), By End User 2017-2022
TABLE 139 Germany Cheese Powder Market Value (US$ Mn), By Application 2012-2016
TABLE 140 Germany Cheese Powder Market Value (US$ Mn), By Application 2017-2022
TABLE 141 UK Cheese Powder Market Value (US$ Mn), By Product Type 2012-2016
TABLE 142 UK Cheese Powder Market Value (US$ Mn), By Product Type 2017-2022
TABLE 143 UK Cheese Powder Market Value (US$ Mn), By End User 2012-2016
TABLE 144 UK Cheese Powder Market Value (US$ Mn), By End User 2017-2022
TABLE 145 UK Cheese Powder Market Value (US$ Mn), By Application 2012-2016
TABLE 146 UK Cheese Powder Market Value (US$ Mn), By Application 2017-2022
TABLE 147 France Cheese Powder Market Value (US$ Mn), By Product Type 2012-2016
TABLE 148 France Cheese Powder Market Value (US$ Mn), By Product Type 2017-2022
TABLE 149 France Cheese Powder Market Value (US$ Mn), By End User 2012-2016
TABLE 150 France Cheese Powder Market Value (US$ Mn), By End User 2017-2022
TABLE 151 France Cheese Powder Market Value (US$ Mn), By Application 2012-2016
TABLE 152 France Cheese Powder Market Value (US$ Mn), By Application 2017-2022
TABLE 153 Spain Cheese Powder Market Value (US$ Mn), By Product Type 2012-2016
TABLE 154 Spain Cheese Powder Market Value (US$ Mn), By Product Type 2017-2022
TABLE 155 Spain Cheese Powder Market Value (US$ Mn), By End User 2012-2016
TABLE 156 Spain Cheese Powder Market Value (US$ Mn), By End User 2017-2022
TABLE 157 Spain Cheese Powder Market Value (US$ Mn), By Application 2012-2016
TABLE 158 Spain Cheese Powder Market Value (US$ Mn), By Application 2017-2022
TABLE 159 Nordic Cheese Powder Market Value (US$ Mn), By Product Type 2012-2016
TABLE 160 Nordic Cheese Powder Market Value (US$ Mn), By Product Type 2017-2022
TABLE 161 Nordic Cheese Powder Market Value (US$ Mn), By End User 2012-2016
TABLE 162 Nordic Cheese Powder Market Value (US$ Mn), By End User 2017-2022
TABLE 163 Nordic Cheese Powder Market Value (US$ Mn), By Application 2012-2016
TABLE 164 Nordic Cheese Powder Market Value (US$ Mn), By Application 2017-2022
TABLE 165 Rest of Europe Cheese Powder Market Value (US$ Mn), By Product Type 2012-2016
TABLE 166 Rest of Europe Cheese Powder Market Value (US$ Mn), By Product Type 2017-2022
TABLE 167 Rest of Europe Cheese Powder Market Value (US$ Mn), By End User 2012-2016
TABLE 168 Rest of Europe Cheese Powder Market Value (US$ Mn), By End User 2017-2022
TABLE 169 Rest of Europe Cheese Powder Market Value (US$ Mn), By Application 2012-2016
TABLE 170 Rest of Europe Cheese Powder Market Value (US$ Mn), By Application 2017-2022
TABLE 171 Japan Cheese Powder Market Value (US$ Mn), By Product Type 2012-2016
TABLE 172 Japan Cheese Powder Market Value (US$ Mn), By Product Type 2017-2022
TABLE 173 Japan Cheese Powder Market Value (US$ Mn), By End User 2012-2016
TABLE 174 Japan Cheese Powder Market Value (US$ Mn), By End User 2017-2022
TABLE 175 Japan Cheese Powder Market Value (US$ Mn), By Application 2012-2016
TABLE 176 Japan Cheese Powder Market Value (US$ Mn), By Application 2017-2022
TABLE 177 China Cheese Powder Market Value (US$ Mn), By Product Type 2012-2016
TABLE 178 China Cheese Powder Market Value (US$ Mn), By Product Type 2017-2022
TABLE 179 China Cheese Powder Market Value (US$ Mn), By End User 2012-2016
TABLE 180 China Cheese Powder Market Value (US$ Mn), By End User 2017-2022
TABLE 181 China Cheese Powder Market Value (US$ Mn), By Application 2012-2016
TABLE 182 China Cheese Powder Market Value (US$ Mn), By Application 2017-2022
TABLE 183 India Cheese Powder Market Value (US$ Mn), By Product Type 2012-2016
TABLE 184 India Cheese Powder Market Value (US$ Mn), By Product Type 2017-2022
TABLE 185 India Cheese Powder Market Value (US$ Mn), By End User 2012-2016
TABLE 186 India Cheese Powder Market Value (US$ Mn), By End User 2017-2022
TABLE 187 India Cheese Powder Market Value (US$ Mn), By Application 2012-2016
TABLE 188 India Cheese Powder Market Value (US$ Mn), By Application 2017-2022
TABLE 189 Thailand Cheese Powder Market Value (US$ Mn), By Product Type 2012-2016
TABLE 190 Thailand Cheese Powder Market Value (US$ Mn), By Product Type 2017-2022
TABLE 191 Thailand Cheese Powder Market Value (US$ Mn), By End User 2012-2016
TABLE 192 Thailand Cheese Powder Market Value (US$ Mn), By End User 2017-2022
TABLE 193 Thailand Cheese Powder Market Value (US$ Mn), By Application 2012-2016
TABLE 194 Thailand Cheese Powder Market Value (US$ Mn), By Application 2017-2022
TABLE 195 Singapore Cheese Powder Market Value (US$ Mn), By Product Type 2012-2016
TABLE 196 Singapore Cheese Powder Market Value (US$ Mn), By Product Type 2017-2022
TABLE 197 Singapore Cheese Powder Market Value (US$ Mn), By End User 2012-2016
TABLE 198 Singapore Cheese Powder Market Value (US$ Mn), By End User 2017-2022
TABLE 199 Singapore Cheese Powder Market Value (US$ Mn), By Application 2012-2016
TABLE 200 Singapore Cheese Powder Market Value (US$ Mn), By Application 2017-2022
TABLE 201 Australia Cheese Powder Market Value (US$ Mn), By Product Type 2012-2016
TABLE 202 Australia Cheese Powder Market Value (US$ Mn), By Product Type 2017-2022
TABLE 203 Australia Cheese Powder Market Value (US$ Mn), By End User 2012-2016
TABLE 204 Australia Cheese Powder Market Value (US$ Mn), By End User 2017-2022
TABLE 205 Australia Cheese Powder Market Value (US$ Mn), By Application 2012-2016
TABLE 206 Australia Cheese Powder Market Value (US$ Mn), By Application 2017-2022
TABLE 207 Rest of APEJ Cheese Powder Market Value (US$ Mn), By Product Type 2012-2016
TABLE 208 Rest of APEJ Cheese Powder Market Value (US$ Mn), By Product Type 2017-2022
TABLE 209 Rest of APEJ Cheese Powder Market Value (US$ Mn), By End User 2012-2016
TABLE 210 Rest of APEJ Cheese Powder Market Value (US$ Mn), By End User 2017-2022
TABLE 211 Rest of APEJ Cheese Powder Market Value (US$ Mn), By Application 2012-2016
TABLE 212 Rest of APEJ Cheese Powder Market Value (US$ Mn), By Application 2017-2022
TABLE 213 GCC Countries Cheese Powder Market Value (US$ Mn), By Product Type 2012-2016
TABLE 214 GCC Countries Cheese Powder Market Value (US$ Mn), By Product Type 2017-2022
TABLE 215 GCC Countries Cheese Powder Market Value (US$ Mn), By End User 2012-2016
TABLE 216 GCC Countries Cheese Powder Market Value (US$ Mn), By End User 2017-2022
TABLE 217 GCC Countries Cheese Powder Market Value (US$ Mn), By Application 2012-2016
TABLE 218 GCC Countries Cheese Powder Market Value (US$ Mn), By Application 2017-2022
TABLE 219 South Africa Cheese Powder Market Value (US$ Mn), By Product Type 2012-2016
TABLE 220 South Africa Cheese Powder Market Value (US$ Mn), By Product Type 2017-2022
TABLE 221 South Africa Cheese Powder Market Value (US$ Mn), By End User 2012-2016
TABLE 222 South Africa Cheese Powder Market Value (US$ Mn), By End User 2017-2022
TABLE 223 South Africa Cheese Powder Market Value (US$ Mn), By Application 2012-2016
TABLE 224 South Africa Cheese Powder Market Value (US$ Mn), By Application 2017-2022
TABLE 225 Israel Cheese Powder Market Value (US$ Mn), By Product Type 2012-2016
TABLE 226 Israel Cheese Powder Market Value (US$ Mn), By Product Type 2017-2022
TABLE 227 Israel Cheese Powder Market Value (US$ Mn), By End User 2012-2016
TABLE 228 Israel Cheese Powder Market Value (US$ Mn), By End User 2017-2022
TABLE 229 Israel Cheese Powder Market Value (US$ Mn), By Application 2012-2016
TABLE 230 Israel Cheese Powder Market Value (US$ Mn), By Application 2017-2022
TABLE 231 Rest of MEA Cheese Powder Market Value (US$ Mn), By Product Type 2012-2016
TABLE 232 Rest of MEA Cheese Powder Market Value (US$ Mn), By Product Type 2017-2022
TABLE 233 Rest of MEA Cheese Powder Market Value (US$ Mn), By End User 2012-2016
TABLE 234 Rest of MEA Cheese Powder Market Value (US$ Mn), By End User 2017-2022
TABLE 235 Rest of MEA Cheese Powder Market Value (US$ Mn), By Application 2012-2016
TABLE 236 Rest of MEA Cheese Powder Market Value (US$ Mn), By Application 2017-2022
List of Figures
FIG. 1 Global Cheese Powder Market Value (US$ Mn), 2012-2016
FIG. 2 Global Cheese Powder Market Value (US$ Mn) Forecast, 2017-2022
FIG. 3 Global Cheese Powder Market Value (US$ Mn) and Y-o-Y, 2015-2022
FIG. 4 Global Cheddar Segment Market Value (US$ Mn) By Region, 2012-2016
FIG. 5 Global Cheddar Segment Market Value (US$ Mn) By Region, 2017-2022
FIG. 6 Global Cheddar Segment Y-o-Y Growth Rate, By Region, 2015-2022
FIG. 7 Global Swiss Segment Market Value (US$ Mn) By Region, 2012-2016
FIG. 8 Global Swiss Segment Market Value (US$ Mn) By Region, 2017-2022
FIG. 9 Global Swiss Segment Y-o-Y Growth Rate, By Region, 2015-2022
FIG. 10 Global Mozzarella Segment Market Value (US$ Mn) By Region, 2012-2016
FIG. 11 Global Mozzarella Segment Market Value (US$ Mn) By Region, 2017-2022
FIG. 12 Global Mozzarella Segment Y-o-Y Growth Rate, By Region, 2015-2022
FIG. 13 Global Parmesan Segment Market Value (US$ Mn) By Region, 2012-2016
FIG. 14 Global Parmesan Segment Market Value (US$ Mn) By Region, 2017-2022
FIG. 15 Global Parmesan Segment Y-o-Y Growth Rate, By Region, 2015-2022
FIG. 16 Global Blue Segment Market Value (US$ Mn) By Region, 2012-2016
FIG. 17 Global Blue Segment Market Value (US$ Mn) By Region, 2017-2022
FIG. 18 Global Blue Segment Y-o-Y Growth Rate, By Region, 2015-2022
FIG. 19 Global Others Segment Market Value (US$ Mn) By Region, 2012-2016
FIG. 20 Global Others Segment Market Value (US$ Mn) By Region, 2017-2022
FIG. 21 Global Others Segment Y-o-Y Growth Rate, By Region, 2015-2022
FIG. 22 Global Industrial Segment Market Value (US$ Mn) By Region, 2012-2016
FIG. 23 Global Industrial Segment Market Value (US$ Mn) By Region, 2017-2022
FIG. 24 Global Industrial Segment Y-o-Y Growth Rate, By Region, 2015-2022
FIG. 25 Global Individual Consumer Segment Market Value (US$ Mn) By Region, 2012-2016
FIG. 26 Global Individual Consumer Segment Market Value (US$ Mn) By Region, 2017-2022
FIG. 27 Global Individual Consumer Segment Y-o-Y Growth Rate, By Region, 2015-2022
FIG. 28 Global Bakery & confectionery Segment Market Value (US$ Mn) By Region, 2012-2016
FIG. 29 Global Bakery & confectionery Segment Market Value (US$ Mn) By Region, 2017-2022
FIG. 30 Global Bakery & confectionery Segment Y-o-Y Growth Rate, By Region, 2015-2022
FIG. 31 Global Sweet & Savory Snacks Segment Market Value (US$ Mn) By Region, 2012-2016
FIG. 32 Global Sweet & Savory Snacks Segment Market Value (US$ Mn) By Region, 2017-2022
FIG. 33 Global Sweet & Savory Snacks Segment Y-o-Y Growth Rate, By Region, 2015-2022
FIG. 34 Global Sauces, Dressings, Dips, and Condiments Segment Market Value (US$ Mn) By Region, 2012-2016
FIG. 35 Global Sauces, Dressings, Dips, and Condiments Segment Market Value (US$ Mn) By Region, 2017-2022
FIG. 36 Global Sauces, Dressings, Dips, and Condiments Segment Y-o-Y Growth Rate, By Region, 2015-2022
FIG. 37 Global Ready Meals Segment Market Value (US$ Mn) By Region, 2012-2016
FIG. 38 Global Ready Meals Segment Market Value (US$ Mn) By Region, 2017-2022
FIG. 39 Global Ready Meals Segment Y-o-Y Growth Rate, By Region, 2015-2022
FIG. 40 Global Other Application Segment Market Value (US$ Mn) By Region, 2012-2016
FIG. 41 Global Other Application Segment Market Value (US$ Mn) By Region, 2017-2022
FIG. 42 Global Other Application Segment Y-o-Y Growth Rate, By Region, 2015-2022
FIG. 43 North America Cheese Powder Market Value (US$ Mn), By Product Type 2012-2016
FIG. 44 North America Cheese Powder Market Value (US$ Mn), By Product Type 2017-2022
FIG. 45 North America Cheese Powder Market Value (US$ Mn), By End User 2012-2016
FIG. 46 North America Cheese Powder Market Value (US$ Mn), By End User 2017-2022
FIG. 47 North America Cheese Powder Market Value (US$ Mn), By Application 2012-2016
FIG. 48 North America Cheese Powder Market Value (US$ Mn), By Application 2017-2022
FIG. 49 Latin America Cheese Powder Market Value (US$ Mn), By Product Type 2012-2016
FIG. 50 Latin America Cheese Powder Market Value (US$ Mn), By Product Type 2017-2022
FIG. 51 Latin America Cheese Powder Market Value (US$ Mn), By End User 2012-2016
FIG. 52 Latin America Cheese Powder Market Value (US$ Mn), By End User 2017-2022
FIG. 53 Latin America Cheese Powder Market Value (US$ Mn), By Application 2012-2016
FIG. 54 Latin America Cheese Powder Market Value (US$ Mn), By Application 2017-2022
FIG. 55 Europe Cheese Powder Market Value (US$ Mn), By Product Type 2012-2016
FIG. 56 Europe Cheese Powder Market Value (US$ Mn), By Product Type 2017-2022
FIG. 57 Europe Cheese Powder Market Value (US$ Mn), By End User 2012-2016
FIG. 58 Europe Cheese Powder Market Value (US$ Mn), By End User 2017-2022
FIG. 59 Europe Cheese Powder Market Value (US$ Mn), By Application 2012-2016
FIG. 60 Europe Cheese Powder Market Value (US$ Mn), By Application 2017-2022
FIG. 61 Japan Cheese Powder Market Value (US$ Mn), By Product Type 2012-2016
FIG. 62 Japan Cheese Powder Market Value (US$ Mn), By Product Type 2017-2022
FIG. 63 Japan Cheese Powder Market Value (US$ Mn), By End User 2012-2016
FIG. 64 Japan Cheese Powder Market Value (US$ Mn), By End User 2017-2022
FIG. 65 Japan Cheese Powder Market Value (US$ Mn), By Application 2012-2016
FIG. 66 Japan Cheese Powder Market Value (US$ Mn), By Application 2017-2022
FIG. 67 APEJ Cheese Powder Market Value (US$ Mn), By Product Type 2012-2016
FIG. 68 APEJ Cheese Powder Market Value (US$ Mn), By Product Type 2017-2022
FIG. 69 APEJ Cheese Powder Market Value (US$ Mn), By End User 2012-2016
FIG. 70 APEJ Cheese Powder Market Value (US$ Mn), By End User 2017-2022
FIG. 71 APEJ Cheese Powder Market Value (US$ Mn), By Application 2012-2016
FIG. 72 APEJ Cheese Powder Market Value (US$ Mn), By Application 2017-2022
FIG. 73 MEA Cheese Powder Market Value (US$ Mn), By Product Type 2012-2016
FIG. 74 MEA Cheese Powder Market Value (US$ Mn), By Product Type 2017-2022
FIG. 75 MEA Cheese Powder Market Value (US$ Mn), By End User 2012-2016
FIG. 76 MEA Cheese Powder Market Value (US$ Mn), By End User 2017-2022
FIG. 77 MEA Cheese Powder Market Value (US$ Mn), By Application 2012-2016
FIG. 78 MEA Cheese Powder Market Value (US$ Mn), By Application 2017-2022
Copyright © Transparency Market Research, Inc. All Rights reserved
Trust Online

Cheese Powder Market