
Reports
Reports
A variety of resin materials have been utilized in making cash and coin deposit bags. The focus is substantial increase in convenience, safety, and security. The cash and coin deposit bags market attracts attention from financial institutions in developed as well as developing economies. These regions veritably present the market with an attractive ground for generating revenue streams. Financial institutions in developed countries are demanding better features in cash and coin deposit bags. These features have a large bearing on improving the security if transactions, such as making them tamper proof and responsive to users’ requirements. This is also a key trend that will propel the future evolution of the market in terms of the uptake of better materials in making cash and coin deposit bags. The degree of opaqueness also depends on the specific need the materials are meant to serve and where are these bags used.
However, a glaring constraint that has restrained the rise in growth of the cash and coin deposit bags market is the rapid transitioning to economies toward digital transactions or being cashless. Several countries have regulatory and technology framework in place to make this possible. Nevertheless, there are some places where the use of cash and coin deposit bags will remain prevalent. For instance, coin deposit bags are popularly used in arcades and laundry machines to collect loose coins. In this regard, self-sealing and tamper-proof cash and coin deposit bags are expected to become popular. Manufacturers are adopting various test technologies to come out with reliable specifications of their use; an instance is the test for hang test of the load. End users also need these bags to be uniquely designed to meet their specific needs. Demand for better reinforcement materials will also propel technological advances in the cash and coin deposit bags market.
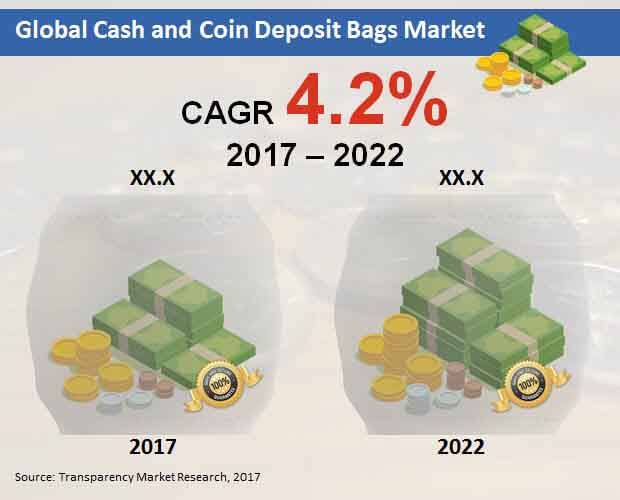
The global cash and coin deposit bags market continues to be driven by increasing focus on secure and safe packaging. Usually manufactured by using multi-layered polymer resins, manufacturers are now incorporating advanced features to boost the quality of end products. Some of the cash and coin deposit bags available in the market have advanced features, such as warning indicator and tamper-evident closures. The enhancement in security features is likely to boost the adoption of cash and coin deposit bags during the assessment period 2017-2022. However, broader macro-economic trends are likely to hinder market growth – many developing economies are making the transition to cashless payments, which is likely to impede sales during the forecast period. The global cash and coin deposit bags market is projected to grow at a CAGR of over 4% CAGR and reach nearly US$ 445 Mn in revenues by the end of the forecast period 2017-2022.
On the basis of material type, the plastic cash and coin deposit bags are likely to witness a higher growth than the global rate and surpass US$ 345 Mn by the end of 2022. Plastic segment continues to be the leading segment on the basis of material type, and it is highly likely that the status quo will continue during the forecast period as well. Wide availability of plastic as a raw material, and low cost of end products are the key factors promoting the use of plastic cash and coin deposit bags.
Financial institutions remain the largest end users of cash and coin deposit bags, accounting for nearly 30% revenue share of the global market. Cash and coin deposit bags are used for safe and secure transactions in financial institutions, owing to which demand has continued to remain steady in this sector. However, owing to shifting preference for cashless and online payments, demand for cash and coin deposit bags is likely to witness a decline in financial institutions during the forecast period.
Europe continues to be the leading market for cash and coin deposit bags and it is highly likely that the status quo will be maintained throughout the forecast period. The Europe cash and coin deposit bags is likely to grow at a CAGR of over 4% throughout the forecast period 2017-2022. Relatively high preference for cash and coin deposit bags among financial institutions in Europe is likely to provide an impetus to the growth of the market in the region. In addition to Europe, Asia Pacific excluding Japan (APEJ) is likely to provide growth opportunities to cash and coin deposit bag manufacturers during the forecast period. Demand for cash and coin deposit bags in APEJ will be influenced by high volume sales of affordable bags.
The leading companies profiled in the report include ProAmpac LLC, Coveris Holdings S.A., Dynaflex Private Limited, NELMAR Security Packaging Systems Inc., KOROZO Ambalaj San. Ve Tic. A.S, Truseal (Pty) Ltd, Illinois Tool Works Inc, Initial Packaging Solutions Ltd., Packaging Horizons Corp, A. Rifkin Co. A number of these companies are focusing on strengthening their global presence so that weaknesses in key markets are offset by growth in lucrative markets. Focus on R&D also remains a key focus area for many companies, as players look to consolidate their position by creating advanced bags that offer a high level of security and convenience. On back of these factors, the global cash and coin deposit bags market is likely to grow at a steady rate during the forecast period.
1. Global Cash & Coin Bags Market - Executive Summary
2. Global Cash & Coin Bags Market Overview
2.1. Introduction
2.1.1. Global Cash & Coin Bags Market Taxonomy
2.1.2. Global Cash & Coin Bags Market Definition
2.2. Global Cash & Coin Bags Market Size (US$ Mn) and Forecast, 2012-2022
2.2.1. Global Cash & Coin Bags Market Y-o-Y Growth
2.3. Global Cash & Coin Bags Market Dynamics
2.4. Supply Chain
2.5. Pricing Analysis
2.6. Cash & Coin Deposit Bags Market: Consumer Survey
2.7. Cash & Coin Deposit Bags Market: Life Cycle Analysis
2.8. List of Distributors
2.9. PEST Analysis
2.10. Key Participants Market Presence (Intensity Map) By Region
3. Global Cash & Coin Bags Market Analysis and Forecast 2012-2022
3.1. Global Cash & Coin Bags Market Size and Forecast By Material Type, 2012-2022
3.1.1. Plastic Market Size and Forecast, 2012-2022
3.1.1.1. Revenue (US$ Mn) Comparison, By Region
3.1.1.2. Market Share Comparison, By Region
3.1.1.3. Y-o-Y growth Comparison, By Region
3.1.2. Paper Market Size and Forecast, 2012-2022
3.1.2.1. Revenue (US$ Mn) Comparison, By Region
3.1.2.2. Market Share Comparison, By Region
3.1.2.3. Y-o-Y growth Comparison, By Region
3.1.3. Fabric Market Size and Forecast, 2012-2022
3.1.3.1. Revenue (US$ Mn) Comparison, By Region
3.1.3.2. Market Share Comparison, By Region
3.1.3.3. Y-o-Y growth Comparison, By Region
3.2. Global Cash & Coin Bags Market Size and Forecast By Product Type, 2012-2022
3.2.1. Opaque Market Size and Forecast, 2012-2022
3.2.1.1. Revenue (US$ Mn) Comparison, By Region
3.2.1.2. Market Share Comparison, By Region
3.2.1.3. Y-o-Y growth Comparison, By Region
3.2.2. Clear Market Size and Forecast, 2012-2022
3.2.2.1. Revenue (US$ Mn) Comparison, By Region
3.2.2.2. Market Share Comparison, By Region
3.2.2.3. Y-o-Y growth Comparison, By Region
3.3. Global Cash & Coin Bags Market Size and Forecast By End Use, 2012-2022
3.3.1. Financial Institution Market Size and Forecast, 2012-2022
3.3.1.1. Revenue (US$ Mn) Comparison, By Region
3.3.1.2. Market Share Comparison, By Region
3.3.1.3. Y-o-Y growth Comparison, By Region
3.3.2. Hospitals Market Size and Forecast, 2012-2022
3.3.2.1. Revenue (US$ Mn) Comparison, By Region
3.3.2.2. Market Share Comparison, By Region
3.3.2.3. Y-o-Y growth Comparison, By Region
3.3.3. Casinos Market Size and Forecast, 2012-2022
3.3.3.1. Revenue (US$ Mn) Comparison, By Region
3.3.3.2. Market Share Comparison, By Region
3.3.3.3. Y-o-Y growth Comparison, By Region
3.3.4. Hotels Market Size and Forecast, 2012-2022
3.3.4.1. Revenue (US$ Mn) Comparison, By Region
3.3.4.2. Market Share Comparison, By Region
3.3.4.3. Y-o-Y growth Comparison, By Region
3.3.5. Retail Chains Market Size and Forecast, 2012-2022
3.3.5.1. Revenue (US$ Mn) Comparison, By Region
3.3.5.2. Market Share Comparison, By Region
3.3.5.3. Y-o-Y growth Comparison, By Region
3.3.6. Government Organization Market Size and Forecast, 2012-2022
3.3.6.1. Revenue (US$ Mn) Comparison, By Region
3.3.6.2. Market Share Comparison, By Region
3.3.6.3. Y-o-Y growth Comparison, By Region
3.3.7. Courier Services Companies Market Size and Forecast, 2012-2022
3.3.7.1. Revenue (US$ Mn) Comparison, By Region
3.3.7.2. Market Share Comparison, By Region
3.3.7.3. Y-o-Y growth Comparison, By Region
3.3.8. Academic Institutions Market Size and Forecast, 2012-2022
3.3.8.1. Revenue (US$ Mn) Comparison, By Region
3.3.8.2. Market Share Comparison, By Region
3.3.8.3. Y-o-Y growth Comparison, By Region
4. North America Cash & Coin Bags Market Size and Forecast, 2012-2022
4.1. Revenue (US$ Mn) Comparison, By Country
4.2. Revenue (US$ Mn) Comparison, By Material Type
4.3. Revenue (US$ Mn) Comparison, By Product Type
4.4. Revenue (US$ Mn) Comparison, By End Use
5. Latin America Cash & Coin Bags Market Size and Forecast, 2012-2022
5.1. Revenue (US$ Mn) Comparison, By Country
5.2. Revenue (US$ Mn) Comparison, By Material Type
5.3. Revenue (US$ Mn) Comparison, By Product Type
5.4. Revenue (US$ Mn) Comparison, By End Use
6. Europe Cash & Coin Bags Market Size and Forecast, 2012-2022
6.1. Revenue (US$ Mn) Comparison, By Country
6.2. Revenue (US$ Mn) Comparison, By Material Type
6.3. Revenue (US$ Mn) Comparison, By Product Type
6.4. Revenue (US$ Mn) Comparison, By End Use
7. Japan Cash & Coin Bags Market Size and Forecast, 2012-2022
7.1. Revenue (US$ Mn) Comparison, By Country
7.2. Revenue (US$ Mn) Comparison, By Material Type
7.3. Revenue (US$ Mn) Comparison, By Product Type
7.4. Revenue (US$ Mn) Comparison, By End Use
8. APEJ Cash & Coin Bags Market Size and Forecast, 2012-2022
8.1. Revenue (US$ Mn) Comparison, By Country
8.2. Revenue (US$ Mn) Comparison, By Material Type
8.3. Revenue (US$ Mn) Comparison, By Product Type
8.4. Revenue (US$ Mn) Comparison, By End Use
9. MEA Cash & Coin Bags Market Size and Forecast, 2012-2022
9.1. Revenue (US$ Mn) Comparison, By Country
9.2. Revenue (US$ Mn) Comparison, By Material Type
9.3. Revenue (US$ Mn) Comparison, By Product Type
9.4. Revenue (US$ Mn) Comparison, By End Use
10. Global Cash & Coin Bags Market Company Share, Competition Landscape and Company Profiles
10.1. Company Share Analysis
10.2. Competition Landscape
10.3. Company Profiles
10.3.1. ProAmpac LLC
10.3.2. Coveris Holdings S.A.
10.3.3. Dynaflex Private Limited
10.3.4. NELMAR Security Packaging Systems Inc.
10.3.5. KOROZO Ambalaj San.ve Tic A.S.
10.3.6. Truseal (Pty) Ltd
10.3.7. Illinois Tool Works Inc
10.3.8. Initial Packaging Solutions Ltd.
10.3.9. A. Rifkin Co
10.3.10. Packaging Horizons Corp
11. Global Cash & Coin Deposit Bag Market Key Takeaways
12. Research Methodology
13. Disclaimer
List of Tables
TABLE 1 Global Cash & Coin Bags Market Value (US$ Mn), 2012-2016
TABLE 2 Global Cash & Coin Bags Market Value (US$ Mn), 2017-2022
TABLE 3 Global Cash & Coin Bags Market Value (US$ Mn) and Y-o-Y, 2015-2022
TABLE 4 Global Plastic Segment Value (US$ Mn), By Region 2012-2016
TABLE 5 Global Plastic Segment Value (US$ Mn), By Region 2017-2022
TABLE 6 Global Plastic Segment Market Share, By Region 2012-2016
TABLE 7 Global Plastic Segment Market Share, By Region 2017-2022
TABLE 8 Global Plastic Segment Y-o-Y, By Region 2015-2022
TABLE 9 Global Paper Segment Value (US$ Mn), By Region 2012-2016
TABLE 10 Global Paper Segment Value (US$ Mn), By Region 2017-2022
TABLE 11 Global Paper Segment Market Share, By Region 2012-2016
TABLE 12 Global Paper Segment Market Share, By Region 2017-2022
TABLE 13 Global Paper Segment Y-o-Y, By Region 2015-2022
TABLE 14 Global Fabric Segment Value (US$ Mn), By Region 2012-2016
TABLE 15 Global Fabric Segment Value (US$ Mn), By Region 2017-2022
TABLE 16 Global Fabric Segment Market Share, By Region 2012-2016
TABLE 17 Global Fabric Segment Market Share, By Region 2017-2022
TABLE 18 Global Fabric Segment Y-o-Y, By Region 2015-2022
TABLE 19 Global Opaque Segment Value (US$ Mn), By Region 2012-2016
TABLE 20 Global Opaque Segment Value (US$ Mn), By Region 2017-2022
TABLE 21 Global Opaque Segment Market Share, By Region 2012-2016
TABLE 22 Global Opaque Segment Market Share, By Region 2017-2022
TABLE 23 Global Opaque Segment Y-o-Y, By Region 2015-2022
TABLE 24 Global Clear Segment Value (US$ Mn), By Region 2012-2016
TABLE 25 Global Clear Segment Value (US$ Mn), By Region 2017-2022
TABLE 26 Global Clear Segment Market Share, By Region 2012-2016
TABLE 27 Global Clear Segment Market Share, By Region 2017-2022
TABLE 28 Global Clear Segment Y-o-Y, By Region 2015-2022
TABLE 29 Global Financial Institution Segment Value (US$ Mn), By Region 2012-2016
TABLE 30 Global Financial Institution Segment Value (US$ Mn), By Region 2017-2022
TABLE 31 Global Financial Institution Segment Market Share, By Region 2012-2016
TABLE 32 Global Financial Institution Segment Market Share, By Region 2017-2022
TABLE 33 Global Financial Institution Segment Y-o-Y, By Region 2015-2022
TABLE 34 Global Hospitals Segment Value (US$ Mn), By Region 2012-2016
TABLE 35 Global Hospitals Segment Value (US$ Mn), By Region 2017-2022
TABLE 36 Global Hospitals Segment Market Share, By Region 2012-2016
TABLE 37 Global Hospitals Segment Market Share, By Region 2017-2022
TABLE 38 Global Hospitals Segment Y-o-Y, By Region 2015-2022
TABLE 39 Global Casinos Segment Value (US$ Mn), By Region 2012-2016
TABLE 40 Global Casinos Segment Value (US$ Mn), By Region 2017-2022
TABLE 41 Global Casinos Segment Market Share, By Region 2012-2016
TABLE 42 Global Casinos Segment Market Share, By Region 2017-2022
TABLE 43 Global Casinos Segment Y-o-Y, By Region 2015-2022
TABLE 44 Global Hotels Segment Value (US$ Mn), By Region 2012-2016
TABLE 45 Global Hotels Segment Value (US$ Mn), By Region 2017-2022
TABLE 46 Global Hotels Segment Market Share, By Region 2012-2016
TABLE 47 Global Hotels Segment Market Share, By Region 2017-2022
TABLE 48 Global Hotels Segment Y-o-Y, By Region 2015-2022
TABLE 49 Global Retail Chains Segment Value (US$ Mn), By Region 2012-2016
TABLE 50 Global Retail Chains Segment Value (US$ Mn), By Region 2017-2022
TABLE 51 Global Retail Chains Segment Market Share, By Region 2012-2016
TABLE 52 Global Retail Chains Segment Market Share, By Region 2017-2022
TABLE 53 Global Retail Chains Segment Y-o-Y, By Region 2015-2022
TABLE 54 Global Government Organization Segment Value (US$ Mn), By Region 2012-2016
TABLE 55 Global Government Organization Segment Value (US$ Mn), By Region 2017-2022
TABLE 56 Global Government Organization Segment Market Share, By Region 2012-2016
TABLE 57 Global Government Organization Segment Market Share, By Region 2017-2022
TABLE 58 Global Government Organization Segment Y-o-Y, By Region 2015-2022
TABLE 59 Global Courier Services Companies Segment Value (US$ Mn), By Region 2012-2016
TABLE 60 Global Courier Services Companies Segment Value (US$ Mn), By Region 2017-2022
TABLE 61 Global Courier Services Companies Segment Market Share, By Region 2012-2016
TABLE 62 Global Courier Services Companies Segment Market Share, By Region 2017-2022
TABLE 63 Global Courier Services Companies Segment Y-o-Y, By Region 2015-2022
TABLE 64 Global Academic Institutions Segment Value (US$ Mn), By Region 2012-2016
TABLE 65 Global Academic Institutions Segment Value (US$ Mn), By Region 2017-2022
TABLE 66 Global Academic Institutions Segment Market Share, By Region 2012-2016
TABLE 67 Global Academic Institutions Segment Market Share, By Region 2017-2022
TABLE 68 Global Academic Institutions Segment Y-o-Y, By Region 2015-2022
TABLE 69 North America Cash & Coin Bags Market Value (US$ Mn), By Material Type2012-2016
TABLE 70 North America Cash & Coin Bags Market Value (US$ Mn), By Material Type2017-2022
TABLE 71 North America Cash & Coin Bags Market Value (US$ Mn), By Product Type2012-2016
TABLE 72 North America Cash & Coin Bags Market Value (US$ Mn), By Product Type2017-2022
TABLE 73 North America Cash & Coin Bags Market Value (US$ Mn), By End Use2012-2016
TABLE 74 North America Cash & Coin Bags Market Value (US$ Mn), By End Use2017-2022
TABLE 75 Latin America Cash & Coin Bags Market Value (US$ Mn), By Material Type2012-2016
TABLE 76 Latin America Cash & Coin Bags Market Value (US$ Mn), By Material Type2017-2022
TABLE 77 Latin America Cash & Coin Bags Market Value (US$ Mn), By Product Type2012-2016
TABLE 78 Latin America Cash & Coin Bags Market Value (US$ Mn), By Product Type2017-2022
TABLE 79 Latin America Cash & Coin Bags Market Value (US$ Mn), By End Use2012-2016
TABLE 80 Latin America Cash & Coin Bags Market Value (US$ Mn), By End Use2017-2022
TABLE 81 Europe Cash & Coin Bags Market Value (US$ Mn), By Material Type2012-2016
TABLE 82 Europe Cash & Coin Bags Market Value (US$ Mn), By Material Type2017-2022
TABLE 83 Europe Cash & Coin Bags Market Value (US$ Mn), By Product Type2012-2016
TABLE 84 Europe Cash & Coin Bags Market Value (US$ Mn), By Product Type2017-2022
TABLE 85 Europe Cash & Coin Bags Market Value (US$ Mn), By End Use2012-2016
TABLE 86 Europe Cash & Coin Bags Market Value (US$ Mn), By End Use2017-2022
TABLE 87 Japan Cash & Coin Bags Market Value (US$ Mn), By Material Type2012-2016
TABLE 88 Japan Cash & Coin Bags Market Value (US$ Mn), By Material Type2017-2022
TABLE 89 Japan Cash & Coin Bags Market Value (US$ Mn), By Product Type2012-2016
TABLE 90 Japan Cash & Coin Bags Market Value (US$ Mn), By Product Type2017-2022
TABLE 91 Japan Cash & Coin Bags Market Value (US$ Mn), By End Use2012-2016
TABLE 92 Japan Cash & Coin Bags Market Value (US$ Mn), By End Use2017-2022
TABLE 93 APEJ Cash & Coin Bags Market Value (US$ Mn), By Material Type2012-2016
TABLE 94 APEJ Cash & Coin Bags Market Value (US$ Mn), By Material Type2017-2022
TABLE 95 APEJ Cash & Coin Bags Market Value (US$ Mn), By Product Type2012-2016
TABLE 96 APEJ Cash & Coin Bags Market Value (US$ Mn), By Product Type2017-2022
TABLE 97 APEJ Cash & Coin Bags Market Value (US$ Mn), By End Use2012-2016
TABLE 98 APEJ Cash & Coin Bags Market Value (US$ Mn), By End Use2017-2022
TABLE 99 MEA Cash & Coin Bags Market Value (US$ Mn), By Material Type2012-2016
TABLE 100 MEA Cash & Coin Bags Market Value (US$ Mn), By Material Type2017-2022
TABLE 101 MEA Cash & Coin Bags Market Value (US$ Mn), By Product Type2012-2016
TABLE 102 MEA Cash & Coin Bags Market Value (US$ Mn), By Product Type2017-2022
TABLE 103 MEA Cash & Coin Bags Market Value (US$ Mn), By End Use2012-2016
TABLE 104 MEA Cash & Coin Bags Market Value (US$ Mn), By End Use2017-2022
TABLE 105 US Cash & Coin Bags Market Value (US$ Mn), By Material Type2012-2016
TABLE 106 US Cash & Coin Bags Market Value (US$ Mn), By Material Type2017-2022
TABLE 107 US Cash & Coin Bags Market Value (US$ Mn), By Product Type2012-2016
TABLE 108 US Cash & Coin Bags Market Value (US$ Mn), By Product Type2017-2022
TABLE 109 US Cash & Coin Bags Market Value (US$ Mn), By End Use2012-2016
TABLE 110 US Cash & Coin Bags Market Value (US$ Mn), By End Use2017-2022
TABLE 111 Canada Cash & Coin Bags Market Value (US$ Mn), By Material Type2012-2016
TABLE 112 Canada Cash & Coin Bags Market Value (US$ Mn), By Material Type2017-2022
TABLE 113 Canada Cash & Coin Bags Market Value (US$ Mn), By Product Type2012-2016
TABLE 114 Canada Cash & Coin Bags Market Value (US$ Mn), By Product Type2017-2022
TABLE 115 Canada Cash & Coin Bags Market Value (US$ Mn), By End Use2012-2016
TABLE 116 Canada Cash & Coin Bags Market Value (US$ Mn), By End Use2017-2022
TABLE 117 Brazil Cash & Coin Bags Market Value (US$ Mn), By Material Type2012-2016
TABLE 118 Brazil Cash & Coin Bags Market Value (US$ Mn), By Material Type2017-2022
TABLE 119 Brazil Cash & Coin Bags Market Value (US$ Mn), By Product Type2012-2016
TABLE 120 Brazil Cash & Coin Bags Market Value (US$ Mn), By Product Type2017-2022
TABLE 121 Brazil Cash & Coin Bags Market Value (US$ Mn), By End Use2012-2016
TABLE 122 Brazil Cash & Coin Bags Market Value (US$ Mn), By End Use2017-2022
TABLE 123 Mexico Cash & Coin Bags Market Value (US$ Mn), By Material Type2012-2016
TABLE 124 Mexico Cash & Coin Bags Market Value (US$ Mn), By Material Type2017-2022
TABLE 125 Mexico Cash & Coin Bags Market Value (US$ Mn), By Product Type2012-2016
TABLE 126 Mexico Cash & Coin Bags Market Value (US$ Mn), By Product Type2017-2022
TABLE 127 Mexico Cash & Coin Bags Market Value (US$ Mn), By End Use2012-2016
TABLE 128 Mexico Cash & Coin Bags Market Value (US$ Mn), By End Use2017-2022
TABLE 129 Argentina Cash & Coin Bags Market Value (US$ Mn), By Material Type2012-2016
TABLE 130 Argentina Cash & Coin Bags Market Value (US$ Mn), By Material Type2017-2022
TABLE 131 Argentina Cash & Coin Bags Market Value (US$ Mn), By Product Type2012-2016
TABLE 132 Argentina Cash & Coin Bags Market Value (US$ Mn), By Product Type2017-2022
TABLE 133 Argentina Cash & Coin Bags Market Value (US$ Mn), By End Use2012-2016
TABLE 134 Argentina Cash & Coin Bags Market Value (US$ Mn), By End Use2017-2022
TABLE 135 Rest of Latin America Cash & Coin Bags Market Value (US$ Mn), By Material Type2012-2016
TABLE 136 Rest of Latin America Cash & Coin Bags Market Value (US$ Mn), By Material Type2017-2022
TABLE 137 Rest of Latin America Cash & Coin Bags Market Value (US$ Mn), By Product Type2012-2016
TABLE 138 Rest of Latin America Cash & Coin Bags Market Value (US$ Mn), By Product Type2017-2022
TABLE 139 Rest of Latin America Cash & Coin Bags Market Value (US$ Mn), By End Use2012-2016
TABLE 140 Rest of Latin America Cash & Coin Bags Market Value (US$ Mn), By End Use2017-2022
TABLE 141 Germany Cash & Coin Bags Market Value (US$ Mn), By Material Type2012-2016
TABLE 142 Germany Cash & Coin Bags Market Value (US$ Mn), By Material Type2017-2022
TABLE 143 Germany Cash & Coin Bags Market Value (US$ Mn), By Product Type2012-2016
TABLE 144 Germany Cash & Coin Bags Market Value (US$ Mn), By Product Type2017-2022
TABLE 145 Germany Cash & Coin Bags Market Value (US$ Mn), By End Use2012-2016
TABLE 146 Germany Cash & Coin Bags Market Value (US$ Mn), By End Use2017-2022
TABLE 147 UK Cash & Coin Bags Market Value (US$ Mn), By Material Type2012-2016
TABLE 148 UK Cash & Coin Bags Market Value (US$ Mn), By Material Type2017-2022
TABLE 149 UK Cash & Coin Bags Market Value (US$ Mn), By Product Type2012-2016
TABLE 150 UK Cash & Coin Bags Market Value (US$ Mn), By Product Type2017-2022
TABLE 151 UK Cash & Coin Bags Market Value (US$ Mn), By End Use2012-2016
TABLE 152 UK Cash & Coin Bags Market Value (US$ Mn), By End Use2017-2022
TABLE 153 France Cash & Coin Bags Market Value (US$ Mn), By Material Type2012-2016
TABLE 154 France Cash & Coin Bags Market Value (US$ Mn), By Material Type2017-2022
TABLE 155 France Cash & Coin Bags Market Value (US$ Mn), By Product Type2012-2016
TABLE 156 France Cash & Coin Bags Market Value (US$ Mn), By Product Type2017-2022
TABLE 157 France Cash & Coin Bags Market Value (US$ Mn), By End Use2012-2016
TABLE 158 France Cash & Coin Bags Market Value (US$ Mn), By End Use2017-2022
TABLE 159 Russia Cash & Coin Bags Market Value (US$ Mn), By Material Type2012-2016
TABLE 160 Russia Cash & Coin Bags Market Value (US$ Mn), By Material Type2017-2022
TABLE 161 Russia Cash & Coin Bags Market Value (US$ Mn), By Product Type2012-2016
TABLE 162 Russia Cash & Coin Bags Market Value (US$ Mn), By Product Type2017-2022
TABLE 163 Russia Cash & Coin Bags Market Value (US$ Mn), By End Use2012-2016
TABLE 164 Russia Cash & Coin Bags Market Value (US$ Mn), By End Use2017-2022
TABLE 165 Italy Cash & Coin Bags Market Value (US$ Mn), By Material Type2012-2016
TABLE 166 Italy Cash & Coin Bags Market Value (US$ Mn), By Material Type2017-2022
TABLE 167 Italy Cash & Coin Bags Market Value (US$ Mn), By Product Type2012-2016
TABLE 168 Italy Cash & Coin Bags Market Value (US$ Mn), By Product Type2017-2022
TABLE 169 Italy Cash & Coin Bags Market Value (US$ Mn), By End Use2012-2016
TABLE 170 Italy Cash & Coin Bags Market Value (US$ Mn), By End Use2017-2022
TABLE 171 Rest of Europe Cash & Coin Bags Market Value (US$ Mn), By Material Type2012-2016
TABLE 172 Rest of Europe Cash & Coin Bags Market Value (US$ Mn), By Material Type2017-2022
TABLE 173 Rest of Europe Cash & Coin Bags Market Value (US$ Mn), By Product Type2012-2016
TABLE 174 Rest of Europe Cash & Coin Bags Market Value (US$ Mn), By Product Type2017-2022
TABLE 175 Rest of Europe Cash & Coin Bags Market Value (US$ Mn), By End Use2012-2016
TABLE 176 Rest of Europe Cash & Coin Bags Market Value (US$ Mn), By End Use2017-2022
TABLE 177 Japan Cash & Coin Bags Market Value (US$ Mn), By Material Type2012-2016
TABLE 178 Japan Cash & Coin Bags Market Value (US$ Mn), By Material Type2017-2022
TABLE 179 Japan Cash & Coin Bags Market Value (US$ Mn), By Product Type2012-2016
TABLE 180 Japan Cash & Coin Bags Market Value (US$ Mn), By Product Type2017-2022
TABLE 181 Japan Cash & Coin Bags Market Value (US$ Mn), By End Use2012-2016
TABLE 182 Japan Cash & Coin Bags Market Value (US$ Mn), By End Use2017-2022
TABLE 183 China Cash & Coin Bags Market Value (US$ Mn), By Material Type2012-2016
TABLE 184 China Cash & Coin Bags Market Value (US$ Mn), By Material Type2017-2022
TABLE 185 China Cash & Coin Bags Market Value (US$ Mn), By Product Type2012-2016
TABLE 186 China Cash & Coin Bags Market Value (US$ Mn), By Product Type2017-2022
TABLE 187 China Cash & Coin Bags Market Value (US$ Mn), By End Use2012-2016
TABLE 188 China Cash & Coin Bags Market Value (US$ Mn), By End Use2017-2022
TABLE 189 India Cash & Coin Bags Market Value (US$ Mn), By Material Type2012-2016
TABLE 190 India Cash & Coin Bags Market Value (US$ Mn), By Material Type2017-2022
TABLE 191 India Cash & Coin Bags Market Value (US$ Mn), By Product Type2012-2016
TABLE 192 India Cash & Coin Bags Market Value (US$ Mn), By Product Type2017-2022
TABLE 193 India Cash & Coin Bags Market Value (US$ Mn), By End Use2012-2016
TABLE 194 India Cash & Coin Bags Market Value (US$ Mn), By End Use2017-2022
TABLE 195 Malaysia Cash & Coin Bags Market Value (US$ Mn), By Material Type2012-2016
TABLE 196 Malaysia Cash & Coin Bags Market Value (US$ Mn), By Material Type2017-2022
TABLE 197 Malaysia Cash & Coin Bags Market Value (US$ Mn), By Product Type2012-2016
TABLE 198 Malaysia Cash & Coin Bags Market Value (US$ Mn), By Product Type2017-2022
TABLE 199 Malaysia Cash & Coin Bags Market Value (US$ Mn), By End Use2012-2016
TABLE 200 Malaysia Cash & Coin Bags Market Value (US$ Mn), By End Use2017-2022
TABLE 201 Thailand Cash & Coin Bags Market Value (US$ Mn), By Material Type2012-2016
TABLE 202 Thailand Cash & Coin Bags Market Value (US$ Mn), By Material Type2017-2022
TABLE 203 Thailand Cash & Coin Bags Market Value (US$ Mn), By Product Type2012-2016
TABLE 204 Thailand Cash & Coin Bags Market Value (US$ Mn), By Product Type2017-2022
TABLE 205 Thailand Cash & Coin Bags Market Value (US$ Mn), By End Use2012-2016
TABLE 206 Thailand Cash & Coin Bags Market Value (US$ Mn), By End Use2017-2022
TABLE 207 Australia & New Zealand Cash & Coin Bags Market Value (US$ Mn), By Material Type2012-2016
TABLE 208 Australia & New Zealand Cash & Coin Bags Market Value (US$ Mn), By Material Type2017-2022
TABLE 209 Australia & New Zealand Cash & Coin Bags Market Value (US$ Mn), By Product Type2012-2016
TABLE 210 Australia & New Zealand Cash & Coin Bags Market Value (US$ Mn), By Product Type2017-2022
TABLE 211 Australia & New Zealand Cash & Coin Bags Market Value (US$ Mn), By End Use2012-2016
TABLE 212 Australia & New Zealand Cash & Coin Bags Market Value (US$ Mn), By End Use2017-2022
TABLE 213 Rest of APEJ Cash & Coin Bags Market Value (US$ Mn), By Material Type2012-2016
TABLE 214 Rest of APEJ Cash & Coin Bags Market Value (US$ Mn), By Material Type2017-2022
TABLE 215 Rest of APEJ Cash & Coin Bags Market Value (US$ Mn), By Product Type2012-2016
TABLE 216 Rest of APEJ Cash & Coin Bags Market Value (US$ Mn), By Product Type2017-2022
TABLE 217 Rest of APEJ Cash & Coin Bags Market Value (US$ Mn), By End Use2012-2016
TABLE 218 Rest of APEJ Cash & Coin Bags Market Value (US$ Mn), By End Use2017-2022
TABLE 219 GCC Countries Cash & Coin Bags Market Value (US$ Mn), By Material Type2012-2016
TABLE 220 GCC Countries Cash & Coin Bags Market Value (US$ Mn), By Material Type2017-2022
TABLE 221 GCC Countries Cash & Coin Bags Market Value (US$ Mn), By Product Type2012-2016
TABLE 222 GCC Countries Cash & Coin Bags Market Value (US$ Mn), By Product Type2017-2022
TABLE 223 GCC Countries Cash & Coin Bags Market Value (US$ Mn), By End Use2012-2016
TABLE 224 GCC Countries Cash & Coin Bags Market Value (US$ Mn), By End Use2017-2022
TABLE 225 South Africa Cash & Coin Bags Market Value (US$ Mn), By Material Type2012-2016
TABLE 226 South Africa Cash & Coin Bags Market Value (US$ Mn), By Material Type2017-2022
TABLE 227 South Africa Cash & Coin Bags Market Value (US$ Mn), By Product Type2012-2016
TABLE 228 South Africa Cash & Coin Bags Market Value (US$ Mn), By Product Type2017-2022
TABLE 229 South Africa Cash & Coin Bags Market Value (US$ Mn), By End Use2012-2016
TABLE 230 South Africa Cash & Coin Bags Market Value (US$ Mn), By End Use2017-2022
TABLE 231 Israel Cash & Coin Bags Market Value (US$ Mn), By Material Type2012-2016
TABLE 232 Israel Cash & Coin Bags Market Value (US$ Mn), By Material Type2017-2022
TABLE 233 Israel Cash & Coin Bags Market Value (US$ Mn), By Product Type2012-2016
TABLE 234 Israel Cash & Coin Bags Market Value (US$ Mn), By Product Type2017-2022
TABLE 235 Israel Cash & Coin Bags Market Value (US$ Mn), By End Use2012-2016
TABLE 236 Israel Cash & Coin Bags Market Value (US$ Mn), By End Use2017-2022
TABLE 237 Rest of MEA Cash & Coin Bags Market Value (US$ Mn), By Material Type2012-2016
TABLE 238 Rest of MEA Cash & Coin Bags Market Value (US$ Mn), By Material Type2017-2022
TABLE 239 Rest of MEA Cash & Coin Bags Market Value (US$ Mn), By Product Type2012-2016
TABLE 240 Rest of MEA Cash & Coin Bags Market Value (US$ Mn), By Product Type2017-2022
TABLE 241 Rest of MEA Cash & Coin Bags Market Value (US$ Mn), By End Use2012-2016
TABLE 242 Rest of MEA Cash & Coin Bags Market Value (US$ Mn), By End Use2017-2022
List of Figures
FIG. 1 Global Cash & Coin Bags Market Value (US$ Mn), 2012-2016
FIG. 2 Global Cash & Coin Bags Market Value (US$ Mn) Forecast, 2017-2022
FIG. 3 Global Cash & Coin Bags Market Value (US$ Mn) and Y-o-Y, 2015-2022
FIG. 4 Global Plastic Segment Market Value (US$ Mn) By Region, 2012-2016
FIG. 5 Global Plastic Segment Market Value (US$ Mn) By Region, 2017-2022
FIG. 6 Global Plastic Segment Y-o-Y Growth Rate, By Region, 2015-2022
FIG. 7 Global Paper Segment Market Value (US$ Mn) By Region, 2012-2016
FIG. 8 Global Paper Segment Market Value (US$ Mn) By Region, 2017-2022
FIG. 9 Global Paper Segment Y-o-Y Growth Rate, By Region, 2015-2022
FIG. 10 Global Fabric Segment Market Value (US$ Mn) By Region, 2012-2016
FIG. 11 Global Fabric Segment Market Value (US$ Mn) By Region, 2017-2022
FIG. 12 Global Fabric Segment Y-o-Y Growth Rate, By Region, 2015-2022
FIG. 13 Global Opaque Segment Market Value (US$ Mn) By Region, 2012-2016
FIG. 14 Global Opaque Segment Market Value (US$ Mn) By Region, 2017-2022
FIG. 15 Global Opaque Segment Y-o-Y Growth Rate, By Region, 2015-2022
FIG. 16 Global Clear Segment Market Value (US$ Mn) By Region, 2012-2016
FIG. 17 Global Clear Segment Market Value (US$ Mn) By Region, 2017-2022
FIG. 18 Global Clear Segment Y-o-Y Growth Rate, By Region, 2015-2022
FIG. 19 Global Financial Institution Segment Market Value (US$ Mn) By Region, 2012-2016
FIG. 20 Global Financial Institution Segment Market Value (US$ Mn) By Region, 2017-2022
FIG. 21 Global Financial Institution Segment Y-o-Y Growth Rate, By Region, 2015-2022
FIG. 22 Global Hospitals Segment Market Value (US$ Mn) By Region, 2012-2016
FIG. 23 Global Hospitals Segment Market Value (US$ Mn) By Region, 2017-2022
FIG. 24 Global Hospitals Segment Y-o-Y Growth Rate, By Region, 2015-2022
FIG. 25 Global Casinos Segment Market Value (US$ Mn) By Region, 2012-2016
FIG. 26 Global Casinos Segment Market Value (US$ Mn) By Region, 2017-2022
FIG. 27 Global Casinos Segment Y-o-Y Growth Rate, By Region, 2015-2022
FIG. 28 Global Hotels Segment Market Value (US$ Mn) By Region, 2012-2016
FIG. 29 Global Hotels Segment Market Value (US$ Mn) By Region, 2017-2022
FIG. 30 Global Hotels Segment Y-o-Y Growth Rate, By Region, 2015-2022
FIG. 31 Global Retail Chains Segment Market Value (US$ Mn) By Region, 2012-2016
FIG. 32 Global Retail Chains Segment Market Value (US$ Mn) By Region, 2017-2022
FIG. 33 Global Retail Chains Segment Y-o-Y Growth Rate, By Region, 2015-2022
FIG. 34 Global Government Organization Segment Market Value (US$ Mn) By Region, 2012-2016
FIG. 35 Global Government Organization Segment Market Value (US$ Mn) By Region, 2017-2022
FIG. 36 Global Government Organization Segment Y-o-Y Growth Rate, By Region, 2015-2022
FIG. 37 Global Courier Services Companies Segment Market Value (US$ Mn) By Region, 2012-2016
FIG. 38 Global Courier Services Companies Segment Market Value (US$ Mn) By Region, 2017-2022
FIG. 39 Global Courier Services Companies Segment Y-o-Y Growth Rate, By Region, 2015-2022
FIG. 40 Global Academic Institutions Segment Market Value (US$ Mn) By Region, 2012-2016
FIG. 41 Global Academic Institutions Segment Market Value (US$ Mn) By Region, 2017-2022
FIG. 42 Global Academic Institutions Segment Y-o-Y Growth Rate, By Region, 2015-2022
FIG. 43 North America Cash & Coin Bags Market Value (US$ Mn), By Material Type2012-2016
FIG. 44 North America Cash & Coin Bags Market Value (US$ Mn), By Material Type2017-2022
FIG. 45 North America Cash & Coin Bags Market Value (US$ Mn), By Product Type2012-2016
FIG. 46 North America Cash & Coin Bags Market Value (US$ Mn), By Product Type2017-2022
FIG. 47 North America Cash & Coin Bags Market Value (US$ Mn), By End Use2012-2016
FIG. 48 North America Cash & Coin Bags Market Value (US$ Mn), By End Use2017-2022
FIG. 49 Latin America Cash & Coin Bags Market Value (US$ Mn), By Material Type2012-2016
FIG. 50 Latin America Cash & Coin Bags Market Value (US$ Mn), By Material Type2017-2022
FIG. 51 Latin America Cash & Coin Bags Market Value (US$ Mn), By Product Type2012-2016
FIG. 52 Latin America Cash & Coin Bags Market Value (US$ Mn), By Product Type2017-2022
FIG. 53 Latin America Cash & Coin Bags Market Value (US$ Mn), By End Use2012-2016
FIG. 54 Latin America Cash & Coin Bags Market Value (US$ Mn), By End Use2017-2022
FIG. 55 Europe Cash & Coin Bags Market Value (US$ Mn), By Material Type2012-2016
FIG. 56 Europe Cash & Coin Bags Market Value (US$ Mn), By Material Type2017-2022
FIG. 57 Europe Cash & Coin Bags Market Value (US$ Mn), By Product Type2012-2016
FIG. 58 Europe Cash & Coin Bags Market Value (US$ Mn), By Product Type2017-2022
FIG. 59 Europe Cash & Coin Bags Market Value (US$ Mn), By End Use2012-2016
FIG. 60 Europe Cash & Coin Bags Market Value (US$ Mn), By End Use2017-2022
FIG. 61 Japan Cash & Coin Bags Market Value (US$ Mn), By Material Type2012-2016
FIG. 62 Japan Cash & Coin Bags Market Value (US$ Mn), By Material Type2017-2022
FIG. 63 Japan Cash & Coin Bags Market Value (US$ Mn), By Product Type2012-2016
FIG. 64 Japan Cash & Coin Bags Market Value (US$ Mn), By Product Type2017-2022
FIG. 65 Japan Cash & Coin Bags Market Value (US$ Mn), By End Use2012-2016
FIG. 66 Japan Cash & Coin Bags Market Value (US$ Mn), By End Use2017-2022
FIG. 67 APEJ Cash & Coin Bags Market Value (US$ Mn), By Material Type2012-2016
FIG. 68 APEJ Cash & Coin Bags Market Value (US$ Mn), By Material Type2017-2022
FIG. 69 APEJ Cash & Coin Bags Market Value (US$ Mn), By Product Type2012-2016
FIG. 70 APEJ Cash & Coin Bags Market Value (US$ Mn), By Product Type2017-2022
FIG. 71 APEJ Cash & Coin Bags Market Value (US$ Mn), By End Use2012-2016
FIG. 72 APEJ Cash & Coin Bags Market Value (US$ Mn), By End Use2017-2022
FIG. 73 MEA Cash & Coin Bags Market Value (US$ Mn), By Material Type2012-2016
FIG. 74 MEA Cash & Coin Bags Market Value (US$ Mn), By Material Type2017-2022
FIG. 75 MEA Cash & Coin Bags Market Value (US$ Mn), By Product Type2012-2016
FIG. 76 MEA Cash & Coin Bags Market Value (US$ Mn), By Product Type2017-2022
FIG. 77 MEA Cash & Coin Bags Market Value (US$ Mn), By End Use2012-2016
FIG. 78 MEA Cash & Coin Bags Market Value (US$ Mn), By End Use2017-2022
Copyright © Transparency Market Research, Inc. All Rights reserved
Trust Online

Cash & Coin Deposit Bags Market