
Reports
Reports
Global Canned Soups Market: Snapshot
The global canned soups market is prognosticated to create new prospects in the near future as manufacturers hope to better settle themselves even outside of the older consumers group with the help of new innovations. There is already an influx of the development of a greater count of health-conscious soups and more diverse range of flavor offerings. Millennials are studied to get attracted to organic products that feature lower sodium content and no artificial ingredients. One of the leading companies dealing with soups, Campbell offers a broad scope of condensed and ready-to-serve options, which gives a positive picture of the market.
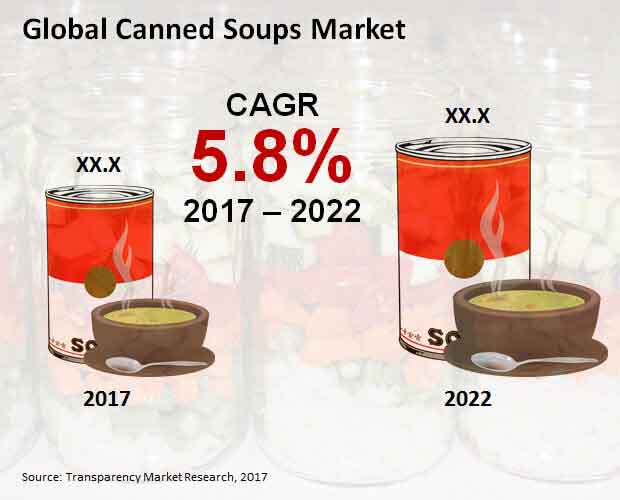
The global canned soups market is envisaged to expand at a CAGR of 5.8% during the forecast period 2017–2022 to achieve a valuation of US$6.5 bn by the final forecast year. In 2017, the market was valued at a US$4.9 bn.
Ready-to-serve Wet Soup Scores Higher than Other Products in View of Revenue
The researchers foresee the world canned soups market to be classified according to two categories, i.e. product and ingredient. By product, the market could be segregated into ready-to-serve wet soup, condensed wet soup, and others. Out of these segments, ready-to-serve wet soup is prophesied to secure a larger revenue of US$3.6 bn by 2022 end. It could flaunt an absolute revenue growth of US$0.1 bn annually, which could be greater than other segments in the categorization.
In terms of type of ingredient, the world canned soups market is foretold to see a classification into tomato, beans, chicken, beef, broths, artichokes, mixed vegetables, and other ingredients.
Each of these segments by product and ingredient segmentations are entirely analyzed in the publication, taking into consideration their revenue, market share, and year over year (Y-o-Y) growth comparisons by region.
APEJ Gathers Substantial Share but Japan and MEA Fall Back in Revenue Growth
As per the research of the publication, the international canned soups market could be classed into Europe, North America, Asia Pacific except Japan (APEJ), Latin America, the Middle East and Africa (MEA), and Japan. Readers are informed that APEJ is expected to be one of the most lucrative regions with a higher revenue growth projected to continue to show face in the next few years. By the concluding forecast year, APEJ could garner a revenue of US$1.9 bn.
North America could be another opportunity for players to capitalize on in the coming years. This region is anticipated to collect a handsome revenue by 2022 at a 6.2% CAGR. Europe could bag a decent revenue share in 2017 but also lose 117 basis points (BPS) by 2022. Japan and the MEA, however, are predicted to be on the slower side of growth.
Some of the crucial players in the worldwide canned soups market could be Campbell Soup Co., Knorr Foods Co. Ltd., The Kraft Heinz Co., Compass Group USA, Inc., and Juanitas Foods. More players are comprehensively studied in the publication while estimating vital statistics such as company share. Buyers of the publication are expected to receive complete knowledge about the competition landscape of the market.
Innovative Packaging Solutions and Taste Enhancement Features to Boost Canned Soups Market
The global canned soups market is acquiring energy because of the developing ubiquity and interest for prepared to eat and accommodation food varieties. The developing dispensable wages of individuals and expanding prevalence of canned soups among the more seasoned age is a portion of different components supporting the development of this market. Canned soups in various flavors are being dispatched by market players and this will likewise help raise the ubiquity and lift client fascination towards the various flavors accessible.
One of the key variables affecting the market then again, is the developing wellbeing worries among purchasers. The canned soups contain numerous additives for expanding their time span of usability, which thusly is causing worries among buyers. Natural canned soups, anyway are relied upon to acquire prevalence and diminish the effect of this limitation. Another test in regards to trouble to open canned soups goes poorly with youths. Henceforth they incline toward moment soups in powdered structure which come in simple to convey pockets that are light in weight instead of canned soups.
The worldwide canned soups market is guessed to be advantaged by extra endeavors of brands taken to upgrade their nourishing picture, for example, including more supplemental fixings, viz. additional fiber and minerals and nutrients, and vegetables. Merchants could offer more fascinating canned soups while getting thoughts from the foods of different societies. Besides, there could be an extension in the flavor assortments of canned soup items. For a splendid future on the lookout, organizations are imagined to remain on the highest point of food patterns to offer items that fulfill the steadily changing sense of taste of shoppers.
Furthermore, the increasing adoption of sedentary lifestyle, coupled with the rising popularity of ready-to-eat and easy-to-cook food products will further propel the demand for canned soup in the coming years.
1. Global Canned Soups Market - Executive Summary
2. Global Canned Soups Market Overview
2.1. Introduction
2.1.1. Global Canned Soups Market Taxonomy
2.1.2. Global Canned Soups Market Definition
2.2. Global Canned Soups Market Size (US$ Mn) and Forecast, 2012-2022
2.2.1. Global Canned Soups Market Y-o-Y Growth
2.3. Global Canned Soups Market Dynamics
2.4. Supply Chain
2.5. Pricing Analysis
2.6. Market Opportunities
2.7. Product Innovations
2.8. Trade Analysis
2.9. Key Participants in the Market By Region
3. Global Canned Soups Market Analysis and Forecast By Product Type
3.1. Global Canned Soups Market Size and Forecast By Product Type, 2012-2022
3.1.1. Ready to serve wet soup Market Size and Forecast, 2012-2022
3.1.1.1. Revenue (US$ Mn) Comparison, By Region
3.1.1.2. Market Share Comparison, By Region
3.1.1.3. Y-o-Y growth Comparison, By Region
3.1.2. Condensed wet soup Market Size and Forecast, 2012-2022
3.1.2.1. Revenue (US$ Mn) Comparison, By Region
3.1.2.2. Market Share Comparison, By Region
3.1.2.3. Y-o-Y growth Comparison, By Region
3.1.3. Others Market Size and Forecast, 2012-2022
3.1.3.1. Revenue (US$ Mn) Comparison, By Region
3.1.3.2. Market Share Comparison, By Region
3.1.3.3. Y-o-Y growth Comparison, By Region
4. Global Canned Soups Market Analysis and Forecast By Ingredient
4.1. Global Canned Soups Market Size and Forecast By Ingredient, 2012-2022
4.1.1. Tomato Market Size and Forecast, 2012-2022
4.1.1.1. Revenue (US$ Mn) Comparison, By Region
4.1.1.2. Market Share Comparison, By Region
4.1.1.3. Y-o-Y growth Comparison, By Region
4.1.2. Beans Market Size and Forecast, 2012-2022
4.1.2.1. Revenue (US$ Mn) Comparison, By Region
4.1.2.2. Market Share Comparison, By Region
4.1.2.3. Y-o-Y growth Comparison, By Region
4.1.3. Chicken Market Size and Forecast, 2012-2022
4.1.3.1. Revenue (US$ Mn) Comparison, By Region
4.1.3.2. Market Share Comparison, By Region
4.1.3.3. Y-o-Y growth Comparison, By Region
4.1.4. Beef Market Size and Forecast, 2012-2022
4.1.4.1. Revenue (US$ Mn) Comparison, By Region
4.1.4.2. Market Share Comparison, By Region
4.1.4.3. Y-o-Y growth Comparison, By Region
4.1.5. Broths Market Size and Forecast, 2012-2022
4.1.5.1. Revenue (US$ Mn) Comparison, By Region
4.1.5.2. Market Share Comparison, By Region
4.1.5.3. Y-o-Y growth Comparison, By Region
4.1.6. Artichokes Market Size and Forecast, 2012-2022
4.1.6.1. Revenue (US$ Mn) Comparison, By Region
4.1.6.2. Market Share Comparison, By Region
4.1.6.3. Y-o-Y growth Comparison, By Region
4.1.7. Mixed Vegetables Market Size and Forecast, 2012-2022
4.1.7.1. Revenue (US$ Mn) Comparison, By Region
4.1.7.2. Market Share Comparison, By Region
4.1.7.3. Y-o-Y growth Comparison, By Region
4.1.8. Other Ingredients Market Size and Forecast, 2012-2022
4.1.8.1. Revenue (US$ Mn) Comparison, By Region
4.1.8.2. Market Share Comparison, By Region
4.1.8.3. Y-o-Y growth Comparison, By Region
5. Global Canned Soups Market Analysis and Forecast By Region
5.1. Global Canned Soups Market Size and Forecast, 2012-2022
5.1.1. North America Canned Soups Market Size and Forecast, 2012-2022
5.1.1.1. Revenue (US$ Mn) Comparison, By Product Type
5.1.1.2. Revenue (US$ Mn) Comparison, By Ingredient
5.1.2. Latin America Canned Soups Market Size and Forecast, 2012-2022
5.1.2.1. Revenue (US$ Mn) Comparison, By Product Type
5.1.2.2. Revenue (US$ Mn) Comparison, By Ingredient
5.1.3. Europe Canned Soups Market Size and Forecast, 2012-2022
5.1.3.1. Revenue (US$ Mn) Comparison, By Product Type
5.1.3.2. Revenue (US$ Mn) Comparison, By Ingredient
5.1.4. Japan Canned Soups Market Size and Forecast, 2012-2022
5.1.4.1. Revenue (US$ Mn) Comparison, By Product Type
5.1.4.2. Revenue (US$ Mn) Comparison, By Ingredient
5.1.5. APEJ Canned Soups Market Size and Forecast, 2012-2022
5.1.5.1. Revenue (US$ Mn) Comparison, By Product Type
5.1.5.2. Revenue (US$ Mn) Comparison, By Ingredient
5.1.6. MEA Canned Soups Market Size and Forecast, 2012-2022
5.1.6.1. Revenue (US$ Mn) Comparison, By Product Type
5.1.6.2. Revenue (US$ Mn) Comparison, By Ingredient
6. North America Canned Soups Market Analysis and Forecast, By Country, 2012-2022
6.1. US Canned Soups Market Size and Forecast, 2012-2022
6.1.1. Revenue (US$ Mn) Comparison, By Product Type
6.1.2. Revenue (US$ Mn) Comparison, By Ingredient
6.2. Canada Canned Soups Market Size and Forecast, 2012-2022
6.2.1. Revenue (US$ Mn) Comparison, By Product Type
6.2.2. Revenue (US$ Mn) Comparison, By Ingredient
7. Latin America Canned Soups Market Analysis and Forecast, By Country, 2012-2022
7.1. Brazil Canned Soups Market Size and Forecast, 2012-2022
7.1.1. Revenue (US$ Mn) Comparison, By Product Type
7.1.2. Revenue (US$ Mn) Comparison, By Ingredient
7.2. Mexico Canned Soups Market Size and Forecast, 2012-2022
7.2.1. Revenue (US$ Mn) Comparison, By Product Type
7.2.2. Revenue (US$ Mn) Comparison, By Ingredient
7.3. Argentina Canned Soups Market Size and Forecast, 2012-2022
7.3.1. Revenue (US$ Mn) Comparison, By Product Type
7.3.2. Revenue (US$ Mn) Comparison, By Ingredient
8. Europe Canned Soups Market Analysis and Forecast, By Country, 2012-2022
8.1. Germany Canned Soups Market Size and Forecast, 2012-2022
8.1.1. Revenue (US$ Mn) Comparison, By Product Type
8.1.2. Revenue (US$ Mn) Comparison, By Ingredient
8.2. UK Canned Soups Market Size and Forecast, 2012-2022
8.2.1. Revenue (US$ Mn) Comparison, By Product Type
8.2.2. Revenue (US$ Mn) Comparison, By Ingredient
8.3. France Canned Soups Market Size and Forecast, 2012-2022
8.3.1. Revenue (US$ Mn) Comparison, By Product Type
8.3.2. Revenue (US$ Mn) Comparison, By Ingredient
8.4. Spain Canned Soups Market Size and Forecast, 2012-2022
8.4.1. Revenue (US$ Mn) Comparison, By Product Type
8.4.2. Revenue (US$ Mn) Comparison, By Ingredient
8.5. Italy Canned Soups Market Size and Forecast, 2012-2022
8.5.1. Revenue (US$ Mn) Comparison, By Product Type
8.5.2. Revenue (US$ Mn) Comparison, By Ingredient
8.6. Nordic Canned Soups Market Size and Forecast, 2012-2022
8.6.1. Revenue (US$ Mn) Comparison, By Product Type
8.6.2. Revenue (US$ Mn) Comparison, By Ingredient
9. Japan Canned Soups Market Analysis and Forecast, By Country, 2012-2022
9.1. Japan Canned Soups Market Size and Forecast, 2012-2022
9.1.1. Revenue (US$ Mn) Comparison, By Product Type
9.1.2. Revenue (US$ Mn) Comparison, By Ingredient
10. APEJ Canned Soups Market Analysis and Forecast, By Country, 2012-2022
10.1. China Canned Soups Market Size and Forecast, 2012-2022
10.1.1. Revenue (US$ Mn) Comparison, By Product Type
10.1.2. Revenue (US$ Mn) Comparison, By Ingredient
10.2. India Canned Soups Market Size and Forecast, 2012-2022
10.2.1. Revenue (US$ Mn) Comparison, By Product Type
10.2.2. Revenue (US$ Mn) Comparison, By Ingredient
10.3. Malaysia Canned Soups Market Size and Forecast, 2012-2022
10.3.1. Revenue (US$ Mn) Comparison, By Product Type
10.3.2. Revenue (US$ Mn) Comparison, By Ingredient
10.4. Thailand Canned Soups Market Size and Forecast, 2012-2022
10.4.1. Revenue (US$ Mn) Comparison, By Product Type
10.4.2. Revenue (US$ Mn) Comparison, By Ingredient
10.5. Singapore Canned Soups Market Size and Forecast, 2012-2022
10.5.1. Revenue (US$ Mn) Comparison, By Product Type
10.5.2. Revenue (US$ Mn) Comparison, By Ingredient
10.6. Australia Canned Soups Market Size and Forecast, 2012-2022
10.6.1. Revenue (US$ Mn) Comparison, By Product Type
10.6.2. Revenue (US$ Mn) Comparison, By Ingredient
11. MEA Canned Soups Market Analysis and Forecast, By Country, 2012-2022
11.1. GCC Countries Canned Soups Market Size and Forecast, 2012-2022
11.1.1. Revenue (US$ Mn) Comparison, By Product Type
11.1.2. Revenue (US$ Mn) Comparison, By Ingredient
11.2. South Africa Canned Soups Market Size and Forecast, 2012-2022
11.2.1. Revenue (US$ Mn) Comparison, By Product Type
11.2.2. Revenue (US$ Mn) Comparison, By Ingredient
11.3. Nigeria Canned Soups Market Size and Forecast, 2012-2022
11.3.1. Revenue (US$ Mn) Comparison, By Product Type
11.3.2. Revenue (US$ Mn) Comparison, By Ingredient
11.4. Israel Canned Soups Market Size and Forecast, 2012-2022
11.4.1. Revenue (US$ Mn) Comparison, By Product Type
11.4.2. Revenue (US$ Mn) Comparison, By Ingredient
12. Global Canned Soups Market Company Share, Competition Landscape and Company Profiles
12.1. Company Share Analysis
12.2. Competitive Dashboard
12.3. Company Profiles
12.3.1. Campbell Soup Co.
12.3.2. Knorr Foods Co. Ltd.
12.3.3. The Kraft Heinz Co.
12.3.4. Compass Group USA Inc.
12.3.5. Juanitas Foods
12.3.6. General Mills, Inc.
12.3.7. Conagra Brands, Inc.
12.3.8. Trader Joe's Company
12.3.9. Hain Celestial Group, Inc.
12.3.10. Amys Kitchen Inc.
12.3.11. Baxters Food Group Limited
13. Research Methodology
14. Secondary and Primary Sources
15. Assumptions and Acronyms
16. Disclaimer
List of Tables
TABLE 1 Global Canned Soups Market Value (US$ Mn), 2012-2016
TABLE 2 Global Canned Soups Market Value (US$ Mn), 2017-2022
TABLE 3 Global Canned Soups Market Value (US$ Mn) and Y-o-Y, 2015-2022
TABLE 4 Global Ready to serve wet soup Segment Value (US$ Mn), By Region 2012-2016
TABLE 5 Global Ready to serve wet soup Segment Value (US$ Mn), By Region 2017-2022
TABLE 6 Global Ready to serve wet soup Segment Market Share, By Region 2012-2016
TABLE 7 Global Ready to serve wet soup Segment Market Share, By Region 2017-2022
TABLE 8 Global Ready to serve wet soup Segment Y-o-Y, By Region 2015-2022
TABLE 9 Global Condensed wet soup Segment Value (US$ Mn), By Region 2012-2016
TABLE 10 Global Condensed wet soup Segment Value (US$ Mn), By Region 2017-2022
TABLE 11 Global Condensed wet soup Segment Market Share, By Region 2012-2016
TABLE 12 Global Condensed wet soup Segment Market Share, By Region 2017-2022
TABLE 13 Global Condensed wet soup Segment Y-o-Y, By Region 2015-2022
TABLE 14 Global Others Segment Value (US$ Mn), By Region 2012-2016
TABLE 15 Global Others Segment Value (US$ Mn), By Region 2017-2022
TABLE 16 Global Others Segment Market Share, By Region 2012-2016
TABLE 17 Global Others Segment Market Share, By Region 2017-2022
TABLE 18 Global Others Segment Y-o-Y, By Region 2015-2022
TABLE 19 Global Tomato Segment Value (US$ Mn), By Region 2012-2016
TABLE 20 Global Tomato Segment Value (US$ Mn), By Region 2017-2022
TABLE 21 Global Tomato Segment Market Share, By Region 2012-2016
TABLE 22 Global Tomato Segment Market Share, By Region 2017-2022
TABLE 23 Global Tomato Segment Y-o-Y, By Region 2015-2022
TABLE 24 Global Beans Segment Value (US$ Mn), By Region 2012-2016
TABLE 25 Global Beans Segment Value (US$ Mn), By Region 2017-2022
TABLE 26 Global Beans Segment Market Share, By Region 2012-2016
TABLE 27 Global Beans Segment Market Share, By Region 2017-2022
TABLE 28 Global Beans Segment Y-o-Y, By Region 2015-2022
TABLE 29 Global Chicken Segment Value (US$ Mn), By Region 2012-2016
TABLE 30 Global Chicken Segment Value (US$ Mn), By Region 2017-2022
TABLE 31 Global Chicken Segment Market Share, By Region 2012-2016
TABLE 32 Global Chicken Segment Market Share, By Region 2017-2022
TABLE 33 Global Chicken Segment Y-o-Y, By Region 2015-2022
TABLE 34 Global Beef Segment Value (US$ Mn), By Region 2012-2016
TABLE 35 Global Beef Segment Value (US$ Mn), By Region 2017-2022
TABLE 36 Global Beef Segment Market Share, By Region 2012-2016
TABLE 37 Global Beef Segment Market Share, By Region 2017-2022
TABLE 38 Global Beef Segment Y-o-Y, By Region 2015-2022
TABLE 39 Global Broths Segment Value (US$ Mn), By Region 2012-2016
TABLE 40 Global Broths Segment Value (US$ Mn), By Region 2017-2022
TABLE 41 Global Broths Segment Market Share, By Region 2012-2016
TABLE 42 Global Broths Segment Market Share, By Region 2017-2022
TABLE 43 Global Broths Segment Y-o-Y, By Region 2015-2022
TABLE 44 Global Artichokes Segment Value (US$ Mn), By Region 2012-2016
TABLE 45 Global Artichokes Segment Value (US$ Mn), By Region 2017-2022
TABLE 46 Global Artichokes Segment Market Share, By Region 2012-2016
TABLE 47 Global Artichokes Segment Market Share, By Region 2017-2022
TABLE 48 Global Artichokes Segment Y-o-Y, By Region 2015-2022
TABLE 49 Global Mixed Vegetables Segment Value (US$ Mn), By Region 2012-2016
TABLE 50 Global Mixed Vegetables Segment Value (US$ Mn), By Region 2017-2022
TABLE 51 Global Mixed Vegetables Segment Market Share, By Region 2012-2016
TABLE 52 Global Mixed Vegetables Segment Market Share, By Region 2017-2022
TABLE 53 Global Mixed Vegetables Segment Y-o-Y, By Region 2015-2022
TABLE 54 Global Other Ingredients Segment Value (US$ Mn), By Region 2012-2016
TABLE 55 Global Other Ingredients Segment Value (US$ Mn), By Region 2017-2022
TABLE 56 Global Other Ingredients Segment Market Share, By Region 2012-2016
TABLE 57 Global Other Ingredients Segment Market Share, By Region 2017-2022
TABLE 58 Global Other Ingredients Segment Y-o-Y, By Region 2015-2022
TABLE 59 North America Canned Soups Market Value (US$ Mn), By Product Type 2012-2016
TABLE 60 North America Canned Soups Market Value (US$ Mn), By Product Type 2017-2022
TABLE 61 North America Canned Soups Market Value (US$ Mn), By Ingredient 2012-2016
TABLE 62 North America Canned Soups Market Value (US$ Mn), By Ingredient 2017-2022
TABLE 63 Latin America Canned Soups Market Value (US$ Mn), By Product Type 2012-2016
TABLE 64 Latin America Canned Soups Market Value (US$ Mn), By Product Type 2017-2022
TABLE 65 Latin America Canned Soups Market Value (US$ Mn), By Ingredient 2012-2016
TABLE 66 Latin America Canned Soups Market Value (US$ Mn), By Ingredient 2017-2022
TABLE 67 Europe Canned Soups Market Value (US$ Mn), By Product Type 2012-2016
TABLE 68 Europe Canned Soups Market Value (US$ Mn), By Product Type 2017-2022
TABLE 69 Europe Canned Soups Market Value (US$ Mn), By Ingredient 2012-2016
TABLE 70 Europe Canned Soups Market Value (US$ Mn), By Ingredient 2017-2022
TABLE 71 Japan Canned Soups Market Value (US$ Mn), By Product Type 2012-2016
TABLE 72 Japan Canned Soups Market Value (US$ Mn), By Product Type 2017-2022
TABLE 73 Japan Canned Soups Market Value (US$ Mn), By Ingredient 2012-2016
TABLE 74 Japan Canned Soups Market Value (US$ Mn), By Ingredient 2017-2022
TABLE 75 APEJ Canned Soups Market Value (US$ Mn), By Product Type 2012-2016
TABLE 76 APEJ Canned Soups Market Value (US$ Mn), By Product Type 2017-2022
TABLE 77 APEJ Canned Soups Market Value (US$ Mn), By Ingredient 2012-2016
TABLE 78 APEJ Canned Soups Market Value (US$ Mn), By Ingredient 2017-2022
TABLE 79 MEA Canned Soups Market Value (US$ Mn), By Product Type 2012-2016
TABLE 80 MEA Canned Soups Market Value (US$ Mn), By Product Type 2017-2022
TABLE 81 MEA Canned Soups Market Value (US$ Mn), By Ingredient 2012-2016
TABLE 82 MEA Canned Soups Market Value (US$ Mn), By Ingredient 2017-2022
TABLE 83 US Canned Soups Market Value (US$ Mn), By Product Type 2012-2016
TABLE 84 US Canned Soups Market Value (US$ Mn), By Product Type 2017-2022
TABLE 85 US Canned Soups Market Value (US$ Mn), By Ingredient 2012-2016
TABLE 86 US Canned Soups Market Value (US$ Mn), By Ingredient 2017-2022
TABLE 87 Canada Canned Soups Market Value (US$ Mn), By Product Type 2012-2016
TABLE 88 Canada Canned Soups Market Value (US$ Mn), By Product Type 2017-2022
TABLE 89 Canada Canned Soups Market Value (US$ Mn), By Ingredient 2012-2016
TABLE 90 Canada Canned Soups Market Value (US$ Mn), By Ingredient 2017-2022
TABLE 91 Brazil Canned Soups Market Value (US$ Mn), By Product Type 2012-2016
TABLE 92 Brazil Canned Soups Market Value (US$ Mn), By Product Type 2017-2022
TABLE 93 Brazil Canned Soups Market Value (US$ Mn), By Ingredient 2012-2016
TABLE 94 Brazil Canned Soups Market Value (US$ Mn), By Ingredient 2017-2022
TABLE 95 Mexico Canned Soups Market Value (US$ Mn), By Product Type 2012-2016
TABLE 96 Mexico Canned Soups Market Value (US$ Mn), By Product Type 2017-2022
TABLE 97 Mexico Canned Soups Market Value (US$ Mn), By Ingredient 2012-2016
TABLE 98 Mexico Canned Soups Market Value (US$ Mn), By Ingredient 2017-2022
TABLE 99 Argentina Canned Soups Market Value (US$ Mn), By Product Type 2012-2016
TABLE 100 Argentina Canned Soups Market Value (US$ Mn), By Product Type 2017-2022
TABLE 101 Argentina Canned Soups Market Value (US$ Mn), By Ingredient 2012-2016
TABLE 102 Argentina Canned Soups Market Value (US$ Mn), By Ingredient 2017-2022
TABLE 103 Germany Canned Soups Market Value (US$ Mn), By Product Type 2012-2016
TABLE 104 Germany Canned Soups Market Value (US$ Mn), By Product Type 2017-2022
TABLE 105 Germany Canned Soups Market Value (US$ Mn), By Ingredient 2012-2016
TABLE 106 Germany Canned Soups Market Value (US$ Mn), By Ingredient 2017-2022
TABLE 107 UK Canned Soups Market Value (US$ Mn), By Product Type 2012-2016
TABLE 108 UK Canned Soups Market Value (US$ Mn), By Product Type 2017-2022
TABLE 109 UK Canned Soups Market Value (US$ Mn), By Ingredient 2012-2016
TABLE 110 UK Canned Soups Market Value (US$ Mn), By Ingredient 2017-2022
TABLE 111 France Canned Soups Market Value (US$ Mn), By Product Type 2012-2016
TABLE 112 France Canned Soups Market Value (US$ Mn), By Product Type 2017-2022
TABLE 113 France Canned Soups Market Value (US$ Mn), By Ingredient 2012-2016
TABLE 114 France Canned Soups Market Value (US$ Mn), By Ingredient 2017-2022
TABLE 115 Spain Canned Soups Market Value (US$ Mn), By Product Type 2012-2016
TABLE 116 Spain Canned Soups Market Value (US$ Mn), By Product Type 2017-2022
TABLE 117 Spain Canned Soups Market Value (US$ Mn), By Ingredient 2012-2016
TABLE 118 Spain Canned Soups Market Value (US$ Mn), By Ingredient 2017-2022
TABLE 119 Italy Canned Soups Market Value (US$ Mn), By Product Type 2012-2016
TABLE 120 Italy Canned Soups Market Value (US$ Mn), By Product Type 2017-2022
TABLE 121 Italy Canned Soups Market Value (US$ Mn), By Ingredient 2012-2016
TABLE 122 Italy Canned Soups Market Value (US$ Mn), By Ingredient 2017-2022
TABLE 123 Nordic Canned Soups Market Value (US$ Mn), By Product Type 2012-2016
TABLE 124 Nordic Canned Soups Market Value (US$ Mn), By Product Type 2017-2022
TABLE 125 Nordic Canned Soups Market Value (US$ Mn), By Ingredient 2012-2016
TABLE 126 Nordic Canned Soups Market Value (US$ Mn), By Ingredient 2017-2022
TABLE 127 Japan Canned Soups Market Value (US$ Mn), By Product Type 2012-2016
TABLE 128 Japan Canned Soups Market Value (US$ Mn), By Product Type 2017-2022
TABLE 129 Japan Canned Soups Market Value (US$ Mn), By Ingredient 2012-2016
TABLE 130 Japan Canned Soups Market Value (US$ Mn), By Ingredient 2017-2022
TABLE 131 China Canned Soups Market Value (US$ Mn), By Product Type 2012-2016
TABLE 132 China Canned Soups Market Value (US$ Mn), By Product Type 2017-2022
TABLE 133 China Canned Soups Market Value (US$ Mn), By Ingredient 2012-2016
TABLE 134 China Canned Soups Market Value (US$ Mn), By Ingredient 2017-2022
TABLE 135 India Canned Soups Market Value (US$ Mn), By Product Type 2012-2016
TABLE 136 India Canned Soups Market Value (US$ Mn), By Product Type 2017-2022
TABLE 137 India Canned Soups Market Value (US$ Mn), By Ingredient 2012-2016
TABLE 138 India Canned Soups Market Value (US$ Mn), By Ingredient 2017-2022
TABLE 139 Malaysia Canned Soups Market Value (US$ Mn), By Product Type 2012-2016
TABLE 140 Malaysia Canned Soups Market Value (US$ Mn), By Product Type 2017-2022
TABLE 141 Malaysia Canned Soups Market Value (US$ Mn), By Ingredient 2012-2016
TABLE 142 Malaysia Canned Soups Market Value (US$ Mn), By Ingredient 2017-2022
TABLE 143 Thailand Canned Soups Market Value (US$ Mn), By Product Type 2012-2016
TABLE 144 Thailand Canned Soups Market Value (US$ Mn), By Product Type 2017-2022
TABLE 145 Thailand Canned Soups Market Value (US$ Mn), By Ingredient 2012-2016
TABLE 146 Thailand Canned Soups Market Value (US$ Mn), By Ingredient 2017-2022
TABLE 147 Singapore Canned Soups Market Value (US$ Mn), By Product Type 2012-2016
TABLE 148 Singapore Canned Soups Market Value (US$ Mn), By Product Type 2017-2022
TABLE 149 Singapore Canned Soups Market Value (US$ Mn), By Ingredient 2012-2016
TABLE 150 Singapore Canned Soups Market Value (US$ Mn), By Ingredient 2017-2022
TABLE 151 Australia Canned Soups Market Value (US$ Mn), By Product Type 2012-2016
TABLE 152 Australia Canned Soups Market Value (US$ Mn), By Product Type 2017-2022
TABLE 153 Australia Canned Soups Market Value (US$ Mn), By Ingredient 2012-2016
TABLE 154 Australia Canned Soups Market Value (US$ Mn), By Ingredient 2017-2022
TABLE 155 GCC Countries Canned Soups Market Value (US$ Mn), By Product Type 2012-2016
TABLE 156 GCC Countries Canned Soups Market Value (US$ Mn), By Product Type 2017-2022
TABLE 157 GCC Countries Canned Soups Market Value (US$ Mn), By Ingredient 2012-2016
TABLE 158 GCC Countries Canned Soups Market Value (US$ Mn), By Ingredient 2017-2022
TABLE 159 South Africa Canned Soups Market Value (US$ Mn), By Product Type 2012-2016
TABLE 160 South Africa Canned Soups Market Value (US$ Mn), By Product Type 2017-2022
TABLE 161 South Africa Canned Soups Market Value (US$ Mn), By Ingredient 2012-2016
TABLE 162 South Africa Canned Soups Market Value (US$ Mn), By Ingredient 2017-2022
TABLE 163 Nigeria Canned Soups Market Value (US$ Mn), By Product Type 2012-2016
TABLE 164 Nigeria Canned Soups Market Value (US$ Mn), By Product Type 2017-2022
TABLE 165 Nigeria Canned Soups Market Value (US$ Mn), By Ingredient 2012-2016
TABLE 166 Nigeria Canned Soups Market Value (US$ Mn), By Ingredient 2017-2022
TABLE 167 Israel Canned Soups Market Value (US$ Mn), By Product Type 2012-2016
TABLE 168 Israel Canned Soups Market Value (US$ Mn), By Product Type 2017-2022
TABLE 169 Israel Canned Soups Market Value (US$ Mn), By Ingredient 2012-2016
TABLE 170 Israel Canned Soups Market Value (US$ Mn), By Ingredient 2017-2022
List of Figures
FIG. 1 Global Canned Soups Market Value (US$ Mn), 2012-2016
FIG. 2 Global Canned Soups Market Value (US$ Mn) Forecast, 2017-2022
FIG. 3 Global Canned Soups Market Value (US$ Mn) and Y-o-Y, 2015-2022
FIG. 4 Global Ready to serve wet soup Segment Market Value (US$ Mn) By Region, 2012-2016
FIG. 5 Global Ready to serve wet soup Segment Market Value (US$ Mn) By Region, 2017-2022
FIG. 6 Global Ready to serve wet soup Segment Y-o-Y Growth Rate, By Region, 2015-2022
FIG. 7 Global Condensed wet soup Segment Market Value (US$ Mn) By Region, 2012-2016
FIG. 8 Global Condensed wet soup Segment Market Value (US$ Mn) By Region, 2017-2022
FIG. 9 Global Condensed wet soup Segment Y-o-Y Growth Rate, By Region, 2015-2022
FIG. 10 Global Others Segment Market Value (US$ Mn) By Region, 2012-2016
FIG. 11 Global Others Segment Market Value (US$ Mn) By Region, 2017-2022
FIG. 12 Global Others Segment Y-o-Y Growth Rate, By Region, 2015-2022
FIG. 13 Global Tomato Segment Market Value (US$ Mn) By Region, 2012-2016
FIG. 14 Global Tomato Segment Market Value (US$ Mn) By Region, 2017-2022
FIG. 15 Global Tomato Segment Y-o-Y Growth Rate, By Region, 2015-2022
FIG. 16 Global Beans Segment Market Value (US$ Mn) By Region, 2012-2016
FIG. 17 Global Beans Segment Market Value (US$ Mn) By Region, 2017-2022
FIG. 18 Global Beans Segment Y-o-Y Growth Rate, By Region, 2015-2022
FIG. 19 Global Chicken Segment Market Value (US$ Mn) By Region, 2012-2016
FIG. 20 Global Chicken Segment Market Value (US$ Mn) By Region, 2017-2022
FIG. 21 Global Chicken Segment Y-o-Y Growth Rate, By Region, 2015-2022
FIG. 22 Global Beef Segment Market Value (US$ Mn) By Region, 2012-2016
FIG. 23 Global Beef Segment Market Value (US$ Mn) By Region, 2017-2022
FIG. 24 Global Beef Segment Y-o-Y Growth Rate, By Region, 2015-2022
FIG. 25 Global Broths Segment Market Value (US$ Mn) By Region, 2012-2016
FIG. 26 Global Broths Segment Market Value (US$ Mn) By Region, 2017-2022
FIG. 27 Global Broths Segment Y-o-Y Growth Rate, By Region, 2015-2022
FIG. 28 Global Artichokes Segment Market Value (US$ Mn) By Region, 2012-2016
FIG. 29 Global Artichokes Segment Market Value (US$ Mn) By Region, 2017-2022
FIG. 30 Global Artichokes Segment Y-o-Y Growth Rate, By Region, 2015-2022
FIG. 31 Global Mixed Vegetables Segment Market Value (US$ Mn) By Region, 2012-2016
FIG. 32 Global Mixed Vegetables Segment Market Value (US$ Mn) By Region, 2017-2022
FIG. 33 Global Mixed Vegetables Segment Y-o-Y Growth Rate, By Region, 2015-2022
FIG. 34 Global Other Ingredients Segment Market Value (US$ Mn) By Region, 2012-2016
FIG. 35 Global Other Ingredients Segment Market Value (US$ Mn) By Region, 2017-2022
FIG. 36 Global Other Ingredients Segment Y-o-Y Growth Rate, By Region, 2015-2022
FIG. 37 North America Canned Soups Market Value (US$ Mn), By Product Type 2012-2016
FIG. 38 North America Canned Soups Market Value (US$ Mn), By Product Type 2017-2022
FIG. 39 North America Canned Soups Market Value (US$ Mn), By Ingredient 2012-2016
FIG. 40 North America Canned Soups Market Value (US$ Mn), By Ingredient 2017-2022
FIG. 41 Latin America Canned Soups Market Value (US$ Mn), By Product Type 2012-2016
FIG. 42 Latin America Canned Soups Market Value (US$ Mn), By Product Type 2017-2022
FIG. 43 Latin America Canned Soups Market Value (US$ Mn), By Ingredient 2012-2016
FIG. 44 Latin America Canned Soups Market Value (US$ Mn), By Ingredient 2017-2022
FIG. 45 Europe Canned Soups Market Value (US$ Mn), By Product Type 2012-2016
FIG. 46 Europe Canned Soups Market Value (US$ Mn), By Product Type 2017-2022
FIG. 47 Europe Canned Soups Market Value (US$ Mn), By Ingredient 2012-2016
FIG. 48 Europe Canned Soups Market Value (US$ Mn), By Ingredient 2017-2022
FIG. 49 Japan Canned Soups Market Value (US$ Mn), By Product Type 2012-2016
FIG. 50 Japan Canned Soups Market Value (US$ Mn), By Product Type 2017-2022
FIG. 51 Japan Canned Soups Market Value (US$ Mn), By Ingredient 2012-2016
FIG. 52 Japan Canned Soups Market Value (US$ Mn), By Ingredient 2017-2022
FIG. 53 APEJ Canned Soups Market Value (US$ Mn), By Product Type 2012-2016
FIG. 54 APEJ Canned Soups Market Value (US$ Mn), By Product Type 2017-2022
FIG. 55 APEJ Canned Soups Market Value (US$ Mn), By Ingredient 2012-2016
FIG. 56 APEJ Canned Soups Market Value (US$ Mn), By Ingredient 2017-2022
FIG. 57 MEA Canned Soups Market Value (US$ Mn), By Product Type 2012-2016
FIG. 58 MEA Canned Soups Market Value (US$ Mn), By Product Type 2017-2022
FIG. 59 MEA Canned Soups Market Value (US$ Mn), By Ingredient 2012-2016
FIG. 60 MEA Canned Soups Market Value (US$ Mn), By Ingredient 2017-2022
Copyright © Transparency Market Research, Inc. All Rights reserved
Trust Online

Canned Soups Market