
Reports
Reports
Global Big Data in Oil and Gas Market: Snapshot
The data generated in the oil and gas industry in growing in terms of variety, volume, and velocity. Therefore, there is a need for new technologies to interpret and integrate such a large amount of data available in structure and unstructured manner. This data is generated on a regular basis from different sources such as geological data, seismic data, well logging data, and others, thus, growing the need for systematic system to analysis this data. Various information technology providers are working cautiously to come up with solution that may create new opportunities to capture the big data market. In addition, researching tools capable to process Big Data in the oil and gas industry are has also gained traction.
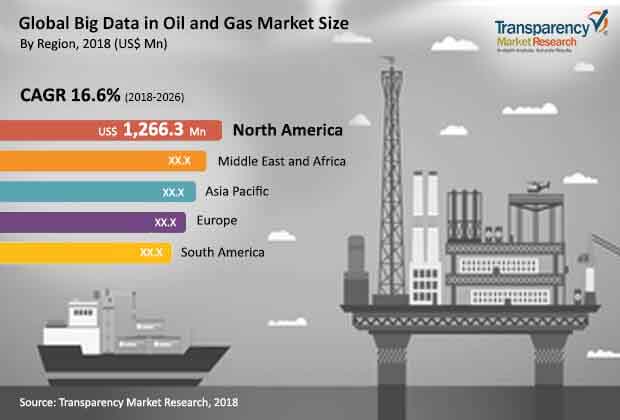
In a recent report published by Transparency Market Research (TMR), the global big data in oil and gas market is projected to rise at a healthy 16.6% CAGR throughout the forecast period between 2018 and 2026. The valuation of the global big data in oil and gas market is projected to reach US$10.93 bn by the end of 2026.
Increasing Spending On IT in Upstream Sector to Boost Demand for Big Data in Oil and Gas Industry
The global big data in oil and gas market is classified on the basis of component, data type, and application. Based on type of data, the market is segmented into structured, unstructured, and semi-structured data. Out of these, unstructured data segment is projected to dominate the market during the forecast period because of rising production of unstructured data from various sources such as well data, sensor data, geological data, environmental data, oceanographic data, and other data sources. Based on component the market is bifurcated into software and services segments. The big data software segment is further divided into data collection, data analytics, data management, and data discovery and visualization. The big data services includes system integration, consulting, operation and maintenance.
On the basis of application, the market is segmented into upstream, midstream, downstream, and administration. According to the report, upstream application segment is likely to hold 50% of the global market. The dominance of this segment is because of rising IT spending in the upstream sector of oil and gas industry.
Increasing Oil Production in North America to Assist Market Growth
Based on regional analysis, North America is leading the market by holding 39% share globally. The reason behind this growth is increasing oil production in the region that further boost the demand for big data analytics to gain operational efficiency. The U.S. leads the production of oil and gas and holds 15% in the total oil production at the global level. Thus, creating lucrative opportunities for adopting big data in oil and gas in the region.
On the other hand, Asia Pacific and the Middle East and Africa are projected to grow significantly over the forecast period. Growing adoption of advanced technology solutions in the oil and gas industry in Russia, Canada, China, the U.S., and across GCC countries is projected to offer lucrative opportunities for the big data in oil and gas market.
The report has also consists of the prominent players in the global big data in oil and gas market. To name some of the major players in the market are HortonWorks, Inc., Hitachi Vantara Corporation, IBM Corporation, Microsoft Corporation, MapR Technologies, Inc., and Oracle Corporation.
1. Preface
1.1. Market Scope
1.2. Market Segmentation
1.3. Key Research Objectives
2. Assumptions and Research Methodology
2.1. Market Taxonomy - Segment Definitions
2.2. Research Methodology
2.2.1. List of Primary and Secondary Sources
2.3. Key Assumptions for Data Modeling
3. Executive Summary : Global Big Data in Oil & Gas
4. Market Overview
4.1. Introduction
4.2. Global Market – Macro Economic Factors Overview
4.3. Porter’s Five Forces Analysis - Global Big Data in Oil & Gas
4.4. Technology/Product Roadmap
4.5. Ecosystem Analysis - Global Big Data in Oil & Gas
4.6. Market Dynamics
4.6.1. Drivers
4.6.2. Restraints
4.6.3. Opportunities
4.6.4. Impact Analysis of Drivers & Restraints
4.7. Regulations and Policies – By Region
4.8. Big Data Spending Analysis (2017)
4.8.1. IT spending CAPEX analysis for Oil & Gas
4.8.2. IT Spending, by Type (US$ Mn)
4.8.2.1. Hardware
4.8.2.2. Software/Platform
4.8.2.3. Services
4.9. Impact of IoT on Big Data Analytics in Oil & Gas
4.10. Big Data Source Analysis (US$ Mn)
4.10.1. Environmental
4.10.2. Oceanographic
4.10.3. Geological Data
4.10.4. Economic
4.10.5. Others
4.11. Market Outlook
4.12. Competitive Scenario and Trends
4.12.1. List of New Entrants
4.12.2. Mergers & Acquisitions, Expansions
5. Global Big Data in Oil & Gas Analysis and Forecast, by Component
5.1. Overview
5.2. Big Data in Oil & Gas Size (US$ Mn) Forecast, By Component, 2016 - 2026
5.2.1. Software
5.2.1.1. Data Analytics
5.2.1.2. Data Collection
5.2.1.3. Data Discovery and Visualization
5.2.1.4. Data Management
5.2.2. Services
5.2.2.1. Consulting
5.2.2.2. System Integration
5.2.2.3. Operation and Maintenance
5.3. Market Attractiveness by Component
6. Global Big Data in Oil & Gas Analysis and Forecast, by Data Type
6.1. Overview & Definition
6.2. Big Data in Oil & Gas Size (US$ Mn and Terabytes) Forecast, by Data Type, 2016 - 2026
6.2.1. Structured Data
6.2.2. Unstructured Data
6.2.3. Semi-Structured Data
6.3. Market Attractiveness by Data Type
7. Global Big Data in Oil & Gas Analysis and Forecast, by Application
7.1. Overview
7.2. Key Trends
7.3. Big Data in Oil & Gas Size (US$ Mn and Terabytes) Forecast, by Application, 2016 - 2026
7.3.1. Upstream
7.3.1.1. Conventional
7.3.1.2. Unconventional
7.3.2. Midstream
7.3.3. Downstream
7.3.4. Administration
7.4. Market Attractiveness by Application
8. Global Big Data in Oil & Gas Analysis and Forecast, by Region
8.1. Key Findings
8.2. Big Data in Oil & Gas Size (US$ Mn and Terabytes) Forecast, by Region, 2016 - 2026
8.2.1. North America
8.2.2. Europe
8.2.3. Asia Pacific
8.2.4. Middle East & Africa
8.2.5. South America
8.3. Market Attractiveness by Region
9. North America Big Data in Oil & Gas Analysis and Forecast
9.1. Key Findings
9.2. Key Trends
9.3. Big Data in Oil & Gas Size (US$ Mn) Forecast, by Component, 2016 - 2026
9.3.1. Software
9.3.1.1. Data Analytics
9.3.1.2. Data Collection
9.3.1.3. Data Discovery and Visualization
9.3.1.4. Data Management
9.3.2. Services
9.3.2.1. Consulting
9.3.2.2. System Integration
9.3.2.3. Operation and Maintenance
9.4. Big Data in Oil & Gas Size (US$ Mn and Terabytes) Forecast, by Data Type, 2016 - 2026
9.4.1. Structured Data
9.4.2. Unstructured Data
9.4.3. Semi-Structured Data
9.5. Big Data in Oil & Gas Size (US$ Mn and Terabytes) Forecast, by Application, 2016 - 2026
9.5.1. Upstream
9.5.1.1. Conventional
9.5.1.2. Unconventional
9.5.2. Midstream
9.5.3. Downstream
9.5.4. Administration
9.6. Big Data in Oil & Gas Size (US$ Mn and Terabytes) Forecast, by Country, 2016 - 2026
9.6.1. The U.S.
9.6.2. Canada
9.6.3. Rest of North America
9.7. Market Attractiveness Analysis
9.7.1. by Component
9.7.2. by Data Type
9.7.3. by Application
9.7.4. by Country
10. Europe Big Data in Oil & Gas Analysis and Forecast
10.1. Key Findings
10.2. Key Trends
10.3. Big Data in Oil & Gas Size (US$ Mn) Forecast, by Component, 2016 - 2026
10.3.1. Software
10.3.1.1. Data Analytics
10.3.1.2. Data Collection
10.3.1.3. Data Discovery and Visualization
10.3.1.4. Data Management
10.3.2. Services
10.3.2.1. Consulting
10.3.2.2. System Integration
10.3.2.3. Operation and Maintenance
10.4. Big Data in Oil & Gas Size (US$ Mn and Terabytes) Forecast, by Data Type, 2016 - 2026
10.4.1. Structured Data
10.4.2. Unstructured Data
10.4.3. Semi-Structured Data
10.5. Big Data in Oil & Gas Size (US$ Mn and Terabytes) Forecast, by Application, 2016 - 2026
10.5.1. Upstream
10.5.1.1. Conventional
10.5.1.2. Unconventional
10.5.2. Midstream
10.5.3. Downstream
10.5.4. Administration
10.6. Big Data in Oil & Gas Size (US$ Mn and Terabytes) Forecast, by Country, 2016 - 2026
10.6.1. Germany
10.6.2. France
10.6.3. UK
10.6.4. Rest of Europe
10.7. Market Attractiveness Analysis
10.7.1. by Component
10.7.2. by Data Type
10.7.3. by Application
10.7.4. by Country
11. Asia Pacific Big Data in Oil & Gas Analysis and Forecast
11.1. Key Findings
11.2. Key Trends
11.3. Big Data in Oil & Gas Size (US$) Forecast, by Component, 2016 - 2026
11.3.1. Software
11.3.1.1. Data Analytics
11.3.1.2. Data Collection
11.3.1.3. Data Discovery and Visualization
11.3.1.4. Data Management
11.3.2. Services
11.3.2.1. Consulting
11.3.2.2. System Integration
11.3.2.3. Operation and Maintenance
11.4. Big Data in Oil & Gas Size (US$ Mn and Terabytes) Forecast, by Data Type, 2016 - 2026
11.4.1. Structured Data
11.4.2. Unstructured Data
11.4.3. Semi-Structured Data
11.5. Big Data in Oil & Gas Size (US$ Mn and Terabytes) Forecast, by Application, 2016 - 2026
11.5.1. Upstream
11.5.1.1. Conventional
11.5.1.2. Unconventional
11.5.2. Midstream
11.5.3. Downstream
11.5.4. Administration
11.6. Big Data in Oil & Gas Size (US$ Mn and Terabytes) Forecast, by Country, 2016 - 2026
11.6.1. China
11.6.2. Japan
11.6.3. India
11.6.4. Australia
11.6.5. Rest of Asia Pacific
11.7. Market Attractiveness Analysis
11.7.1. by Component
11.7.2. by Data Type
11.7.3. by Application
11.7.4. by Country
12. Middle East & Africa (MEA) Big Data in Oil & Gas Analysis and Forecast
12.1. Key Findings
12.2. Key Trends
12.3. Big Data in Oil & Gas Size (US$) Forecast, by Component, 2016 - 2026
12.3.1. Software
12.3.1.1. Data Analytics
12.3.1.2. Data Collection
12.3.1.3. Data Discovery and Visualization
12.3.1.4. Data Management
12.3.2. Services
12.3.2.1. Consulting
12.3.2.2. System Integration
12.3.2.3. Operation and Maintenance
12.4. Big Data in Oil & Gas Size (US$ Mn and Terabytes) Forecast, by Data Type, 2016 - 2026
12.4.1. Structured Data
12.4.2. Unstructured Data
12.4.3. Semi-Structured Data
12.5. Big Data in Oil & Gas Size (US$ Mn and Terabytes) Forecast, by Application, 2016 - 2026
12.5.1. Upstream
12.5.1.1. Conventional
12.5.1.2. Unconventional
12.5.2. Midstream
12.5.3. Downstream
12.5.4. Administration
12.6. Big Data in Oil & Gas Size (US$ Mn and Terabytes) Forecast, by Country, 2016 - 2026
12.6.1. GCC
12.6.2. South Africa
12.6.3. Rest of MEA
12.7. Market Attractiveness Analysis
12.7.1. by Component
12.7.2. by Data Type
12.7.3. by Application
12.7.4. by Country
13. South America Big Data in Oil & Gas Analysis and Forecast
13.1. Key Findings
13.2. Key Trends
13.3. Big Data in Oil & Gas Size (US$ Mn) Forecast, by Component, 2016 - 2026
13.3.1. Software
13.3.1.1. Data Analytics
13.3.1.2. Data Collection
13.3.1.3. Data Discovery and Visualization
13.3.1.4. Data Management
13.3.2. Services
13.3.2.1. Consulting
13.3.2.2. System Integration
13.3.2.3. Operation and Maintenance
13.4. Big Data in Oil & Gas Size (US$ Mn and Terabytes) Forecast, by Data Type, 2016 - 2026
13.4.1. Structured Data
13.4.2. Unstructured Data
13.4.3. Semi-Structured Data
13.5. Big Data in Oil & Gas Size (US$ Mn and Terabytes) Forecast, by Application, 2016 - 2026
13.5.1. Upstream
13.5.1.1. Conventional
13.5.1.2. Unconventional
13.5.2. Midstream
13.5.3. Downstream
13.5.4. Administration
13.6. Big Data in Oil & Gas Size (US$ Mn and Terabytes) Forecast, by Country, 2016 - 2026
13.6.1. Brazil
13.6.2. Rest of South America
13.7. Market Attractiveness Analysis
13.7.1. by Component
13.7.2. by Data Type
13.7.3. by Application
13.7.4. by Industry
13.7.5. by Country
14. Competition Landscape
14.1. Market Player – Competition Matrix
14.2. Market Revenue Share Analysis (%), by Company (2017)
15. Company Profiles(Details – Basic Overview, , Key Competitors, Revenue, Strategy, Recent Developments)
15.1. Accenture\
15.1.1. Overview
15.1.2. SWOT
15.1.3. Financial Overview
15.1.4. Strategy
15.2. Datameer
15.2.1. Overview
15.2.2. SWOT
15.2.3. Financial Overview
15.2.4. Strategy
15.3. Datawatch
15.3.1. Overview
15.3.2. SWOT
15.3.3. Financial Overview
15.3.4. Strategy
15.4. Drillinginfo Inc.
15.4.1. Overview
15.4.2. SWOT
15.4.3. Financial Overview
15.4.4. Strategy
15.5. General Electric
15.5.1. Overview
15.5.2. SWOT
15.5.3. Financial Overview
15.5.4. Strategy
15.6. Hitachi Vantara Corporation
15.6.1. Overview
15.6.2. SWOT
15.6.3. Financial Overview
15.6.4. Strategy
15.7. Hortonworks Inc.
15.7.1. Overview
15.7.2. SWOT
15.7.3. Financial Overview
15.7.4. Strategy
15.8. International Business Machines Corporation
15.8.1. Overview
15.8.2. SWOT
15.8.3. Financial Overview
15.8.4. Strategy
15.9. MapR Technologies, Inc.
15.9.1. Overview
15.9.2. SWOT
15.9.3. Financial Overview
15.9.4. Strategy
15.10. Microsoft Corporation
15.10.1. Overview
15.10.2. SWOT
15.10.3. Financial Overview
15.10.4. Strategy
15.11. Northwest Analytics Inc.
15.11.1. Overview
15.11.2. SWOT
15.11.3. Financial Overview
15.11.4. Strategy
15.12. Oracle Corporation
15.12.1. Overview
15.12.2. SWOT
15.12.3. Financial Overview
15.12.4. Strategy
15.13. OSIsoft
15.13.1. Overview
15.13.2. SWOT
15.13.3. Financial Overview
15.13.4. Strategy
15.14. Palantir Economic Solutions Ltd
15.14.1. Overview
15.14.2. SWOT
15.14.3. Financial Overview
15.14.4. Strategy
15.15. SAP SE
15.15.1. Overview
15.15.2. SWOT
15.15.3. Financial Overview
15.15.4. Strategy
15.16. SAS Institute Inc.
15.16.1. Overview
15.16.2. SWOT
15.16.3. Financial Overview
15.16.4. Strategy
15.17. Capgemini SE
15.17.1. Overview
15.17.2. SWOT
15.17.3. Financial Overview
15.17.4. Strategy
15.18. Cloudera, Inc.
15.18.1. Overview
15.18.2. SWOT
15.18.3. Financial Overview
15.18.4. Strategy
16. Key Takeaways
List of Tables
Table 1: Big Data in Oil and Gas Market, By Data Source (US$ Mn)
Table 2: Global Big Data in Oil and Gas Market Revenue (US$ Mn) Forecast, By Component, 2016 - 2026
Table 3: Global Big Data in Oil and Gas Market Revenue (US$ Mn) Forecast, By Software, 2016 - 2026
Table 4: Global Big Data in Oil and Gas Market Revenue (US$ Mn) Forecast, By Services, 2016 - 2026
Table 5: Global Big Data in Oil and Gas Market Revenue (US$ Mn) Forecast, By Data Type, 2016 - 2026
Table 6: Global Big Data in Oil and Gas Market Revenue (US$ Mn) Forecast, By Application, 2016 - 2026
Table 7: Global Big Data in Oil and Gas Market Revenue (US$ Mn) Forecast, By Region, 2016 - 2026
Table 8: North America Big Data in Oil and Gas Market Revenue (US$ Mn) Forecast, By Component, 2016 - 2026
Table 9: North America Big Data in Oil and Gas Market Revenue (US$ Mn) Forecast, By Software, 2016 - 2026
Table 10: North America Big Data in Oil and Gas Market Revenue (US$ Mn) Forecast, By Services, 2016 - 2026
Table 11: North America Big Data in Oil and Gas Market Revenue (US$ Mn) Forecast, By Data Type, 2016 - 2026
Table 12: North America Big Data in Oil and Gas Market Revenue (US$ Mn) Forecast, By Application, 2016 - 2026
Table 13: North America Big Data in Oil and Gas Market Revenue (US$ Mn) Forecast, By Country, 2016 - 2026
Table 14: Europe Big Data in Oil and Gas Market Revenue (US$ Mn) Forecast, By Component, 2016 - 2026
Table 15: Europe Big Data in Oil and Gas Market Revenue (US$ Mn) Forecast, By Software, 2016 - 2026
Table 16: Europe Big Data in Oil and Gas Market Revenue (US$ Mn) Forecast, By Services, 2016 - 2026
Table 17: Europe Big Data in Oil and Gas Market Revenue (US$ Mn) Forecast, By Data Type, 2016 - 2026
Table 18: Europe Big Data in Oil and Gas Market Revenue (US$ Mn) Forecast, By Application, 2016 - 2026
Table 19: Europe Big Data in Oil and Gas Market Revenue (US$ Mn) Forecast, By Country, 2016 - 2026
Table 20: Asia Pacific Big Data in Oil and Gas Market Revenue (US$ Mn) Forecast, By Component, 2016 - 2026
Table 21: Asia Pacific Big Data in Oil and Gas Market Revenue (US$ Mn) Forecast, By Software, 2016 - 2026
Table 22: Asia Pacific Big Data in Oil and Gas Market Revenue (US$ Mn) Forecast, By Services, 2016 - 2026
Table 23: Asia Pacific Big Data in Oil and Gas Market Revenue (US$ Mn) Forecast, By Data Type, 2016 - 2026
Table 24: Asia Pacific Big Data in Oil and Gas Market Revenue (US$ Mn) Forecast, By Application, 2016 - 2026
Table 25: Asia Pacific Big Data in Oil and Gas Market Revenue (US$ Mn) Forecast, By Country, 2016 - 2026
Table 26: Middle East and Africa Big Data in Oil and Gas Market Revenue (US$ Mn) Forecast, By Component, 2016 - 2026
Table 27: Middle East and Africa Big Data in Oil and Gas Market Revenue (US$ Mn) Forecast, By Software, 2016 - 2026
Table 28: Middle East and Africa Big Data in Oil and Gas Market Revenue (US$ Mn) Forecast, By Services, 2016 - 2026
Table 29: Middle East and Africa Big Data in Oil and Gas Market Revenue (US$ Mn) Forecast, By Data Type, 2016 - 2026
Table 31: Middle East & Africa Big Data in Oil and Gas Market Revenue (US$ Mn) Forecast, By Country, 2016 - 2026
Table 32: South America Big Data in Oil and Gas Market Revenue (US$ Mn) Forecast, By Component, 2016 - 2026
Table 33: South America Big Data in Oil and Gas Market Revenue (US$ Mn) Forecast, By Software, 2016 - 2026
Table 34: South America Big Data in Oil and Gas Market Revenue (US$ Mn) Forecast, By Services, 2016 - 2026
Table 35: South America Big Data in Oil and Gas Market Revenue (US$ Mn) Forecast, By Data Type, 2016 - 2026
Table 36: South America Big Data in Oil and Gas Market Revenue (US$ Mn) Forecast, By Application, 2016 - 2026
Table 37: South America Big Data in Oil and Gas Market Revenue (US$ Mn) Forecast, By Country, 2016 - 2026
List of Figures
Figure 1: Research Methodology
Figure 2: Big Data in Oil and Gas Market
Figure 3: Global Oil and Gas CAPEX (US$ Bn), 2015 – 2027
Figure 4: Global Oil and Gas IT Spending CAPEX (US$ Bn), 2015 – 2027
Figure 5: Global Oil and Gas IT Spending CAPEX, By Type (US$ Bn)
Figure 6: Global Oil and Gas IT Spending CAPEX, By Type (% Share)
Figure 7: Global Big Data in Oil and Gas Market Revenue (US$ Mn) and Y-o-Y Forecast, 2018– 2026
Figure 8: Global Big Data in Oil and Gas Opportunity Growth Analysis (US$ Mn) Forecast, 2016 – 2026
Figure 9: Global Big Data in Oil and Gas Market Share Analysis, By Component (2018)
Figure 10: Global Big Data in Oil and Gas Market Share Analysis, By Component (2026)
Figure 11: Global Big Data in Oil and Gas Market Share Analysis, By Software (2018)
Figure 12: Global Big Data in Oil and Gas Market Share Analysis, By Software (2026)
Figure 13: Global Big Data in Oil and Gas Market Share Analysis, By Services (2018)
Figure 14: Global Big Data in Oil and Gas Market Share Analysis, By Services (2026)
Figure 15: Global Big Data in Oil and Gas Market Attractiveness Analysis, By Component, 2016 - 2026
Figure 16: Global Big Data in Oil and Gas Market Attractiveness Analysis, By Software, 2016 - 2026
Figure 17: Global Big Data in Oil and Gas Market Attractiveness Analysis, By Services, 2016 - 2026
Figure 18: Global Big Data in Oil and Gas Market Share Analysis, By Data Type (2018)
Figure 19: Global Big Data in Oil and Gas Market Share Analysis, By Data Type (2026)
Figure 20: Global Big Data in Oil and Gas Market Attractiveness Analysis, By Data Type, 2016 - 2026
Figure 21: Global Big Data in Oil and Gas Market Share Analysis, By Application (2018)
Figure 22: Global Big Data in Oil and Gas Market Share Analysis, By Application (2026)
Figure 23: Global Big Data in Oil and Gas Market Attractiveness Analysis, By Application, 2016 - 2026
Figure 24: Global Big Data in Oil and Gas Market Share Analysis, By Region (2018)
Figure 25: Global Big Data in Oil and Gas Market Share Analysis, By Region (2026)
Figure 26: Global Big Data in Oil and Gas Market Attractiveness Analysis, by Region
Figure 27: North America Big Data in Oil and Gas Market Revenue (US$ Mn) and Y-o-Y Forecast, 2018– 2026
Figure 28: North America Big Data in Oil and Gas Opportunity Growth Analysis (US$ Mn) Forecast, 2016 – 2026
Figure 29: North America Big Data in Oil and Gas Market Share Analysis, By Component (2018)
Figure 30: North America Big Data in Oil and Gas Market Share Analysis, By Component (2026)
Figure 31:North America Big Data in Oil and Gas Market Share Analysis, By Software (2018)
Figure 32: North America Big Data in Oil and Gas Market Share Analysis, By Software (2026)
Figure 33: North America Big Data in Oil and Gas Market Share Analysis, By Services (2018)
Figure 34: North America Big Data in Oil and Gas Market Share Analysis, By Services (2026)
Figure 35: North America Big Data in Oil and Gas Market Share Analysis, By Data Type (2018)
Figure 36: North America Big Data in Oil and Gas Market Share Analysis, By Data Type (2026)
Figure 37: North America Big Data in Oil and Gas Market Share Analysis, By Application (2018)
Figure 38: North America Big Data in Oil and Gas Market Share Analysis, By Application (2026)
Figure 39: North America Big Data in Oil and Gas Market Share Analysis, By Country (2018)
Figure 40: North America Big Data in Oil and Gas Market Share Analysis, By Country (2026)
Figure 41: North America Big Data in Oil and Gas Market Attractiveness Forecast, By Component, 2016 - 2026
Figure 42: North America Big Data in Oil and Gas Market Attractiveness, By Software, 2016 - 2026
Figure 43: North America Big Data in Oil and Gas Market Attractiveness, By Services, 2016 - 2026
Figure 44: North America Big Data in Oil and Gas Market Attractiveness, By Data Type, 2016 - 2026
Figure 45: North America Big Data in Oil and Gas Market Attractiveness, By Application, 2016 - 2026
Figure 46: Europe Big Data in Oil and Gas Market Revenue (US$ Mn) and Y-o-Y Forecast, 2018– 2026
Figure 47: Europe Big Data in Oil and Gas Opportunity Growth Analysis (US$ Mn) Forecast, 2016 – 2026
Figure 48: Europe Big Data in Oil and Gas Market Share Analysis, By Component (2018)
Figure 49: Europe Big Data in Oil and Gas Market Share Analysis, By Component (2026)
Figure 50: Europe Big Data in Oil and Gas Market Share Analysis, By Software (2018)
Figure 51: Europe Big Data in Oil and Gas Market Share Analysis, By Software (2026)
Figure 52: Europe Big Data in Oil and Gas Market Share Analysis, By Services (2018)
Figure 53: Europe Big Data in Oil and Gas Market Share Analysis, By Services (2026)
Figure 54: Europe Big Data in Oil and Gas Market Share Analysis, By Data Type (2018)
Figure 55: Europe Big Data in Oil and Gas Market Share Analysis, By Data Type (2026)
Figure 56: Europe Big Data in Oil and Gas Market Share Analysis, By Application (2018)
Figure 57: Europe Big Data in Oil and Gas Market Share Analysis, By Application (2026)
Figure 58: Europe Big Data in Oil and Gas Market Share Analysis, By Country (2018)
Figure 59: Europe Big Data in Oil and Gas Market Share Analysis, By Country (2026)
Figure 60: Europe Big Data in Oil and Gas Market Attractiveness Forecast, By Component, 2016 - 2026
Figure 61: Europe Big Data in Oil and Gas Market Attractiveness, By Software, 2016 - 2026
Figure 62: Europe Big Data in Oil and Gas Market Attractiveness, By Services, 2016 - 2026
Figure 63: Europe Big Data in Oil and Gas Market Attractiveness, By Data Type, 2016 - 2026
Figure 64: Europe Big Data in Oil and Gas Market Attractiveness, By Application, 2016 - 2026
Figure 65: Asia Pacific Big Data in Oil and Gas Market Revenue (US$ Mn) and Y-o-Y Forecast, 2018– 2026
Figure 66: Asia Pacific Big Data in Oil and Gas Opportunity Growth Analysis (US$ Mn) Forecast, 2016 – 2026
Figure 67: Asia Pacific Big Data in Oil and Gas Market Share Analysis, By Component (2018)
Figure 68: Asia Pacific Big Data in Oil and Gas Market Share Analysis, By Component (2026)
Figure 69: Asia Pacific Big Data in Oil and Gas Market Share Analysis, By Software (2018)
Figure 70: Asia Pacific Big Data in Oil and Gas Market Share Analysis, By Software (2026)
Figure 71: Asia Pacific Big Data in Oil and Gas Market Share Analysis, By Services (2018)
Figure 72: Asia Pacific Big Data in Oil and Gas Market Share Analysis, By Services (2026)
Figure 73: Asia Pacific Big Data in Oil and Gas Market Share Analysis, By Data Type (2018)
Figure 74: Asia Pacific Big Data in Oil and Gas Market Share Analysis, By Data Type (2026)
Figure 75: Asia Pacific Big Data in Oil and Gas Market Share Analysis, By Application (2018)
Figure 76: Asia Pacific Big Data in Oil and Gas Market Share Analysis, By Application (2026)
Figure 77: Asia Pacific Big Data in Oil and Gas Market Share Analysis, By Country (2018)
Figure 78: Asia Pacific Talent Big Data in Oil and Gas Market Share Analysis, By Country (2026)
Figure 79: APAC Big Data in Oil and Gas Market Attractiveness Forecast, By Component, 2016 - 2026
Figure 80: APAC Big Data in Oil and Gas Market Attractiveness, By Software, 2016 - 2026
Figure 81: APAC Big Data in Oil and Gas Market Attractiveness, By Services, 2016 - 2026
Figure 82: APAC Big Data in Oil and Gas Market Attractiveness, By Data Type, 2016 - 2026
Figure 83: APAC Big Data in Oil and Gas Market Attractiveness, By Application, 2016 - 2026
Figure 84: Middle East & Africa Big Data in Oil and Gas Market Revenue (US$ Mn) and Y-o-Y Forecast, 2018– 2026
Figure 85: Middle East & Africa Big Data in Oil and Gas Opportunity Growth Analysis (US$ Mn) Forecast, 2016 – 2026
Figure 86: Middle East and Africa Big Data in Oil and Gas Market Share Analysis, By Component (2018)
Figure 87: Middle East and Africa Big Data in Oil and Gas Market Share Analysis, By Component (2026)
Figure 88: Middle East and Africa Big Data in Oil and Gas Market Share Analysis, By Software (2018)
Figure 89: Middle East and Africa Big Data in Oil and Gas Market Share Analysis, By Software (2026)
Figure 90: Middle East and Africa Big Data in Oil and Gas Market Share Analysis, By Services (2018)
Figure 91: Middle East and Africa Big Data in Oil and Gas Market Share Analysis, By Services (2026)
Figure 92: Middle East and Africa Big Data in Oil and Gas Market Share Analysis, By Data Type (2018)
Figure 93: Middle East and Africa Big Data in Oil and Gas Market Share Analysis, By Data Type (2026)
Figure 30: Middle East and Africa Big Data in Oil and Gas Market Revenue (US$ Mn) Forecast, By Application, 2016 - 2026
Figure 94: Middle East and Africa Big Data in Oil and Gas Market Share Analysis, By Application (2018)
Figure 95: Middle East and Africa Big Data in Oil and Gas Market Share Analysis, By Application (2026)
Figure 96: Middle East & Africa Big Data in Oil and Gas Market Share Analysis, By Country (2018)
Figure 97: Middle East & Africa Big Data in Oil and Gas Market Share Analysis, By Country (2026)
Figure 98: Middle East & Africa Big Data in Oil and Gas Market Attractiveness Forecast, By Component, 2016 - 2026
Figure 99: Middle East & Africa Big Data in Oil and Gas Market Attractiveness, By Software, 2016 - 2026
Figure 100: Middle East & Africa Big Data in Oil and Gas Market Attractiveness, By Services, 2016 - 2026
Figure 101: Middle East & Africa Big Data in Oil and Gas Market Attractiveness, By Data Type, 2016 - 2026
Figure 102: Middle East & Africa Big Data in Oil and Gas Market Attractiveness, By Application, 2016 - 2026
Figure 103: South America Big Data in Oil and Gas Market Revenue (US$ Mn) and Y-o-Y Forecast, 2018– 2026
Figure 104: South America Big Data in Oil and Gas Opportunity Growth Analysis (US$ Mn) Forecast, 2016 – 2026
Figure 105: South America Big Data in Oil and Gas Market Share Analysis, By Component (2018)
Figure 106: South America Big Data in Oil and Gas Market Share Analysis, By Component (2026)
Figure 107: South America Big Data in Oil and Gas Market Share Analysis, By Software (2018)
Figure 108: South America Big Data in Oil and Gas Market Share Analysis, By Software (2026)
Figure 109: South America Big Data in Oil and Gas Market Share Analysis, By Services (2018)
Figure 110: South America Big Data in Oil and Gas Market Share Analysis, By Services (2026)
Figure 111: South America Big Data in Oil and Gas Market Share Analysis, By Data Type (2018)
Figure 112: South America Big Data in Oil and Gas Market Share Analysis, By Data Type (2026)
Figure 113: South America Big Data in Oil and Gas Market Share Analysis, By Application (2018)
Figure 114: South America Big Data in Oil and Gas Market Share Analysis, By Application (2026)
Figure 115: South America Big Data in Oil and Gas Market Share Analysis, By Country (2018)
Figure 116: South America Big Data in Oil and Gas Market Share Analysis, By Country (2026)
Figure 117: South America Big Data in Oil and Gas Market Attractiveness Forecast, By Component, 2016 - 2026
Figure 118: South America Big Data in Oil and Gas Market Attractiveness, By Software, 2016 - 2026
Figure 119: South America Big Data in Oil and Gas Market Attractiveness, By Services, 2016 - 2026
Figure 120: South America Big Data in Oil and Gas Market Attractiveness, By Data Type, 2016 - 2026
Figure 121: South America Big Data in Oil and Gas Market Attractiveness, By Application, 2016 - 2026
Copyright © Transparency Market Research, Inc. All Rights reserved
Trust Online

Big Data in Oil and Gas Market