
Reports
Reports
The leading drivers of the global benzaldehyde derivatives market currently include the rising demand for products from the industries of food and beverages, chemicals, agrochemicals, solvents and pharmaceuticals. A rise in the demand for benzaldehyde derivatives in emerging economies from Asia Pacific and the Middle East and Africa is anticipated to further propel the global benzaldehyde derivatives market and is also considered to be a strong opportunity for the globally prominent players. A high demand for solvents from the producers of resins, oils, cellulose acetates, cellulose ethers, and nitrates also presents a key area of opportunities for manufacturers from the global benzaldehyde derivatives market. However, the overall growth rate of this market may receive strong resistance from factors such as growing health concerns of long term exposure to several benzaldehyde derivatives and the growing threat of easily available substitutes in different end-user industries, including propionic and sorbic acids. The global benzaldehyde derivatives market is also being restrained by an overall volatility in crude oil prices and strict regulatory framework surrounding the oil and gas sector.
The global benzaldehyde derivative market was valued at US$1.37 bn in 2015 and is expected to reach US$2.14 bn by the end of 2024, after expanding at a CAGR of 5.1 % from 2016 to 2024.
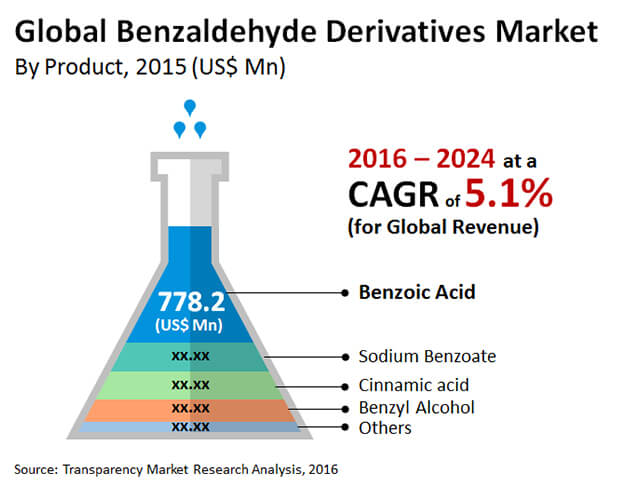
Benzoic acid accounted for the top share in the global benzaldehyde derivatives market in terms of volume as well as revenue generated in 2015, owing to its high rate of use in aromatic products, the food and beverages industry, and the pharmaceutical industry. By volume, benzoic acid was valued at US$778.2 mn within the global benzaldehyde derivatives market in 2015. The share held by benzoic acid in the global benzaldehyde derivatives market is expected to increase over the coming years due to a strong growth in demand from the food and chemicals industries. The growing demand for benzaldehyde derivatives in pharmaceutical and agrochemical industries are also expected to augment their global market over the coming years.
Cinnamic acid also finds large volumes of demand as it is employed in flavors, synthetic indigo dyes and in the manufacture of specific drugs. It is also used in artificial sweeteners within the food industry. Benzoic acid is a commonly used as a food preservative and can inhibit the development of bacteria, molds, and yeasts. Sodium benzoate is another benzaldehyde derivative and finds use in the food industry as well as the pharmaceutical industry. It even has applications in the prevention of surface corrosion.
Asia Pacific held the leading share in the global benzaldehyde derivatives market in terms of volume in 2015. Its nearly 60 % share in the global benzaldehyde derivatives market was attributed to a large consumption base, growth of various end user, and a relatively relaxed regulatory framework that led to a faster rate of development and use in the region’s food and chemical markets. Asia Pacific is expected to also be a highly attractive region till 2024, followed by Europe and North America. China accounted for the leading share in terms of volume within Asia Pacific, followed by Japan and other ASEAN countries. The growth rate of benzaldehyde derivatives in Europe and North America is very slow currently, owing to the maturation of the market and a low rate of product innovations.
Till 2015, the leading players in the global benzaldehyde derivatives market included Emerald Performance Materials, Haihang Industry Co., Ltd, Merck KGaA, Guangzhou Shiny Co., Elan Chemical, Ltd, Kadillac Chemicals Pvt Ltd, Gujarat Alkalis and Chemicals Limited, Wuhan Dico Chemical Co., Ltd , Shimmer Chemicals Pvt. Ltd, Yingcheng Wuhan Organic Material Co., Ltd.
Benzaldehyde Derivatives Market See Massive Potential in Medications and Cosmetics
Aldehyde-derived compounds are well-known for their antimicrobial efficacy, including 4-phenacyloxy benzaldehyde derivatives. Industry players in the benzaldehyde derivatives market are exploring their use in various high-end disinfection applications in different healthcare settings. The growing uptake of antimicrobial agents in these settings is a key driver for sales of various benzaldehyde derivatives. More recently, benzaldehyde derivatives are being studied extensively for pharmaceutical behavior notably as tyrosinase inhibitors. In the past decade, this is opening numerous application areas in the benzaldehyde derivatives market. Some benzalaldehydes have shown potential in making products for the cosmetics, food, and pharmaceutical industries. Since tyrosinase inhibitors show effect as decreasing the excessive accumulation of pigmentation, they are used in various dermatological formulations. Researchers are relying on better theoretical modelling to explore new properties as pharmaceuticals, thereby boosting the benzaldehyde derivatives market. Growing research on studying the pharmaceutical properties of tyrosinase will expand the application potential in all likelihood, as growing body of research has shown in the last 10 – 15 years. Growing application of new technologies for the characterization of aldehyde-based biocides is also favouring the generation of new possibilities for players in the benzaldehyde derivatives market.
The COVID-19 pandemic and the subsequent outbreaks in 2020 and 2021 have caused some of the worst disruptions in the chemical manufacturing. Though there was a brief recovery of economic activities in the last quarter of 2020 and first quarter of 2021, the emergence of new variants has again brought uncertainties in consumer demand and lack of optimism among investors. Thus, the benzaldehyde derivatives market has seen a staggered growth of new manufacturing units. Several companies were also leaning on migrating to new strategic and operational frameworks to reduce the macroeconomic shocks that the pandemic and its outbreaks has caused over the past few months. Even in 2021, the emerging variants of the novel coronavirus continue to alarm governments and businesses. The impacts of all these on dynamics of benzaldehyde derivatives market are yet to unfold in the coming months.
Chapter 1 Preface
1.1 Report Scope and Market Segmentation
1.2 Research Objectives
Chapter 2 Assumptions and Research Methodology
2.1 Assumptions and Acronyms Used
2.2 Research Methodology
Chapter 3 Executive Summary
3.1 Market Size, Indicative (US$ Mn)
3.2 Top 3 Trends
3.3 Top 2 Drivers
3.4 Top Market Restarint
3.5 Total Market Value in US$ Mn
Chapter 4 Market Overview
4.1 Product Overview
4.2 Drivers and Restraints Analysis
4.2.1 Drivers
4.2.2 Restraints
4.2.3 Opportunities
4.3 Value Chain Analysis
4.4 Porter's Analysis
4.4.1 Bargaining Power of Suppliers
4.4.2 Threat of Substitutes
4.4.3 Threat of New Entrants
4.4.4 Bargaining Power of Suppliers
4.4.5 Degree of Competition
Chapter 5 Global Benzaldehyde Derivatives Market: Price Trend Analysis (US$/Tons)
5.1 Market price, by product
Chapter 6 Global Benzaldehyde Derivatives Market by Product
6.1 Product Overview
6.2 Global Benzaldehyde Derivatives Market Value Share Analysis By Product
6.3 Global Benzaldehyde Derivatives Market Size (US$ Mn) and Volume (Kilo Tons) Forecast, by product
6.4 Global Benzaldehyde Derivatives Market Attractiveness Analysis by Product
6.5 Global Benzaldehyde Derivatives Market Value Share Analysis By Region,
6.6 Global Benzaldehyde Derivatives Market Size (US$ Mn) and Volume (Kilo Tons) Forecast, by Region
6.7 Global Benzaldehyde Derivatives Market Attractiveness Analysis, by Region
Chapter 7 North America Benzaldehyde Derivatives Market
7.1 North America Benzaldehyde Derivatives Market Value Share Analysis By Product
7.2 North America Benzaldehyde Derivatives Market Size (US$ Mn) and Volume (Kilo Tons) Forecast, by product
7.3 North America Benzaldehyde Derivatives Market Value Share Analysis, By Country
7.4 North America Benzaldehyde Derivatives Market Size (US$ Mn) and Volume (Kilo Tons) Forecast, by country
7.5 US Benzaldehyde Derivatives Market Size (US$ Mn) and Volume (Kilo Tons) Forecast, by product
7.6 Rest of North America Benzaldehyde Derivatives Market Size (US$ Mn) and Volume (Kilo Tons) Forecast, by product
Chapter 8 Europe Benzaldehyde Derivatives Market
8.1 Europe Benzaldehyde Derivatives Market Value Share Analysis By Product
8.2 Europe Benzaldehyde Derivatives Market Size (US$ Mn) and Volume (Kilo Tons) Forecast, by product
8.3 Europe Benzaldehyde Derivatives Market Value Share Analysis By Country
8.4 Europe Benzaldehyde Derivatives Market Size (US$ Mn) and Volume (Kilo Tons) Forecast, by Country
8.5 UK Benzaldehyde Derivatives Market Size (US$ Mn) and Volume (Kilo Tons) Forecast, by product
8.6 Germany Benzaldehyde Derivatives Market Size (US$ Mn) and Volume (Kilo Tons) Forecast, by product
8.7 France Benzaldehyde Derivatives Market Size (US$ Mn) and Volume (Kilo Tons) Forecast, by product
8.8 Spain Benzaldehyde Derivatives Market Size (US$ Mn) and Volume (Kilo Tons) Forecast, by product
8.9 Italy Benzaldehyde Derivatives Market Size (US$ Mn) and Volume (Kilo Tons) Forecast, by product
8.10 Rest of Europe Benzaldehyde Derivatives Market Size (US$ Mn) and Volume (Kilo Tons) Forecast, by product
Chapter 9 Asia-Pacific Benzaldehyde Derivatives Market
9.1 Asia-Pacific Benzaldehyde Derivatives Market Value Share Analysis By Product
9.2 Asia-Pacific Benzaldehyde Derivatives Benzaldehyde Derivatives Market Size (US$ Mn) and Volume (Kilo Tons) Forecast, by product
9.3 Asia-Pacific Benzaldehyde Derivatives Market Value Share Analysis By Product
9.4 Asia-Pacific Benzaldehyde Derivatives Benzaldehyde Derivatives Market Size (US$ Mn) and Volume (Kilo Tons) Forecast, by Country
9.5 China Benzaldehyde Derivatives Market Size (US$ Mn) and Volume (Kilo Tons) Forecast, by product
9.6 Japan Benzaldehyde Derivatives Benzaldehyde Derivatives Market Size (US$ Mn) and Volume (Kilo Tons) Forecast, by product
9.7 ASEAN Benzaldehyde Derivatives Market Size (US$ Mn) and Volume (Kilo Tons) Forecast, by product
9.8 Rest of Asia Pacific Benzaldehyde Derivatives Market Size (US$ Mn) and Volume (Kilo Tons) Forecast, by product
Chapter 10 Middle East and Africa Benzaldehyde Derivatives Market
10.1 Middle East and Africa Benzaldehyde Derivatives Market Value Share Analysis By Product
10.2 Middle East and Africa Benzaldehyde Derivatives Market Size (US$ Mn) and Volume (Kilo Tons) Forecast, by product
10.3 Middle East and Africa Benzaldehyde Derivatives Market Value Share Analysis By Country
10.4 Middle East and Africa Benzaldehyde Derivatives Market Size (US$ Mn) and Volume (Kilo Tons) Forecast, by country
10.5 GCC Benzaldehyde Derivatives Market Size (US$ Mn) and Volume (Kilo Tons) Forecast, by product
10.6 SA Benzaldehyde Derivatives Market Size (US$ Mn) and Volume (Kilo Tons) Forecast, by product
10.7 SA Benzaldehyde Derivatives Market Size (US$ Mn) and Volume (Kilo Tons) Forecast, by product
Chapter 11 Latin America Benzaldehyde Derivatives Market
11.1 Latin America Benzaldehyde Derivatives Market Value Share Analysis, By Product
11.2 Latin America Benzaldehyde Derivatives Market Size (US$ Mn) and Volume (Kilo Tons) Forecast, by product
11.3 Latin America Benzaldehyde Derivatives Market Value Share Analysis, By Country
11.4 Latin America Benzaldehyde Derivatives Market Size (US$ Mn) and Volume (Kilo Tons) Forecast, by country
11.5 Brazil Benzaldehyde Derivatives Market Size (US$ Mn) and Volume (Kilo Tons) Forecast, by product
11.6 Rest of Latin America Benzaldehyde Derivatives Market Size (US$ Mn) and Volume (Kilo Tons) Forecast, by product
Chapter 12 Competition Landscape
12.1 Global Benzaldehyde Derivatives Market Share Analysis By Company
12.2 Competition Matrix
12.3 Company Profiles
12.3.1 Emerald Performance Materials
12.3.1.1 Company Details
12.3.1.2 Company Description
12.3.1.3 Business Overview
12.3.1.4 SWOT Analysis
12.3.1.5 Breakdown of Net sales, by region
12.3.1.6 Revenue (US$ Bn ) and Y-o-Y Growth (%), 2012-2015
12.3.2 Merck KGaA
12.3.2.1 Company Details
12.3.2.2 Company Description
12.3.2.3 Business Overview
12.3.2.4 SWOT Analysis
12.3.2.5 Breakdown of Net sales, by region
12.3.2.6 Revenue (US$ Bn ) and Y-o-Y Growth (%), 2012-2015
12.3.3 Haihang Industry Co., Ltd
12.3.3.1 Company Details
12.3.3.2 Company Description
12.3.3.3 Business Overview
12.3.3.4 SWOT Analysis
12.3.3.5 Breakdown of Net sales, by region
12.3.3.6 Revenue (US$ Bn ) and Y-o-Y Growth (%), 2012-2015
12.3.4 Elan Chemical
12.3.4.1 Company Details
12.3.4.2 Company Description
12.3.4.3 Business Overview
12.3.4.4 SWOT Analysis
12.3.4.5 Breakdown of Net sales, by region
12.3.4.6 Revenue (US$ Bn ) and Y-o-Y Growth (%), 2012-2015
12.3.5 Guangzhou Shiny Co., Ltd
12.3.5.1 Company Details
12.3.5.2 Company Description
12.3.5.3 Business Overview
12.3.5.4 SWOT Analysis
12.3.5.5 Breakdown of Net sales, by region
12.3.5.6 Revenue (US$ Bn ) and Y-o-Y Growth (%), 2012-2015
12.3.6 Gujarat Alkalies and Chemicals Limited
12.3.6.1 Company Details
12.3.6.2 Company Description
12.3.6.3 Business Overview
12.3.6.4 SWOT Analysis
12.3.6.5 Breakdown of Netsales of production, by product
12.3.6.6 Revenue (US$ Bn) and Y-o-Y Growth (%), 2012–2015
12.3.7 Kadillac Chemicals Pvt Ltd
12.3.7.1 Company Details
12.3.7.2 Company Description
12.3.7.3 Business Overview
12.3.7.4 SWOT Analysis
12.3.7.5 Breakdown of Net sales, by region
12.3.7.6 Revenue (US$ Bn ) and Y-o-Y Growth (%), 2012-2015
12.3.8 Shimmer Chemicals
12.3.8.1 Company Details
12.3.8.2 Company Description
12.3.8.3 Business Overview
12.3.8.4 SWOT Analysis
12.3.8.5 Breakdown of Net sales, by region
12.3.8.6 Revenue (US$ Bn ) and Y-o-Y Growth (%), 2012-2015
12.3.9 Wuhan Dico
12.3.9.1 Company Details
12.3.9.2 Company Description
12.3.9.3 Business Overview
12.3.9.4 SWOT Analysis
12.3.9.5 Breakdown of Net sales, by region
12.3.9.6 Revenue (US$ Bn) and Y-o-Y Growth (%), 2012-2015
12.3.10 Yingcheng Wuhan Organic Material Co., Ltd
12.3.10.1 Company Details
12.3.10.2 Company Description
12.3.10.3 Business Overview
12.3.10.4 SWOT Analysis
12.3.10.5 Breakdown of Net sales, by region
12.3.10.6 Revenue (US$ Bn ) and Y-o-Y Growth (%), 2012-2015
Chapter 13 Key Takeaways
13.1 Primary Research-Key Findings
List of Tables
Table 01 Global Benzaldehyde Derivatives Market Size (US$ Mn) and Volume (Kilo Tons) Forecast, by Product, 2015–2024
Table 02 Global Benzaldehyde Derivatives Market Size (US$ Mn) and Volume (Kilo Tons) Forecast, by Region, 2015–2024
Table 03 North America Benzaldehyde Derivatives Market Size (US$ Mn) and Volume (Kilo Tons) Forecast, by Product, 2015–2024
Table 04 North America Benzaldehyde Derivatives Market Size (US$ Mn) and Volume (Kilo Tons) Forecast, by country, 2015–2024
Table 05 US Benzaldehyde Derivatives Market Size (US$ Mn) and Volume (Kilo Tons) Forecast, by Product, 2015–2024
Table 06 Rest of North America Benzaldehyde Derivatives Market Size (US$ Mn) and Volume (Kilo Tons) Forecast, by Product, 2015–2024
Table 07 Europe Benzaldehyde Derivatives Market Size (US$ Mn) and Volume (Kilo Tons) Forecast, by Product, 2015–2024
Table 08 Europe Benzaldehyde Derivatives Market Size (US$ Mn) and Volume (Kilo Tons) Forecast, by Country, 2015–2024
Table 09 UK Benzaldehyde Derivatives Market Size (US$ Mn) and Volume (Kilo Tons) Forecast, by Product, 2015–2024
Table 10 Germany Benzaldehyde Derivatives Market Size (US$ Mn) and Volume (Kilo Tons) Forecast, by Product, 2015–2024
Table 11 France Benzaldehyde Derivatives Market Size (US$ Mn) and Volume (Kilo Tons) Forecast, by Product, 2015–2024
Table 12 Spain Benzaldehyde Derivatives Market Size (US$ Mn) and Volume (Kilo Tons) Forecast, by Product, 2015–2024
Table 13 Italy Benzaldehyde Derivatives Market Size (US$ Mn) and Volume (Kilo Tons) Forecast, by Product, 2015–2024
Table 14 Rest of Europe Benzaldehyde Derivatives Market Size (US$ Mn) and Volume (Kilo Tons) Forecast, by Product, 2015–2024
Table 15 Asia-Pacific Benzaldehyde Derivatives Market Size (US$ Mn) and Volume (Kilo Tons) Forecast, by Product, 2015–2024
Table 16 Asia-Pacific Benzaldehyde Derivatives Market Size (US$ Mn) and Volume (Kilo Tons) Forecast, by Country, 2015–2024
Table 17 China Benzaldehyde Derivatives Market Size (US$ Mn) and Volume (Kilo Tons) Forecast, by Product, 2015–2024
Table 18 Japan Benzaldehyde Derivatives Market Size (US$ Mn) and Volume (Kilo Tons) Forecast, by Product, 2015–2024
Table 19 ASEAN Benzaldehyde Derivatives Market Size (US$ Mn) and Volume (Kilo Tons) Forecast, by Product, 2015–2024
Table 20 Rest of Asia Pacific Benzaldehyde Derivatives Market Size (US$ Mn) and Volume (Kilo Tons) Forecast, by Product, 2015–2024
Table 21 Middle East and Africa Benzaldehyde Derivatives Market Size (US$ Mn) and Volume (Kilo Tons) Forecast, by Product, 2015–2024
Table 22 Middle East and Africa Benzaldehyde Derivatives Market Size (US$ Mn) and Volume (Kilo Tons) Forecast, by country, 2015–2024
Table 23 GCC Benzaldehyde Derivatives Market Size (US$ Mn) and Volume (Kilo Tons) Forecast, by Product, 2015–2024
Table 24 SA Benzaldehyde Derivatives Market Size (US$ Mn) and Volume (Kilo Tons) Forecast, by Product, 2015–2024
Table 25 SA Benzaldehyde Derivatives Market Size (US$ Mn) and Volume (Kilo Tons) Forecast, by Product, 2015–2024
Table 26 Latin America Benzaldehyde Derivatives Market Size (US$ Mn) and Volume (Kilo Tons) Forecast, by Product, 2015–2024
Table 27 Latin America Benzaldehyde Derivatives Market Size (US$ Mn) and Volume (Kilo Tons) Forecast, by country, 2015–2024
Table 28 Brazil Benzaldehyde Derivatives Market Size (US$ Mn) and Volume (Kilo Tons) Forecast, by Product, 2015–2024
Table 29 Rest of Latin America Benzaldehyde Derivatives Market Size (US$ Mn) and Volume (Kilo Tons) Forecast, by Product, 2015–2024
List of Figures
Figure 01 Prices of benzaldehyde derivatives, by Product, US$/Ton, 2016–2024
Figure 02 Global Benzaldehyde Derivatives Market Value Share Analysis By Product, 2015 and 2024
Figure 03 Global Benzaldehyde Derivatives Market Attractiveness Analysis , by Product
Figure 04 Global Benzaldehyde Derivatives Market Value Share Analysis By Region, 2015 and 2024
Figure 05 Global Benzaldehyde Derivatives Market Attractiveness Analysis , by Region
Figure 06 North America Benzaldehyde Derivatives Market Value Share Analysis By Product, 2015 and 2024
Figure 07 North America Benzaldehyde Derivatives Market Value Share Analysis By Country, 2015 and 2024
Figure 08 Europe Benzaldehyde Derivatives Market Value Share Analysis By Product , 2015 and 2024
Figure 09 Europe Benzaldehyde Derivatives Market Value Share Analysis By Country , 2015 and 2024
Figure 10 Asia-Pacific Benzaldehyde Derivatives Market Value Share Analysis By Product, 2015 and 2024
Figure 11 Asia-Pacific Benzaldehyde Derivatives Market Value Share Analysis By Product, 2015 and 2024
Figure 12 Middle East and Africa Benzaldehyde Derivatives Market Value Share Analysis By Product, 2015 and 2024
Figure 13 Middle East and Africa Benzaldehyde Derivatives Market Value Share Analysis By Country, 2015 and 2024
Figure 14 Latin America Benzaldehyde Derivatives Market Value Share Analysis, By Product, 2015 and 2024
Figure 15 Latin America Benzaldehyde Derivatives Market Value Share Analysis, By Country , 2015 and 2024
Figure 16 Global Benzaldehyde Derivatives Market Share Analysis By Company (2015)
Copyright © Transparency Market Research, Inc. All Rights reserved
Trust Online

Benzaldehyde Derivatives Market