
Reports
Reports
Beef protein powder mimics the nutrient profile of bone broth. Bone broth is made from meat, poultry, and fish bones, and provides concentrated healing. However, consumers have an undesirable feeling towards the whole process of making bone broth, as it requires time, patience, and hours of simmering the bones and meat.
The beef protein powder market is anticipated to grow at a CAGR of ~6%, to reach a value of ~US$ 1.3 Bn by 2029. In the food and nutrition landscape, consumers are getting attracted to the beef protein powder market, as this powder doesn’t require the tedious making of bone broth. It has similar nutrient profile like bone broth, and high amounts of collagen-specific amino acids. Beef-based collagen supplements support skin health and slow down the aging process.
The outlook of the beef protein powder market also looks positive since beef protein powder is highly recommended for consumers who aim to gain complete proteins from a paleo diet. This powder acts as an effective alternative for regular-day dairy products and legumes, and is also beneficial to individuals who want to consume beef protein without eating meat.
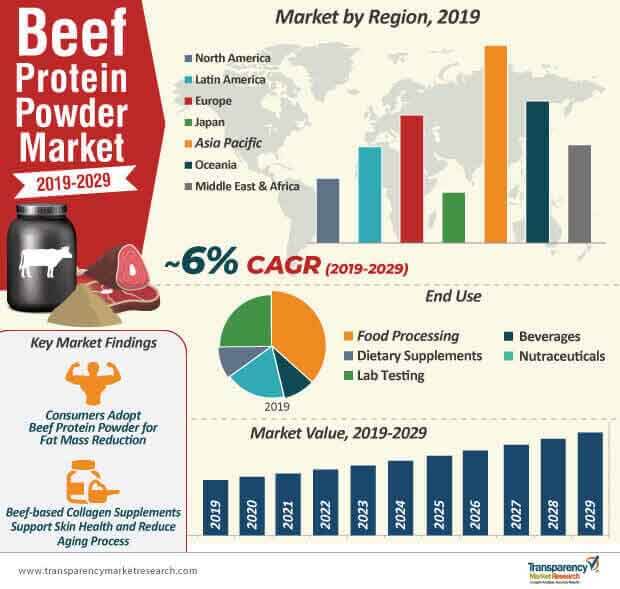
The impressive amino acid profile of beef protein powder is gaining consumer attention for increased muscle mass and fat loss. Compared to placebos, beef-based collagen peptide supplements combined with resistance training helps develop lean mass and strength, especially in elderly men. Since beef protein powder contains similar proportion of essential amino acids found in human the skeletal muscle, it is beneficial in acquiring a favorable body composition, thus contributing to the impressive growth of the beef protein powder market.
Beef protein powder also has higher protein content as compared to whey protein supplements and carbohydrates. This powder is highly recommended for individuals who combine resistance training with cardio sessions, as the beef protein isolate in supplements helps increase lean mass. Beef protein prevents muscle breakdown in individuals undergoing intense triathlon training. This powder boosts ferritin concentrations and leverages the iron status in athletes, which is less likely with the consumption of whey protein and carbohydrate sources.
Hydrolyzed beef protein is being consumed in shakes post workouts, which benefits consumers with extra zinc, folic acid, iron, and vitamin B12 (Cobalamin). Beef protein powder shakes help combat vitamin and mineral deficiencies commonly observed in athletes, which adds further value to increased muscle mass. All these factors are contributing to the growth of the beef protein powder market.
Although beef protein powder serves as a powerhouse of proteins, the isolate and hydrolysate content in whey protein supplements is much higher as compared to beef protein. This is why consumers opt for whey protein to achieve improved digestion and support their immune system. Also, beef protein isolate contains lower bioavailability and lower leucine content as compared to whey protein. Whey protein tastes better than beef protein and provides better texture in shakes mixed with milk or water.
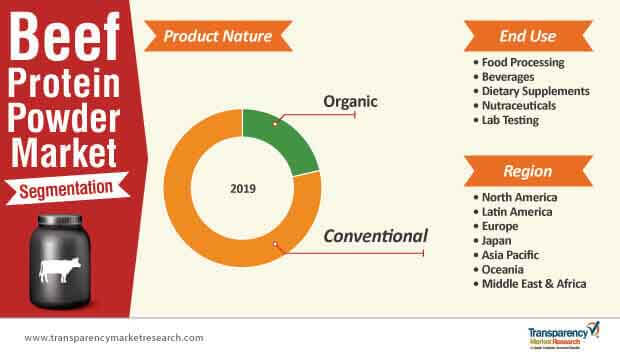
To overcome its limitations, beef protein powder market players are creating more awareness about the gluten-free and sugar-free attributes of beef protein. The consumption of beef protein isolate leads to minor side effects as compared to other protein powders, and is becoming more popular amongst lactose-intolerant consumers. Thus, beef protein provides value for money for individuals due to its high protein and less carbohydrate & fat content.
Beef Protein Powder Market: Analysts’ Viewpoint
A comprehensive outlook of the beef protein powder market has been illustrated by the analysts of Transparency Market Research, who opine that, beef protein powder has high growth potential in food processing and dietary supplements, and supports improved research and development efforts for lab testing. A lot of bodybuilders and athletes opt for beef protein supplements, since it serves as a muscle-building protein. However, market players might come across tough competition with whey and casein protein powder due to their advantage regarding better immunity and taste. Stakeholders in the beef protein powder market can generate increased demand by creating awareness regarding the minor side effects it has on lactose-intolerant consumers, and how it helps reduce the intake of fat and cholesterol.
Growing Consumption of Dietary Supplements Propelling Beef Protein Powder Demand
Beef Protein Powder Market: Popularity of Organic and Natural Food Ingredients
Beef Protein Powder Market – Profitable Business Opportunity
Change in Perception of Beef Protein Powder
Beef Protein Powder Market: Growing Demand for Proteinaceous Products across the Globe
Beef Protein Powder: Market Players
Key players operating in the beef protein powder market, as profiled in the study, include
1. Global Beef Protein Powder Market - Executive Summary
1.1. Global Beef Protein Powder Market Country Analysis
1.2. Vertical Specific Market Penetration
1.3. Application – Product Mapping
1.4. Competition Blueprint
1.5. TMR Analysis and Recommendations
2. Market Overview
2.1. Market Introduction
2.2. Market Definition
2.3. Market Taxonomy
3. Market Dynamics
3.1. Macro-economic Factors
3.2. Drivers
3.2.1. Economic Drivers
3.2.2. Supply Side Drivers
3.2.3. Demand Side Drivers
3.3. Market Restraints
3.3.1. Regulatory concerns
3.3.2. Supply chain issues
3.4. Market Trends
3.5. Beef Protein Powder Market- Overview
3.5.1. Demand Analysis
3.5.2. Key dynamics
3.5.3. Value Chain Analysis
3.5.4. Consumer Preferences: Historical Scenario and Futuristic Approach
3.6. Trend Analysis- Impact on Time Line (2019-2029)
3.7. Forecast Factors – Relevance and Impact
4. Sentiment Analysis
4.1. Consumer Sentiment Analysis
4.1.1. Consumer Buying Pattern
4.1.2. Development of the Specification
4.1.3. Social & Economic Influencers – Factors
4.1.4. Consumer Preferences: Historical Scenario and Futuristic Approach
4.1.5. Prime Tendencies
4.1.6. Factors Affecting Consumer Preferences
4.1.7. Impact of Labelling, Claims, and Certifications
4.1.8. Others
4.2. Social Media Sentiment Analysis
4.2.1. Consumer perception for products on social media platforms Positive and Negative Mentions
4.2.2. Trending Brands
4.2.3. Social Media Platform Mentions (% of total mentions)
4.2.4. Trending Subject Titles
4.2.5. Others
5. Key Success Factors
6. Supply Chain Analysis
6.1. Profitability and Gross Margin Analysis By Competition
6.2. List of Active Participants- By Region
6.2.1. Raw Material Suppliers
6.2.2. Key Manufacturers
6.2.3. Integrators
6.2.4. Key Distributor/Retailers
7. Global Beef Protein Powder Market Pricing Analysis
7.1. Price Point Assessment by Nature
7.2. Regional Average Pricing Analysis
7.2.1. North America
7.2.2. Latin America
7.2.3. Europe
7.2.4. Japan
7.2.5. Asia Pacific Ex. Japan (APEJ)
7.2.6. Oceania
7.2.7. Middle East and Africa
7.3. Price Forecast till 2029
7.4. Factors Influencing Pricing
8. Global Beef Protein Powder Market Analysis and Forecast
8.1. Market Size Analysis (2014-2018) and Forecast (2019-2029)
8.1.1. Market Value (US$ Mn) and Volume (Tons) and Y-o-Y Growth
8.1.2. Absolute $ Opportunity
8.2. Global Beef Protein Powder Market Scenario Forecast (Optimistic, Likely and Conservative Market Conditions)
8.2.1. Forecast Factors and Relevance of Impact
8.2.2. Regional Beef Protein Powder Market Business Performance Summary
9. Beef Protein Powder Market Analysis and Forecast, By Nature
9.1. Introduction
9.1.1. Y-o-Y Growth Comparison by Nature
9.1.2. Basis Point Share (BPS) Analysis by Nature
9.2. Market Attractiveness Analysis By Nature
9.2.1. Organic
9.2.2. Conventional
10. Beef Protein Powder Market Analysis and Forecast, By End Use
10.1. Introduction
10.1.1. Y-o-Y Growth Comparison by End Use
10.1.2. Basis Point Share (BPS) Analysis by End Use
10.2. Market Size (US$ Mn), Volume (MT) and Forecast (2019-2029), By End Use
10.2.1. Food Processing
10.2.2. Beverage
10.2.3. Dietary Supplement
10.2.4. Nutraceutical
10.2.5. Lab Testing
10.3. Market Attractiveness Analysis by End Use
11. Global Beef Protein Powder Market Analysis and Forecast, By Region
11.1. Introduction
11.1.1. Basis Point Share (BPS) Analysis by Region
11.1.2. Y-o-Y Growth Projections by Region
11.2. Beef Protein Powder Market Size (US$ Mn) and Volume (MT) & Forecast (2019-2029) Analysis by Region
11.2.1. North America
11.2.2. Latin America
11.2.3. Europe
11.2.4. Japan
11.2.5. APEJ
11.2.6. Oceania
11.2.7. Middle East and Africa
11.3. Market Attractiveness Analysis by Region
12. North America Beef Protein Powder Market Analysis and Forecast
12.1. Introduction
12.1.1. Basis Point Share (BPS) Analysis by Country
12.1.2. Y-o-Y Growth Projections by Country
12.2. Beef Protein Powder Market Size (Value (US$) and Volume (MT) Analysis (2014-2018) and Forecast (2019-2029)
12.2.1. Market Attractiveness by Country
12.2.1.1. U.S.
12.2.1.2. Canada
12.2.2. By Nature
12.2.3. By End Use
12.3. Market Attractiveness Analysis
12.3.1. By Country
12.3.2. By Nature
12.3.3. By End Use
12.4. Drivers and Restraints: Impact Analysis
13. Latin America Beef Protein Powder Market Analysis and Forecast
13.1. Introduction
13.1.1. Basis Point Share (BPS) Analysis by Country
13.1.2. Y-o-Y Growth Projections by Country
13.1.3. Key Regulations
13.2. Beef Protein Powder Market Size (Value (US$) and Volume (MT) Analysis (2014-2018) and Forecast (2019-2029)
13.2.1. By Country
13.2.1.1. Brazil
13.2.1.2. Mexico
13.2.1.3. Rest of Latin America
13.2.2. By Nature
13.2.3. By End Use
13.3. Market Attractiveness Analysis
13.3.1. By Country
13.3.2. By Nature
13.3.3. By End Use
13.4. Drivers and Restraints: Impact Analysis
14. Europe Beef Protein Powder Market Analysis and Forecast
14.1. Introduction
14.1.1. Basis Point Share (BPS) Analysis by Country
14.1.2. Y-o-Y Growth Projections by Country
14.1.3. Key Regulations
14.2. Beef Protein Powder Market Size (Value (US$) and Volume (MT) Analysis (2014-2018) and Forecast (2019-2029)
14.2.1. By Country
14.2.1.1. UK
14.2.1.2. Germany
14.2.1.3. France
14.2.1.4. Spain
14.2.1.5. Italy
14.2.1.6. Benelux
14.2.1.7. Nordic
14.2.1.8. Rest of Europe
14.2.2. By Nature
14.2.3. By End Use
14.3. Market Attractiveness Analysis
14.3.1. By Country
14.3.2. By Form
14.3.3. By End Use
14.4. Drivers and Restraints: Impact Analysis
15. Japan Beef Protein Powder Market Analysis and Forecast
15.1. Introduction
15.1.1. Basis Point Share (BPS) Analysis by Country
15.1.2. Y-o-Y Growth Projections by Country
15.1.3. Key Regulations
15.2. Beef Protein Powder Market Size (Value (US$) and Volume (MT) Analysis (2014-2018) and Forecast (2019-2029)
15.2.1. By Nature
15.2.2. By End Use
15.3. Market Attractiveness Analysis
15.3.1. By Nature
15.3.2. By End Use
15.4. Drivers and Restraints: Impact Analysis
16. APEJ Beef Protein Powder Market Analysis and Forecast
16.1. Introduction
16.1.1. Basis Point Share (BPS) Analysis by Country
16.1.2. Y-o-Y Growth Projections by Country
16.1.3. Key Regulations
16.2. Beef Protein Powder Market Size (Value (US$) and Volume (MT) Analysis (2014-2018) and Forecast (2019-2029)
16.2.1. By Country
16.2.1.1. China
16.2.1.2. India
16.2.1.3. Indonesia
16.2.1.4. South Korea
16.2.1.5. Rest of APEJ
16.2.2. By Nature
16.2.3. By End Use
16.3. Market Attractiveness Analysis
16.3.1. By Country
16.3.2. By Nature
16.3.3. By End Use
16.4. Drivers and Restraints: Impact Analysis
17. Oceania Beef Protein Powder Market Analysis and Forecast
17.1. Introduction
17.1.1. Basis Point Share (BPS) Analysis by Country
17.1.2. Y-o-Y Growth Projections by Country
17.1.3. Key Regulations
17.2. Beef Protein Powder Market Size (Value (US$) and Volume (MT) Analysis (2014-2018) and Forecast (2019-2029)
17.2.1. By Country
17.2.1.1. Australia
17.2.1.2. New Zealand
17.3. Market Attractiveness Analysis
17.3.1. By Nature
17.3.2. By End Use
17.4. Drivers and Restraints: Impact Analysis
18. Middle East and Africa (MEA) Beef Protein Powder Market Analysis and Forecast
18.1. Introduction
18.1.1. Basis Point Share (BPS) Analysis by Country
18.1.2. Y-o-Y Growth Projections by Country
18.1.3. Key Regulations
18.2. Beef Protein Powder Market Size (Value (US$) and Volume (MT) Analysis (2014-2018) and Forecast (2019-2029)
18.2.1. By Country
18.2.1.1. Turkey
18.2.1.2. GCC
18.2.1.3. South Africa
18.2.1.4. Rest of MEA
18.2.2. By Nature
18.2.3. By End Use
18.3. Market Attractiveness Analysis
18.3.1. By Country
18.3.2. By Nature
18.3.3. By End Use
18.4. Drivers and Restraints: Impact Analysis
19. Competition Assessment
19.1. Global Beef Protein Powder Market Competition - a Dashboard View
19.2. Global Beef Protein Powder Market Structure Analysis
19.3. Global Beef Protein Powder Market Company Share Analysis
19.3.1. For Tier 1 Market Players, 2018
19.3.2. Company Market Share Analysis of Top 10 Players, By Region
19.4. Key Participants Market Presence (Intensity Mapping) by Region
20. Brand Assessment
20.1. Brand Identity (Brand as Product, Brand as Organization, Brand as Person, Brand as Symbol)
20.2. Audience and Positioning (Demographic Segmentation, Geographic Segmentation, Psychographic Segmentation, Situational Segmentation)
20.3. Brand Strategy
21. Competition Deep-dive (Manufacturers/Suppliers)
21.1. Griffith Foods Inc.
21.1.1. Overview
21.1.2. Product Portfolio
21.1.3. Sales Footprint
21.1.4. Channel Footprint
21.1.4.1. Distributors List
21.1.4.2. Type (Clients)
21.1.5. Strategy Overview
21.1.5.1. Marketing Strategy
21.1.5.2. Culture Strategy
21.1.5.3. Channel Strategy
21.1.6. SWOT Analysis
21.1.7. Financial Analysis
21.1.8. Revenue Share
21.1.8.1. By Meat Type
21.1.8.2. By Region
21.1.9. Key Clients
21.1.10. Analyst Comments
21.2. Carnad A/S
21.2.1. Overview
21.2.2. Product Portfolio
21.2.3. Sales Footprint
21.2.4. Channel Footprint
21.2.4.1. Distributors List
21.2.4.2. Type (Clients)
21.2.5. Strategy Overview
21.2.5.1. Marketing Strategy
21.2.5.2. Culture Strategy
21.2.5.3. Channel Strategy
21.2.6. SWOT Analysis
21.2.7. Financial Analysis
21.2.8. Revenue Share
21.2.8.1. By Meat Type
21.2.8.2. By Region
21.2.9. Key Clients
21.2.10. Analyst Comments
21.3. Colin Ingredients
21.3.1. Overview
21.3.2. Product Portfolio
21.3.3. Sales Footprint
21.3.4. Channel Footprint
21.3.4.1. Distributors List
21.3.4.2. Type (Clients)
21.3.5. Strategy Overview
21.3.5.1. Marketing Strategy
21.3.5.2. Culture Strategy
21.3.5.3. Channel Strategy
21.3.6. SWOT Analysis
21.3.7. Financial Analysis
21.3.8. Revenue Share
21.3.8.1. By Meat Type
21.3.8.2. By Region
21.3.9. Key Clients
21.3.10. Analyst Comments
21.4. JBS Global (UK) Ltd.
21.4.1. Overview
21.4.2. Product Portfolio
21.4.3. Sales Footprint
21.4.4. Channel Footprint
21.4.4.1. Distributors List
21.4.4.2. Type (Clients)
21.4.5. Strategy Overview
21.4.5.1. Marketing Strategy
21.4.5.2. Culture Strategy
21.4.5.3. Channel Strategy
21.4.6. SWOT Analysis
21.4.7. Financial Analysis
21.4.8. Revenue Share
21.4.8.1. By Meat Type
21.4.8.2. By Region
21.4.9. Key Clients
21.4.10. Analyst Comments
21.5. NH Foods Australia Pty Ltd.
21.5.1. Overview
21.5.2. Product Portfolio
21.5.3. Sales Footprint
21.5.4. Channel Footprint
21.5.4.1. Distributors List
21.5.4.2. Type (Clients)
21.5.5. Strategy Overview
21.5.5.1. Marketing Strategy
21.5.5.2. Culture Strategy
21.5.5.3. Channel Strategy
21.5.6. SWOT Analysis
21.5.7. Financial Analysis
21.5.8. Revenue Share
21.5.8.1. By Meat Type
21.5.8.2. By Region
21.5.9. Key Clients
21.5.10. Analyst Comments
21.6. Proliant Inc.
21.6.1. Overview
21.6.2. Product Portfolio
21.6.3. Sales Footprint
21.6.4. Channel Footprint
21.6.4.1. Distributors List
21.6.4.2. Type (Clients)
21.6.5. Strategy Overview
21.6.5.1. Marketing Strategy
21.6.5.2. Culture Strategy
21.6.5.3. Channel Strategy
21.6.6. SWOT Analysis
21.6.7. Financial Analysis
21.6.8. Revenue Share
21.6.8.1. By Meat Type
21.6.8.2. By Region
21.6.9. Key Clients
21.6.10. Analyst Comments
21.7. ARIAKE Japan Co., Ltd
21.7.1. Overview
21.7.2. Product Portfolio
21.7.3. Sales Footprint
21.7.4. Channel Footprint
21.7.4.1. Distributors List
21.7.4.2. Type (Clients)
21.7.5. Strategy Overview
21.7.5.1. Marketing Strategy
21.7.5.2. Culture Strategy
21.7.5.3. Channel Strategy
21.7.6. SWOT Analysis
21.7.7. Financial Analysis
21.7.8. Revenue Share
21.7.8.1. By Meat Type
21.7.8.2. By Region
21.7.9. Key Clients
21.7.10. Analyst Comments
21.8. Meioh Bussan Co., Ltd.
21.8.1. Overview
21.8.2. Product Portfolio
21.8.3. Sales Footprint
21.8.4. Channel Footprint
21.8.4.1. Distributors List
21.8.4.2. Type (Clients)
21.8.5. Strategy Overview
21.8.5.1. Marketing Strategy
21.8.5.2. Culture Strategy
21.8.5.3. Channel Strategy
21.8.6. SWOT Analysis
21.8.7. Financial Analysis
21.8.8. Revenue Share
21.8.8.1. By Meat Type
21.8.8.2. By Region
21.8.9. Key Clients
21.8.10. Analyst Comments
21.9. Nikken Foods Co., Ltd.
21.9.1. Overview
21.9.2. Product Portfolio
21.9.3. Sales Footprint
21.9.4. Channel Footprint
21.9.4.1. Distributors List
21.9.4.2. Type (Clients)
21.9.5. Strategy Overview
21.9.5.1. Marketing Strategy
21.9.5.2. Culture Strategy
21.9.5.3. Channel Strategy
21.9.6. SWOT Analysis
21.9.7. Financial Analysis
21.9.8. Revenue Share
21.9.8.1. By Meat Type
21.9.8.2. By Region
21.9.9. Key Clients
21.9.10. Analyst Comments
21.10. Thermo Fisher Scientific Inc.
21.10.1. Overview
21.10.2. Product Portfolio
21.10.3. Sales Footprint
21.10.4. Channel Footprint
21.10.4.1. Distributors List
21.10.4.2. Type (Clients)
21.10.5. Strategy Overview
21.10.5.1. Marketing Strategy
21.10.5.2. Culture Strategy
21.10.5.3. Channel Strategy
21.10.6. SWOT Analysis
21.10.7. Financial Analysis
21.10.8. Revenue Share
21.10.8.1. By Meat Type
21.10.8.2. By Region
21.10.9. Key Clients
21.10.10. Analyst Comments
21.11. HiMedia Laboratories
21.11.1. Overview
21.11.2. Product Portfolio
21.11.3. Sales Footprint
21.11.4. Channel Footprint
21.11.4.1. Distributors List
21.11.4.2. Type (Clients)
21.11.5. Strategy Overview
21.11.5.1. Marketing Strategy
21.11.5.2. Culture Strategy
21.11.5.3. Channel Strategy
21.11.6. SWOT Analysis
21.11.7. Financial Analysis
21.11.8. Revenue Share
21.11.8.1. By Meat Type
21.11.8.2. By Region
21.11.9. Key Clients
21.11.10. Analyst Comments
21.12. Ottogi Co., Ltd
21.12.1. Overview
21.12.2. Product Portfolio
21.12.3. Sales Footprint
21.12.4. Channel Footprint
21.12.4.1. Distributors List
21.12.4.2. Type (Clients)
21.12.5. Strategy Overview
21.12.5.1. Marketing Strategy
21.12.5.2. Culture Strategy
21.12.5.3. Channel Strategy
21.12.6. SWOT Analysis
21.12.7. Financial Analysis
21.12.8. Revenue Share
21.12.8.1. By Meat Type
21.12.8.2. By Region
21.12.9. Key Clients
21.12.10. Analyst Comments
21.13. Activ International, Inc. (Givaudan)
21.13.1. Overview
21.13.2. Product Portfolio
21.13.3. Sales Footprint
21.13.4. Channel Footprint
21.13.4.1. Distributors List
21.13.4.2. Type (Clients)
21.13.5. Strategy Overview
21.13.5.1. Marketing Strategy
21.13.5.2. Culture Strategy
21.13.5.3. Channel Strategy
21.13.6. SWOT Analysis
21.13.7. Financial Analysis
21.13.8. Revenue Share
21.13.8.1. By Meat Type
21.13.8.2. By Region
21.13.9. Key Clients
21.13.10. Analyst Comments
21.14. A S Harrison & Co Pty Limited
21.14.1. Overview
21.14.2. Product Portfolio
21.14.3. Sales Footprint
21.14.4. Channel Footprint
21.14.4.1. Distributors List
21.14.4.2. Type (Clients)
21.14.5. Strategy Overview
21.14.5.1. Marketing Strategy
21.14.5.2. Culture Strategy
21.14.5.3. Channel Strategy
21.14.6. SWOT Analysis
21.14.7. Financial Analysis
21.14.8. Revenue Share
21.14.8.1. By Meat Type
21.14.8.2. By Region
21.14.9. Key Clients
21.14.10. Analyst Comments
21.15. Henningsen Nederland bv
21.15.1. Overview
21.15.2. Product Portfolio
21.15.3. Sales Footprint
21.15.4. Channel Footprint
21.15.4.1. Distributors List
21.15.4.2. Type (Clients)
21.15.5. Strategy Overview
21.15.5.1. Marketing Strategy
21.15.5.2. Culture Strategy
21.15.5.3. Channel Strategy
21.15.6. SWOT Analysis
21.15.7. Financial Analysis
21.15.8. Revenue Share
21.15.8.1. By Meat Type
21.15.8.2. By Region
21.15.9. Key Clients
21.15.10. Analyst Comments
21.16. NUTRA WORKS
21.16.1. Overview
21.16.2. Product Portfolio
21.16.3. Sales Footprint
21.16.4. Channel Footprint
21.16.4.1. Distributors List
21.16.4.2. Type (Clients)
21.16.5. Strategy Overview
21.16.5.1. Marketing Strategy
21.16.5.2. Culture Strategy
21.16.5.3. Channel Strategy
21.16.6. SWOT Analysis
21.16.7. Financial Analysis
21.16.8. Revenue Share
21.16.8.1. By Meat Type
21.16.8.2. By Region
21.16.9. Key Clients
21.16.10. Analyst Comments
21.17. Others (On additional request)
21.17.1. Overview
21.17.2. Product Portfolio
21.17.3. Sales Footprint
21.17.4. Channel Footprint
21.17.4.1. Distributors List
21.17.4.2. Type (Clients)
21.17.5. Strategy Overview
21.17.5.1. Marketing Strategy
21.17.5.2. Culture Strategy
21.17.5.3. Channel Strategy
21.17.6. SWOT Analysis
21.17.7. Financial Analysis
21.17.8. Revenue Share
21.17.8.1. By Meat Type
21.17.8.2. By Region
21.17.9. Key Clients
21.17.10. Analyst Comments
22. Recommendation- Critical Success Factors
23. Research Methodology
24. Assumptions & Acronyms Used
List of Tables
Table 1: Global Beef Protein Powder Market Value (US$ Mn) Analysis and Forecast by Region, 2019-2029
Table 2: Global Beef Protein Powder Market Volume (MT) Analysis and Forecast by Region, 2019-2029
Table 3: Global Beef Protein Powder Market Value (US$ Mn) Analysis and Forecast by Nature, 2019-2029
Table 4: Global Beef Protein Powder Market Volume (MT) Analysis and Forecast by Nature, 2019-2029
Table 5: Global Beef Protein Powder Market Value (US$ Mn) Analysis and Forecast by End Use 2019-2029
Table 6: Global Beef Protein Powder Market Volume (MT) Analysis and Forecast by End Use, 2019-2029
Table 7: North America Beef Protein Powder Market Value (US$ Mn) Analysis and Forecast by Country, 2019-2029
Table 8: North America Beef Protein Powder Market Volume (MT) Analysis and Forecast by Country, 2019-2029
Table 9: U.S. Beef Protein Powder Market Value (US$ Mn) Analysis and Forecast, 2019-2029
Table 10: U.S. Beef Protein Powder Market Volume (MT) Analysis and Forecast, 2019-2029
Table 11: Canada Beef Protein Powder Market Value (US$ Mn) Analysis and Forecast, 2019-2029
Table 12: Canada Beef Protein Powder Market Volume (MT) Analysis and Forecast, 2019-2029
Table 13: North America Beef Protein Powder Market Value (US$) Analysis and Forecast by Nature, 2019-2029
Table 14: North America Beef Protein Powder Market Volume (MT) Analysis and Forecast by Nature, 2019-2029
Table 15: North America Beef Protein Powder Market Value (US$ Mn) Analysis and Forecast by End Use, 2019-2029
Table 16: North America Beef Protein Powder Market Volume (MT) Analysis and Forecast by End Use, 2019-2029
Table 17: Latin America Beef Protein Powder Market Value (US$ Mn) Analysis and Forecast by Country, 2019-2029
Table 18: Latin America Beef Protein Powder Market Volume (MT) Analysis and Forecast by Country, 2019-2029
Table 19: Brazil Beef Protein Powder Market Value (US$ Mn) Analysis and Forecast, 2019-2029
Table 20: Brazil Beef Protein Powder Market Volume (MT) Analysis and Forecast, 2019-2029
Table 21: Mexico Beef Protein Powder Market Value (US$ Mn) Analysis and Forecast, 2019-2029
Table 22: Mexico Beef Protein Powder Market Volume (MT) Analysis and Forecast by Country, 2019-2029
Table 23: Rest of the Latin America Beef Protein Powder Market Value (US$ Mn) Analysis and Forecast, 2019-2029
Table 24: Rest of the Latin America Beef Protein Powder Market Volume (MT) Analysis and Forecast, 2019-2029
Table 25: Latin America Beef Protein Powder Market Value (US$) Analysis and Forecast by Nature, 2019-2029
Table 26: Latin America Beef Protein Powder Market Volume (MT) Analysis and Forecast by Nature, 2019-2029
Table 27: Latin America Beef Protein Powder Market Value (US$ Mn) Analysis and Forecast by End Use, 2019-2029
Table 28: Latin America Beef Protein Powder Market Volume (MT) Analysis and Forecast by End Use, 2019-2029
Table 29: Europe Beef Protein Powder Market Value (US$ Mn) Analysis and Forecast by Country, 2019-2029
Table 30: Europe Beef Protein Powder Market Volume (MT) Analysis and Forecast by Country, 2019-2029
Table 31: U.K Beef Protein Powder Market Value (US$ Mn) Analysis and Forecast, 2019-2029
Table 32: U.K Beef Protein Powder Market Volume (MT) Analysis and Forecast, 2019-2029
Table 33: Germany Beef Protein Powder Market Value (US$ Mn) Analysis and Forecast, 2019-2029
Table 34: Germany Beef Protein Powder Market Volume (MT) Analysis and Forecast, 2019-2029
Table 35: France Beef Protein Powder Market Value (US$ Mn) Analysis and Forecast, 2019-2029
Table 36: France Beef Protein Powder Market Volume (MT) Analysis and Forecast, 2019-2029
Table 37: Spain Beef Protein Powder Market Value (US$ Mn) Analysis and Forecast, 2019-2029
Table 38: Spain Beef Protein Powder Market Volume (MT) Analysis and Forecast, 2019-2029
Table 39: Italy Beef Protein Powder Market Value (US$ Mn) Analysis and Forecast, 2019-2029
Table 40: Italy Beef Protein Powder Market Volume (MT) Analysis and Forecast, 2019-2029
Table 41: Benelux Beef Protein Powder Market Value (US$ Mn) Analysis and Forecast, 2019-2029
Table 42: Benelux Beef Protein Powder Market Volume (MT) Analysis and Forecast, 2019-2029
Table 43: Nordic Beef Protein Powder Market Value (US$ Mn) Analysis and Forecast, 2019-2029
Table 44: Nordic Beef Protein Powder Market Volume (MT) Analysis and Forecast, 2019-2029
Table 45: Rest of Europe Beef Protein Powder Market Value (US$ Mn) Analysis and Forecast, 2019-2029
Table 46: Rest of Europe Beef Protein Powder Market Volume (MT) Analysis and Forecast, 2019-2029
Table 47: Europe Beef Protein Powder Market Value (US$) Analysis and Forecast by Nature, 2019-2029
Table 48: Europe Beef Protein Powder Market Volume (MT) Analysis and Forecast by Nature, 2019-2029
Table 49: Europe Beef Protein Powder Market Value (US$ Mn) Analysis and Forecast by End Use, 2019-2029
Table 50: Europe Beef Protein Powder Market Volume (MT) Analysis and Forecast by End Use, 2019-2029
Table 51: Japan Beef Protein Powder Market Value (US$ Mn) Analysis and Forecast, 2019-2029
Table 52: Japan Beef Protein Powder Market Volume (MT) Analysis and Forecast, 2019-2029
Table 53: Japan Beef Protein Powder Market Value (US$) Analysis and Forecast by Nature, 2019-2029
Table 54: Japan Beef Protein Powder Market Volume (MT) Analysis and Forecast by Nature, 2019-2029
Table 55: Japan Beef Protein Powder Market Value (US$ Mn) Analysis and Forecast by End Use, 2019-2029
Table 56: Japan Beef Protein Powder Market Volume (MT) Analysis and Forecast by End Use, 2019-2029
Table 57: APEJ Beef Protein Powder Market Value (US$ Mn) Analysis and Forecast by Country, 2019-2029
Table 58: APEJ Beef Protein Powder Market Volume (MT) Analysis and Forecast by Country, 2019-2029
Table 59: China Beef Protein Powder Market Value (US$ Mn) Analysis and Forecast, 2019-2029
Table 60: China Beef Protein Powder Market Volume (MT) Analysis and Forecast, 2019-2029
Table 61: India Beef Protein Powder Market Value (US$ Mn) Analysis and Forecast, 2019-2029
Table 62: India Beef Protein Powder Market Volume (MT) Analysis and Forecast, 2019-2029
Table 63: Indonesia Beef Protein Powder Market Value (US$ Mn) Analysis and Forecast, 2019-2029
Table 64: Indonesia Beef Protein Powder Market Volume (MT) Analysis and Forecast, 2019-2029
Table 65: South Korea Beef Protein Powder Market Value (US$ Mn) Analysis and Forecast, 2019-2029
Table 66: South Korea Beef Protein Powder Market Volume (MT) Analysis and Forecast, 2019-2029
Table 67: Rest of APEJ Beef Protein Powder Market Value (US$ Mn) Analysis and Forecast, 2019-2029
Table 68: Rest of APEJ Beef Protein Powder Market Volume (MT) Analysis and Forecast, 2019-2029
Table 69: APEJ Beef Protein Powder Market Value (US$) Analysis and Forecast by Nature, 2019-2029
Table 70: APEJ Beef Protein Powder Market Volume (MT) Analysis and Forecast by Nature, 2019-2029
Table 71: APEJ Beef Protein Powder Market Value (US$ Mn) Analysis and Forecast by End Use, 2019-2029
Table 72: APEJ Beef Protein Powder Market Volume (MT) Analysis and Forecast by End Use, 2019-2029
Table 73: Oceania Beef Protein Powder Market Value (US$ Mn) Analysis and Forecast by Country, 2019-2029
Table 74: Oceania Beef Protein Powder Market Volume (MT) Analysis and Forecast by Country, 2019-2029
Table 75: Australia Beef Protein Powder Market Value (US$ Mn) Analysis and Forecast, 2019-2029
Table 76: Australia Beef Protein Powder Market Volume (MT) Analysis and Forecast, 2019-2029
Table 77: New Zealand Beef Protein Powder Market Value (US$ Mn) Analysis and Forecast, 2019-2029
Table 78: New Zealand Beef Protein Powder Market Volume (MT) Analysis and Forecast, 2019-2029
Table 79: Oceania Beef Protein Powder Market Value (US$) Analysis and Forecast by Nature, 2019-2029
Table 80: Oceania Beef Protein Powder Market Volume (MT) Analysis and Forecast by Nature, 2019-2029
Table 81: Oceania Beef Protein Powder Market Value (US$ Mn) Analysis and Forecast by End Use, 2019-2029
Table 82: Oceania Beef Protein Powder Market Volume (MT) Analysis and Forecast by End Use, 2019-2029
Table 83: MEA Beef Protein Powder Market Value (US$ Mn) Analysis and Forecast by Country, 2019-2029
Table 84: MEA Beef Protein Powder Market Volume (MT) Analysis and Forecast by Country, 2019-2029
Table 85: Turkey Beef Protein Powder Market Value (US$ Mn) Analysis and Forecast, 2019-2029
Table 86: Turkey Beef Protein Powder Market Volume (MT) Analysis and Forecast, 2019-2029
Table 87: GCC Beef Protein Powder Market Value (US$ Mn) Analysis and Forecast, 2019-2029
Table 88: GCC Beef Protein Powder Market Volume (MT) Analysis and Forecast, 2019-2029
Table 89: South Africa Beef Protein Powder Market Value (US$ Mn) Analysis and Forecast, 2019-2029
Table 90: South Africa Beef Protein Powder Market Volume (MT) Analysis and Forecast, 2019-2029
Table 91: Rest of the MEA Beef Protein Powder Market Value (US$ Mn) Analysis and Forecast, 2019-2029
Table 92: Rest of the MEA Beef Protein Powder Market Volume (MT) Analysis and Forecast, 2019-2029
Table 93: MEA Beef Protein Powder Market Value (US$) Analysis and Forecast by Nature, 2019-2029
Table 94: MEA Beef Protein Powder Market Volume (MT) Analysis and Forecast by Nature, 2019-2029
Table 95: MEA Beef Protein Powder Market Value (US$ Mn) Analysis and Forecast by End Use, 2019-2029
Table 96: MEA Beef Protein Powder Market Volume (MT) Analysis and Forecast by End Use, 2019-2029
List of Figures
Figure 1: Global Beef Protein Powder Market Value (US$ Mn) and Volume (MT) Forecast, 2019–2029
Figure 2: Global Beef Protein Powder Market Absolute $ Opportunity (US$ Mn), 2019–2029
Figure 3: Global Beef Protein Powder Market Value (US$ Mn) Scenario Forecast, 2019 & 2029
Figure 4: Global Beef Protein Powder Market Value Share (%) and BPS Analysis by Nature, 2014, 2019 & 2029
Figure 5: Global Beef Protein Powder Market Attractiveness, by Nature, 2019 to 2029
Figure 6: Global Beef Protein Powder Market Incremental Value (US$ Mn), by Nature, 2019 to 2029
Figure 7: Global Beef Protein Powder Market Y-o-Y Growth, by Nature, 2019 to 2029
Figure 8: Global Beef Protein Powder Market Value Share (%) and BPS Analysis by End Use, 2014, 2019 & 2029
Figure 9: Global Beef Protein Powder Market Attractiveness, by End Use, 2019 to 2029
Figure 10: Global Beef Protein Powder Market Incremental Value (US$ Mn), by End Use, 2019 to 2029
Figure 11: Global Beef Protein Powder Market Y-o-Y Growth, by End Use, 2019 to 2029
Figure 12: Global Beef Protein Powder Market Value Share (%) and BPS Analysis by Region, 2014, 2019 & 2029
Figure 13: Global Beef Protein Powder Market Y-o-Y Growth (%) Projections by Region, 2019-2029
Figure 14: North America Beef Protein Powder Market Absolute $ Opportunity Analysis, 2019-2029
Figure 15: Latin America Beef Protein Powder Absolute $ Opportunity Analysis, 2019-2029
Figure 16: Europe Beef Protein Powder Market Absolute $ Opportunity Analysis, 2019-2029
Figure 17: Japan Beef Protein Powder Market Absolute $ Opportunity Analysis, 2019-2029
Figure 18: APEJ Beef Protein Powder Market Absolute $ Opportunity Analysis, 2019-2029
Figure 19: Oceania Beef Protein Powder Market Absolute $ Opportunity Analysis, 2019-2029
Figure 20: MEA Beef Protein Powder Market Absolute $ Opportunity Analysis, 2019-2029
Figure 21: Global Beef Protein Powder Market Attractiveness Analysis, by Region 2019-2029
Figure 22: North America Beef Protein Powder Market Value Share (%) and BPS Analysis by Nature, 2014, 2019 & 2029
Figure 23: North America Beef Protein Powder Market Attractiveness, by Nature, 2019 to 2029
Figure 24: North America Beef Protein Powder Market Incremental Value (US$ Mn), by Nature, 2019 to 2029
Figure 25: North America Beef Protein Powder Market Y-o-Y Growth, by Nature, 2019 to 2029
Figure 26: North America Beef Protein Powder Market Value Share (%) and BPS Analysis by End Use, 2014, 2019 & 2029
Figure 27: North America Beef Protein Powder Market Attractiveness, by End Use, 2019 to 2029
Figure 28: North America Beef Protein Powder Market Incremental Value (US$ Mn), by End Use, 2019 to 2029
Figure 29: North America Beef Protein Powder Market Y-o-Y Growth, by End Use, 2019 to 2029
Figure 30: North America Beef Protein Powder Market Value Share (%) and BPS Analysis by Country, 2014, 2019 & 2029
Figure 31: North America Beef Protein Powder Market Attractiveness, by Country, 2019 to 2029
Figure 32: North America Beef Protein Powder Market Value (US$) and Volume (MT) Analysis and Forecast by Country
Figure 33: Latin America Beef Protein Powder Market Value Share (%) and BPS Analysis by Nature, 2014, 2019 & 2029
Figure 34: Latin America Beef Protein Powder Market Attractiveness, by Nature, 2019 to 2029
Figure 35: Latin America Beef Protein Powder Market Incremental Value (US$ Mn), by Nature, 2019 to 2029
Figure 36: Latin America Beef Protein Powder Market Y-o-Y Growth, by Nature, 2019 to 2029
Figure 37: Latin America Beef Protein Powder Market Value Share (%) and BPS Analysis by End Use, 2014, 2019 & 2029
Figure 38: Latin America Beef Protein Powder Market Attractiveness, by End Use, 2019 to 2029
Figure 39: Latin America Beef Protein Powder Market Incremental Value (US$ Mn), by End Use, 2019 to 2029
Figure 40: Latin America Beef Protein Powder Market Y-o-Y Growth, by End Use, 2019 to 2029
Figure 41: Latin America Beef Protein Powder Market Value BPS Analysis, by Country, 2019 & 2029
Figure 42: Latin America Beef Protein Powder Market Attractiveness, by Country, 2019 to 2029
Figure 43: Latin America Beef Protein Powder Value/Volume Analysis, by Country, 2019 & 2029
Figure 44: Europe Beef Protein Powder Market Value Share (%) and BPS Analysis by Nature, 2014, 2019 & 2029
Figure 45: Europe Beef Protein Powder Market Attractiveness, by Nature, 2019 to 2029
Figure 46: Europe Beef Protein Powder Market Incremental Value (US$ Mn), by Nature, 2019 to 2029
Figure 47: Europe Beef Protein Powder Market Y-o-Y Growth, by Nature, 2019 to 2029
Figure 48: Europe Beef Protein Powder Market Value Share (%) and BPS Analysis by End Use, 2014, 2019 & 2029
Figure 49: Europe Beef Protein Powder Market Attractiveness, by End Use, 2019 to 2029
Figure 50: Europe Beef Protein Powder Market Incremental Value (US$ Mn), by End Use, 2019 to 2029
Figure 51: Europe Beef Protein Powder Market Y-o-Y Growth, by End Use, 2019 to 2029
Figure 52: Europe Beef Protein Powder Market Value BPS Analysis, by Country, 2019 & 2029
Figure 53: Europe Beef Protein Powder Market Attractiveness, by Country, 2019 to 2029
Figure 54: Europe Beef Protein Powder Value/Volume Analysis, by Country, 2019 & 2029
Figure 55: Japan Beef Protein Powder Market Value Share (%) and BPS Analysis by Nature, 2014, 2019 & 2029
Figure 56: Japan Beef Protein Powder Market Attractiveness, by Nature, 2019 to 2029
Figure 57: Japan Beef Protein Powder Market Incremental Value (US$ Mn), by Nature, 2019 to 2029
Figure 58: Japan Beef Protein Powder Market Y-o-Y Growth, by Nature, 2019 to 2029
Figure 59: Japan Beef Protein Powder Market Value Share (%) and BPS Analysis by End Use, 2014, 2019 & 2029
Figure 60: Japan Beef Protein Powder Market Attractiveness, by End Use, 2019 to 2029
Figure 61: Japan Beef Protein Powder Market Incremental Value (US$ Mn), by End Use, 2019 to 2029
Figure 62: Japan Beef Protein Powder Market Y-o-Y Growth, by End Use, 2019 to 2029
Figure 63: Japan Beef Protein Powder Market Value BPS Analysis, by Country, 2019 & 2029
Figure 64: Japan Beef Protein Powder Market Attractiveness, by Country, 2019 to 2029
Figure 65: Japan Beef Protein Powder Value/Volume Analysis, by Country, 2019 & 2029
Figure 66: APEJ Beef Protein Powder Market Value Share (%) and BPS Analysis by Nature, 2014, 2019 & 2029
Figure 67: APEJ Beef Protein Powder Market Attractiveness, by Nature, 2019 to 2029
Figure 68: APEJ Beef Protein Powder Market Incremental Value (US$ Mn), by Nature, 2019 to 2029
Figure 69: APEJ Beef Protein Powder Market Y-o-Y Growth, by Nature, 2019 to 2029
Figure 70: APEJ Beef Protein Powder Market Value Share (%) and BPS Analysis by End Use, 2014, 2019 & 2029
Figure 71: APEJ Beef Protein Powder Market Attractiveness, by End Use, 2019 to 2029
Figure 72: APEJ Beef Protein Powder Market Incremental Value (US$ Mn), by End Use, 2019 to 2029
Figure 73: APEJ Beef Protein Powder Market Y-o-Y Growth, by End Use, 2019 to 2029
Figure 74: APEJ Beef Protein Powder Market Value Share (%) and BPS Analysis by Country, 2014, 2019 & 2029
Figure 75: APEJ Beef Protein Powder Market Attractiveness, by Country, 2019 to 2029
Figure 76: APEJ Beef Protein Powder Market Value (US$) and Volume (MT) Analysis and Forecast by Country
Figure 77: Oceania Beef Protein Powder Market Value Share (%) and BPS Analysis by Nature, 2014, 2019 & 2029
Figure 78: Oceania Beef Protein Powder Market Attractiveness, by Nature, 2019 to 2029
Figure 79: Oceania Beef Protein Powder Market Incremental Value (US$ Mn), by Nature, 2019 to 2029
Figure 80: Oceania Beef Protein Powder Market Y-o-Y Growth, by Nature, 2019 to 2029
Figure 81: Oceania Beef Protein Powder Market Value Share (%) and BPS Analysis by End Use, 2014, 2019 & 2029
Figure 82: Oceania Beef Protein Powder Market Attractiveness, by End Use, 2019 to 2029
Figure 83: Oceania Beef Protein Powder Market Incremental Value (US$ Mn), by End Use, 2019 to 2029
Figure 84: Oceania Beef Protein Powder Market Y-o-Y Growth, by End Use, 2019 to 2029
Figure 85: Oceania Beef Protein Powder Market Value Share (%) and BPS Analysis by Country, 2014, 2019 & 2029
Figure 86: Oceania Beef Protein Powder Market Attractiveness, by Country, 2019 to 2029
Figure 87: Oceania Beef Protein Powder Market Value Share (%) and BPS Analysis by Country, 2014, 2019 & 2029
Figure 88: MEA Beef Protein Powder Market Value Share (%) and BPS Analysis by Nature, 2014, 2019 & 2029
Figure 89: MEA Beef Protein Powder Market Attractiveness, by Nature, 2019 to 2029
Figure 90: MEA Beef Protein Powder Market Incremental Value (US$ Mn), by Nature, 2019 to 2029
Figure 91: MEA Beef Protein Powder Market Y-o-Y Growth, by Nature, 2019 to 2029
Figure 92: MEA Beef Protein Powder Market Value Share (%) and BPS Analysis by End Use, 2014, 2019 & 2029
Figure 93: MEA Beef Protein Powder Market Attractiveness, by End Use, 2019 to 2029
Figure 94: MEA Beef Protein Powder Market Incremental Value (US$ Mn), by End Use, 2019 to 2029
Figure 95: MEA Beef Protein Powder Market Y-o-Y Growth, by End Use, 2019 to 2029
Figure 96: MEA Beef Protein Powder Market Value Share (%) and BPS Analysis by Country, 2014, 2019 & 2029
Figure 97: MEA Beef Protein Powder Market Attractiveness, by Country, 2019 to 2029
Figure 98: MEA Beef Protein Powder Market Value Share (%) and BPS Analysis by Country, 2014, 2019 & 2029
Copyright © Transparency Market Research, Inc. All Rights reserved
Trust Online

Beef Protein Powder Market