
Reports
Reports
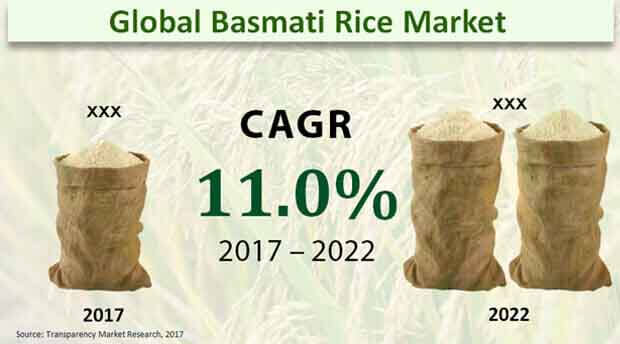
Global Basmati Rice Market: Snapshot
Basmati rice has been enjoying a premium position in the global marketplace, which has reflected greatly on the growth of the market for basmati rice across the world. The high demand for basmati rice in Asian countries, with it being the staple food of most of the people, residing in this continent, has been supporting the global basmati rice significantly. With inventory prices going down steadily, this market is likely to keep a high pace of growth over the next few years.
The worldwide market for basmati rice is anticipated to present an opportunity worth US$10.51 bn by 2017. The market is further expected to rise to US$17.74 bn by 2022, proliferating at a robust CAGR of 11.0% during the period from 2017 to 2022. The export demand for basmati rice is projected to improve further in the near future, adding considerably to the market’s growth.
Raw Basmati Rice to Remain Most Preferred
Primarily, three types of basmati rice is available across the global market: Raw, parboiled, and steamed. Among these, the demand for raw basmati is much greater than parboiled and steamed basmati rice around the world, thanks to its superior quality, fragrance, and taste. With a CAGR of 12.90% between 2017 and 2022, the raw basmati rice segment is anticipated to remain on the top over the next few years. Based on the species, basmati rice is available in two categories: white and brown. White basmati rice is more preferred among the masses. However, due to the rising awareness about its health benefits, brown basmati rice is anticipated to witness a high growth rate in the years to come.
In terms of application, the global basmati rice market is classified into the food and the cosmetic and personal care sectors. The food industry is reporting a higher demand for basmati rice in comparison with the cosmetic and personal care industry and this trend is expected to continue in the near future. By the sales channel, the market is categorized into HORECA, modern trade, online store, convenience store, and traditional grocery stores. Traditional grocery stores are still the main sales channel for basmati rice, with convenience stores closely following. Modern trade and online stores are attempting aggressively to keep up with the market.
APEJ to Dominate Global Basmati Rice Market
The worldwide basmati rice market is also classified on the basis of the geography. Asia Pacific excluding Japan (APEJ), North America, Europe, the Middle East and Africa (MEA), Japan, and Latin America have surfaced as the main regional segments of this market. Thanks to the high yield of paddy crop, APEJ has acquired the leading position in the global market. Researchers expect the APEJ market for basmati rise to occupy a share of more than 46% in the overall market by 2017.
Further, this regional market is anticipated to retain its dominance over the forthcoming years due to the increasing prices of paddy. Apart from APEJ, MEA, Europe, and Japan are also expected to experience steady growth in the years to come.
McCormick & Co. Inc., LT Foods Ltd., The Hain Celestial Group Inc., Estraco Kft., East End Foods, The Rice 'n Spice Int. Ltd., KRBL Ltd., Amira Nature Foods Ltd., Mars Inc., and REI Agro Ltd. are some the key vendors of basmati rice across the world.
Aromatic Rice Varieties in Basmati Rice Market Attract Consumers
Basmati rice is long-grain rice characterized by distinct aroma, flavour, and gastronomical delight. The drive for the basmati rice stems from these characteristics. As many as 29 varieties of Basmati rice have been observed, and they are grown in only specific geographies with a distinct agro-climatic conditions. An example is Indian subcontinent. Another key producing region is Pakistan. In fact, the country has become the major exporter of the Basmati Rice. Continuously growing exports of these to several countries including Iran, Saudi Arab, UAE, Kuwait, and Iraq has boosted the valuation of the basmati rice. The growing penetration of e-commerce and online retail chains has spurred the sales in the basmati rice market. A variety of rice items can be made with Basmati rice, the reason having to do with the growing popularity of the varieties to make ordinary dish extraordinary. The demand for long-grain rice has been growing in recent years. Brands are going for environmentally friendly packaging to attract buyers. Companies are also focusing on giving a distinct texture to make their products unique from others, and gain a better foothold in the basmati rice market. Advancements being made in harvesting and processing methods will allow companies to this end, expanding the avenue in the market.
The COVID-19 pandemic has caused sea changes in the consumption and demand patterns of several businesses across industries. The pandemic witnessed food industries rapidly looking for new production strategies and consumer propositions owing to the wide-ranging supply and production bottlenecks that arose due to restrictions on economic activities. Further, retail chain companies also suffered from the lack of variety of products in their shelves, considerably changing the dynamics of the basmati rice market. In 2020, due to restrictions on movement of people, many had to modify their consumer targeting approaches to keep consumers hooked to buying online.
1. Global Basmati Rice Market - Executive Summary
2. Global Basmati Rice Market Overview
2.1. Introduction
2.1.1. Global Basmati Rice Market Taxonomy
2.1.2. Global Basmati Rice Market Definition
2.2. Global Basmati Rice Market Size (US$ Mn) and Forecast, 2012-2022
2.2.1. Global Basmati Rice Market Y-o-Y Growth
2.3. Global Basmati Rice Market Dynamics
2.4. Supply Chain
2.5. Cost Structure
2.6. Pricing Analysis
2.7. Raw Material Sourcing Strategy and Analysis
2.8. List of Distributors
2.9. Key Participants Market Presence (Intensity Map) By Region
3. Global Basmati Rice Market Analysis and Forecast By Type
3.1. Global Basmati Rice Market Size and Forecast By Type, 2012-2022
3.1.1. Raw Market Size and Forecast, 2012-2022
3.1.1.1. Revenue (US$ Mn) Comparison, By Region
3.1.1.2. Market Share Comparison, By Region
3.1.1.3. Y-o-Y growth Comparison, By Region
3.1.2. Steamed Market Size and Forecast, 2012-2022
3.1.2.1. Revenue (US$ Mn) Comparison, By Region
3.1.2.2. Market Share Comparison, By Region
3.1.2.3. Y-o-Y growth Comparison, By Region
3.1.3. Parboiled Market Size and Forecast, 2012-2022
3.1.3.1. Revenue (US$ Mn) Comparison, By Region
3.1.3.2. Market Share Comparison, By Region
3.1.3.3. Y-o-Y growth Comparison, By Region
4. Global Basmati Rice Market Analysis and Forecast By Species
4.1. Global Basmati Rice Market Size and Forecast By Species, 2012-2022
4.1.1. White Market Size and Forecast, 2012-2022
4.1.1.1. Revenue (US$ Mn) Comparison, By Region
4.1.1.2. Market Share Comparison, By Region
4.1.1.3. Y-o-Y growth Comparison, By Region
4.1.2. Brown Market Size and Forecast, 2012-2022
4.1.2.1. Revenue (US$ Mn) Comparison, By Region
4.1.2.2. Market Share Comparison, By Region
4.1.2.3. Y-o-Y growth Comparison, By Region
4.1.3. Other Species Market Size and Forecast, 2012-2022
4.1.3.1. Revenue (US$ Mn) Comparison, By Region
4.1.3.2. Market Share Comparison, By Region
4.1.3.3. Y-o-Y growth Comparison, By Region
5. Global Basmati Rice Market Analysis and Forecast By Application
5.1. Global Basmati Rice Market Size and Forecast By Application, 2012-2022
5.1.1. Food Market Size and Forecast, 2012-2022
5.1.1.1. Revenue (US$ Mn) Comparison, By Region
5.1.1.2. Market Share Comparison, By Region
5.1.1.3. Y-o-Y growth Comparison, By Region
5.1.2. Cosmetic and Personal Care Market Size and Forecast, 2012-2022
5.1.2.1. Revenue (US$ Mn) Comparison, By Region
5.1.2.2. Market Share Comparison, By Region
5.1.2.3. Y-o-Y growth Comparison, By Region
5.1.3. Other Application Market Size and Forecast, 2012-2022
5.1.3.1. Revenue (US$ Mn) Comparison, By Region
5.1.3.2. Market Share Comparison, By Region
5.1.3.3. Y-o-Y growth Comparison, By Region
6. Global Basmati Rice Market Analysis and Forecast By Sales Channel
6.1. Global Basmati Rice Market Size and Forecast By Sales Channel, 2012-2022
6.1.1. HORECA Market Size and Forecast, 2012-2022
6.1.1.1. Revenue (US$ Mn) Comparison, By Region
6.1.1.2. Market Share Comparison, By Region
6.1.1.3. Y-o-Y growth Comparison, By Region
6.1.2. Modern Trade Market Size and Forecast, 2012-2022
6.1.2.1. Revenue (US$ Mn) Comparison, By Region
6.1.2.2. Market Share Comparison, By Region
6.1.2.3. Y-o-Y growth Comparison, By Region
6.1.3. Convenience Store Market Size and Forecast, 2012-2022
6.1.3.1. Revenue (US$ Mn) Comparison, By Region
6.1.3.2. Market Share Comparison, By Region
6.1.3.3. Y-o-Y growth Comparison, By Region
6.1.4. Online Store Market Size and Forecast, 2012-2022
6.1.4.1. Revenue (US$ Mn) Comparison, By Region
6.1.4.2. Market Share Comparison, By Region
6.1.4.3. Y-o-Y growth Comparison, By Region
6.1.5. Traditional Grocery Stores Market Size and Forecast, 2012-2022
6.1.5.1. Revenue (US$ Mn) Comparison, By Region
6.1.5.2. Market Share Comparison, By Region
6.1.5.3. Y-o-Y growth Comparison, By Region
6.1.6. Other Sales Channel Market Size and Forecast, 2012-2022
6.1.6.1. Revenue (US$ Mn) Comparison, By Region
6.1.6.2. Market Share Comparison, By Region
6.1.6.3. Y-o-Y growth Comparison, By Region
7. Global Basmati Rice Market Analysis and Forecast By Region
7.1. Global Basmati Rice Market Size and Forecast, 2012-2022
7.1.1. North America Basmati Rice Market Size and Forecast, 2012-2022
7.1.1.1. Revenue (US$ Mn) Comparison, By Type
7.1.1.2. Revenue (US$ Mn) Comparison, By Species
7.1.1.3. Revenue (US$ Mn) Comparison, By Application
7.1.1.4. Revenue (US$ Mn) Comparison, By Sales Channel
7.1.2. Latin America Basmati Rice Market Size and Forecast, 2012-2022
7.1.2.1. Revenue (US$ Mn) Comparison, By Type
7.1.2.2. Revenue (US$ Mn) Comparison, By Species
7.1.2.3. Revenue (US$ Mn) Comparison, By Application
7.1.2.4. Revenue (US$ Mn) Comparison, By Sales Channel
7.1.3. Europe Basmati Rice Market Size and Forecast, 2012-2022
7.1.3.1. Revenue (US$ Mn) Comparison, By Type
7.1.3.2. Revenue (US$ Mn) Comparison, By Species
7.1.3.3. Revenue (US$ Mn) Comparison, By Application
7.1.3.4. Revenue (US$ Mn) Comparison, By Sales Channel
7.1.4. Japan Basmati Rice Market Size and Forecast, 2012-2022
7.1.4.1. Revenue (US$ Mn) Comparison, By Type
7.1.4.2. Revenue (US$ Mn) Comparison, By Species
7.1.4.3. Revenue (US$ Mn) Comparison, By Application
7.1.4.4. Revenue (US$ Mn) Comparison, By Sales Channel
7.1.5. APEJ Basmati Rice Market Size and Forecast, 2012-2022
7.1.5.1. Revenue (US$ Mn) Comparison, By Type
7.1.5.2. Revenue (US$ Mn) Comparison, By Species
7.1.5.3. Revenue (US$ Mn) Comparison, By Application
7.1.5.4. Revenue (US$ Mn) Comparison, By Sales Channel
7.1.6. MEA Basmati Rice Market Size and Forecast, 2012-2022
7.1.6.1. Revenue (US$ Mn) Comparison, By Type
7.1.6.2. Revenue (US$ Mn) Comparison, By Species
7.1.6.3. Revenue (US$ Mn) Comparison, By Application
7.1.6.4. Revenue (US$ Mn) Comparison, By Sales Channel
8. North America Basmati Rice Market Analysis and Forecast, By Country, 2012-2022
8.1. US Basmati Rice Market Size and Forecast, 2012-2022
8.1.1. Revenue (US$ Mn) Comparison, By Type
8.1.2. Revenue (US$ Mn) Comparison, By Species
8.1.3. Revenue (US$ Mn) Comparison, By Application
8.1.4. Revenue (US$ Mn) Comparison, By Sales Channel
8.2. Canada Basmati Rice Market Size and Forecast, 2012-2022
8.2.1. Revenue (US$ Mn) Comparison, By Type
8.2.2. Revenue (US$ Mn) Comparison, By Species
8.2.3. Revenue (US$ Mn) Comparison, By Application
8.2.4. Revenue (US$ Mn) Comparison, By Sales Channel
9. Latin America Basmati Rice Market Analysis and Forecast, By Country, 2012-2022
9.1. Brazil Basmati Rice Market Size and Forecast, 2012-2022
9.1.1. Revenue (US$ Mn) Comparison, By Type
9.1.2. Revenue (US$ Mn) Comparison, By Species
9.1.3. Revenue (US$ Mn) Comparison, By Application
9.1.4. Revenue (US$ Mn) Comparison, By Sales Channel
9.2. Mexico Basmati Rice Market Size and Forecast, 2012-2022
9.2.1. Revenue (US$ Mn) Comparison, By Type
9.2.2. Revenue (US$ Mn) Comparison, By Species
9.2.3. Revenue (US$ Mn) Comparison, By Application
9.2.4. Revenue (US$ Mn) Comparison, By Sales Channel
9.3. Argentina Basmati Rice Market Size and Forecast, 2012-2022
9.3.1. Revenue (US$ Mn) Comparison, By Type
9.3.2. Revenue (US$ Mn) Comparison, By Species
9.3.3. Revenue (US$ Mn) Comparison, By Application
9.3.4. Revenue (US$ Mn) Comparison, By Sales Channel
10. Europe Basmati Rice Market Analysis and Forecast, By Country, 2012-2022
10.1. Germany Basmati Rice Market Size and Forecast, 2012-2022
10.1.1. Revenue (US$ Mn) Comparison, By Type
10.1.2. Revenue (US$ Mn) Comparison, By Species
10.1.3. Revenue (US$ Mn) Comparison, By Application
10.1.4. Revenue (US$ Mn) Comparison, By Sales Channel
10.2. UK Basmati Rice Market Size and Forecast, 2012-2022
10.2.1. Revenue (US$ Mn) Comparison, By Type
10.2.2. Revenue (US$ Mn) Comparison, By Species
10.2.3. Revenue (US$ Mn) Comparison, By Application
10.2.4. Revenue (US$ Mn) Comparison, By Sales Channel
10.3. France Basmati Rice Market Size and Forecast, 2012-2022
10.3.1. Revenue (US$ Mn) Comparison, By Type
10.3.2. Revenue (US$ Mn) Comparison, By Species
10.3.3. Revenue (US$ Mn) Comparison, By Application
10.3.4. Revenue (US$ Mn) Comparison, By Sales Channel
10.4. Spain Basmati Rice Market Size and Forecast, 2012-2022
10.4.1. Revenue (US$ Mn) Comparison, By Type
10.4.2. Revenue (US$ Mn) Comparison, By Species
10.4.3. Revenue (US$ Mn) Comparison, By Application
10.4.4. Revenue (US$ Mn) Comparison, By Sales Channel
10.5. Italy Basmati Rice Market Size and Forecast, 2012-2022
10.5.1. Revenue (US$ Mn) Comparison, By Type
10.5.2. Revenue (US$ Mn) Comparison, By Species
10.5.3. Revenue (US$ Mn) Comparison, By Application
10.5.4. Revenue (US$ Mn) Comparison, By Sales Channel
10.6. Nordic Basmati Rice Market Size and Forecast, 2012-2022
10.6.1. Revenue (US$ Mn) Comparison, By Type
10.6.2. Revenue (US$ Mn) Comparison, By Species
10.6.3. Revenue (US$ Mn) Comparison, By Application
10.6.4. Revenue (US$ Mn) Comparison, By Sales Channel
11. Japan Basmati Rice Market Analysis and Forecast, By Country, 2012-2022
11.1. Japan Basmati Rice Market Size and Forecast, 2012-2022
11.1.1. Revenue (US$ Mn) Comparison, By Type
11.1.2. Revenue (US$ Mn) Comparison, By Species
11.1.3. Revenue (US$ Mn) Comparison, By Application
11.1.4. Revenue (US$ Mn) Comparison, By Sales Channel
12. APEJ Basmati Rice Market Analysis and Forecast, By Country, 2012-2022
12.1. China Basmati Rice Market Size and Forecast, 2012-2022
12.1.1. Revenue (US$ Mn) Comparison, By Type
12.1.2. Revenue (US$ Mn) Comparison, By Species
12.1.3. Revenue (US$ Mn) Comparison, By Application
12.1.4. Revenue (US$ Mn) Comparison, By Sales Channel
12.2. India Basmati Rice Market Size and Forecast, 2012-2022
12.2.1. Revenue (US$ Mn) Comparison, By Type
12.2.2. Revenue (US$ Mn) Comparison, By Species
12.2.3. Revenue (US$ Mn) Comparison, By Application
12.2.4. Revenue (US$ Mn) Comparison, By Sales Channel
12.3. Malaysia Basmati Rice Market Size and Forecast, 2012-2022
12.3.1. Revenue (US$ Mn) Comparison, By Type
12.3.2. Revenue (US$ Mn) Comparison, By Species
12.3.3. Revenue (US$ Mn) Comparison, By Application
12.3.4. Revenue (US$ Mn) Comparison, By Sales Channel
12.4. Thailand Basmati Rice Market Size and Forecast, 2012-2022
12.4.1. Revenue (US$ Mn) Comparison, By Type
12.4.2. Revenue (US$ Mn) Comparison, By Species
12.4.3. Revenue (US$ Mn) Comparison, By Application
12.4.4. Revenue (US$ Mn) Comparison, By Sales Channel
12.5. Singapore Basmati Rice Market Size and Forecast, 2012-2022
12.5.1. Revenue (US$ Mn) Comparison, By Type
12.5.2. Revenue (US$ Mn) Comparison, By Species
12.5.3. Revenue (US$ Mn) Comparison, By Application
12.5.4. Revenue (US$ Mn) Comparison, By Sales Channel
12.6. Australia Basmati Rice Market Size and Forecast, 2012-2022
12.6.1. Revenue (US$ Mn) Comparison, By Type
12.6.2. Revenue (US$ Mn) Comparison, By Species
12.6.3. Revenue (US$ Mn) Comparison, By Application
12.6.4. Revenue (US$ Mn) Comparison, By Sales Channel
13. MEA Basmati Rice Market Analysis and Forecast, By Country, 2012-2022
13.1. GCC Countries Basmati Rice Market Size and Forecast, 2012-2022
13.1.1. Revenue (US$ Mn) Comparison, By Type
13.1.2. Revenue (US$ Mn) Comparison, By Species
13.1.3. Revenue (US$ Mn) Comparison, By Application
13.1.4. Revenue (US$ Mn) Comparison, By Sales Channel
13.2. South Africa Basmati Rice Market Size and Forecast, 2012-2022
13.2.1. Revenue (US$ Mn) Comparison, By Type
13.2.2. Revenue (US$ Mn) Comparison, By Species
13.2.3. Revenue (US$ Mn) Comparison, By Application
13.2.4. Revenue (US$ Mn) Comparison, By Sales Channel
13.3. Nigeria Basmati Rice Market Size and Forecast, 2012-2022
13.3.1. Revenue (US$ Mn) Comparison, By Type
13.3.2. Revenue (US$ Mn) Comparison, By Species
13.3.3. Revenue (US$ Mn) Comparison, By Application
13.3.4. Revenue (US$ Mn) Comparison, By Sales Channel
13.4. Israel Basmati Rice Market Size and Forecast, 2012-2022
13.4.1. Revenue (US$ Mn) Comparison, By Type
13.4.2. Revenue (US$ Mn) Comparison, By Species
13.4.3. Revenue (US$ Mn) Comparison, By Application
13.4.4. Revenue (US$ Mn) Comparison, By Sales Channel
14. Global Basmati Rice Market Company Share, Competition Landscape and Company Profiles
14.1. Company Share Analysis
14.2. Competition Landscape
14.3. Company Profiles
14.3.1. KRBL Limited
14.3.2. McCormick & Company, Incorporated
14.3.3. LT Foods Limited
14.3.4. REI Agro Limited
14.3.5. The Hain Celestial Group, Inc.
14.3.6. The Rice 'n Spice Intl Ltd
14.3.7. Amira Nature Foods Ltd.
14.3.8. East End Foods
14.3.9. Mars, Incorporated
14.3.10. Estraco Kft.
15. Research Methodology
16. Secondary and Primary Sources
17. Assumptions and Acronyms
18. Disclaimer
List of Tables
TABLE 1 Global Basmati Rice Market Value (US$ Mn), 2012-2016
TABLE 2 Global Basmati Rice Market Value (US$ Mn), 2017-2022
TABLE 3 Global Basmati Rice Market Value (US$ Mn) and Y-o-Y, 2015-2022
TABLE 4 Global Raw Segment Value (US$ Mn), By Region 2012-2016
TABLE 5 Global Raw Segment Value (US$ Mn), By Region 2017-2022
TABLE 6 Global Raw Segment Market Share, By Region 2012-2016
TABLE 7 Global Raw Segment Market Share, By Region 2017-2022
TABLE 8 Global Raw Segment Y-o-Y, By Region 2015-2022
TABLE 9 Global Steamed Segment Value (US$ Mn), By Region 2012-2016
TABLE 10 Global Steamed Segment Value (US$ Mn), By Region 2017-2022
TABLE 11 Global Steamed Segment Market Share, By Region 2012-2016
TABLE 12 Global Steamed Segment Market Share, By Region 2017-2022
TABLE 13 Global Steamed Segment Y-o-Y, By Region 2015-2022
TABLE 14 Global Parboiled Segment Value (US$ Mn), By Region 2012-2016
TABLE 15 Global Parboiled Segment Value (US$ Mn), By Region 2017-2022
TABLE 16 Global Parboiled Segment Market Share, By Region 2012-2016
TABLE 17 Global Parboiled Segment Market Share, By Region 2017-2022
TABLE 18 Global Parboiled Segment Y-o-Y, By Region 2015-2022
TABLE 19 Global White Segment Value (US$ Mn), By Region 2012-2016
TABLE 20 Global White Segment Value (US$ Mn), By Region 2017-2022
TABLE 21 Global White Segment Market Share, By Region 2012-2016
TABLE 22 Global White Segment Market Share, By Region 2017-2022
TABLE 23 Global White Segment Y-o-Y, By Region 2015-2022
TABLE 24 Global Brown Segment Value (US$ Mn), By Region 2012-2016
TABLE 25 Global Brown Segment Value (US$ Mn), By Region 2017-2022
TABLE 26 Global Brown Segment Market Share, By Region 2012-2016
TABLE 27 Global Brown Segment Market Share, By Region 2017-2022
TABLE 28 Global Brown Segment Y-o-Y, By Region 2015-2022
TABLE 29 Global Other Species Segment Value (US$ Mn), By Region 2012-2016
TABLE 30 Global Other Species Segment Value (US$ Mn), By Region 2017-2022
TABLE 31 Global Other Species Segment Market Share, By Region 2012-2016
TABLE 32 Global Other Species Segment Market Share, By Region 2017-2022
TABLE 33 Global Other Species Segment Y-o-Y, By Region 2015-2022
TABLE 34 Global Food Segment Value (US$ Mn), By Region 2012-2016
TABLE 35 Global Food Segment Value (US$ Mn), By Region 2017-2022
TABLE 36 Global Food Segment Market Share, By Region 2012-2016
TABLE 37 Global Food Segment Market Share, By Region 2017-2022
TABLE 38 Global Food Segment Y-o-Y, By Region 2015-2022
TABLE 39 Global Cosmetic and Personal Care Segment Value (US$ Mn), By Region 2012-2016
TABLE 40 Global Cosmetic and Personal Care Segment Value (US$ Mn), By Region 2017-2022
TABLE 41 Global Cosmetic and Personal Care Segment Market Share, By Region 2012-2016
TABLE 42 Global Cosmetic and Personal Care Segment Market Share, By Region 2017-2022
TABLE 43 Global Cosmetic and Personal Care Segment Y-o-Y, By Region 2015-2022
TABLE 44 Global Other Application Segment Value (US$ Mn), By Region 2012-2016
TABLE 45 Global Other Application Segment Value (US$ Mn), By Region 2017-2022
TABLE 46 Global Other Application Segment Market Share, By Region 2012-2016
TABLE 47 Global Other Application Segment Market Share, By Region 2017-2022
TABLE 48 Global Other Application Segment Y-o-Y, By Region 2015-2022
TABLE 49 Global HORECA Segment Value (US$ Mn), By Region 2012-2016
TABLE 50 Global HORECA Segment Value (US$ Mn), By Region 2017-2022
TABLE 51 Global HORECA Segment Market Share, By Region 2012-2016
TABLE 52 Global HORECA Segment Market Share, By Region 2017-2022
TABLE 53 Global HORECA Segment Y-o-Y, By Region 2015-2022
TABLE 54 Global Modern Trade Segment Value (US$ Mn), By Region 2012-2016
TABLE 55 Global Modern Trade Segment Value (US$ Mn), By Region 2017-2022
TABLE 56 Global Modern Trade Segment Market Share, By Region 2012-2016
TABLE 57 Global Modern Trade Segment Market Share, By Region 2017-2022
TABLE 58 Global Modern Trade Segment Y-o-Y, By Region 2015-2022
TABLE 59 Global Convenience Store Segment Value (US$ Mn), By Region 2012-2016
TABLE 60 Global Convenience Store Segment Value (US$ Mn), By Region 2017-2022
TABLE 61 Global Convenience Store Segment Market Share, By Region 2012-2016
TABLE 62 Global Convenience Store Segment Market Share, By Region 2017-2022
TABLE 63 Global Convenience Store Segment Y-o-Y, By Region 2015-2022
TABLE 64 Global Online Store Segment Value (US$ Mn), By Region 2012-2016
TABLE 65 Global Online Store Segment Value (US$ Mn), By Region 2017-2022
TABLE 66 Global Online Store Segment Market Share, By Region 2012-2016
TABLE 67 Global Online Store Segment Market Share, By Region 2017-2022
TABLE 68 Global Online Store Segment Y-o-Y, By Region 2015-2022
TABLE 69 Global Traditional Grocery Stores Segment Value (US$ Mn), By Region 2012-2016
TABLE 70 Global Traditional Grocery Stores Segment Value (US$ Mn), By Region 2017-2022
TABLE 71 Global Traditional Grocery Stores Segment Market Share, By Region 2012-2016
TABLE 72 Global Traditional Grocery Stores Segment Market Share, By Region 2017-2022
TABLE 73 Global Traditional Grocery Stores Segment Y-o-Y, By Region 2015-2022
TABLE 74 Global Other Sales Channel Segment Value (US$ Mn), By Region 2012-2016
TABLE 75 Global Other Sales Channel Segment Value (US$ Mn), By Region 2017-2022
TABLE 76 Global Other Sales Channel Segment Market Share, By Region 2012-2016
TABLE 77 Global Other Sales Channel Segment Market Share, By Region 2017-2022
TABLE 78 Global Other Sales Channel Segment Y-o-Y, By Region 2015-2022
TABLE 79 North America Basmati Rice Market Value (US$ Mn), By Type 2012-2016
TABLE 80 North America Basmati Rice Market Value (US$ Mn), By Type 2017-2022
TABLE 81 North America Basmati Rice Market Value (US$ Mn), By Species 2012-2016
TABLE 82 North America Basmati Rice Market Value (US$ Mn), By Species 2017-2022
TABLE 83 North America Basmati Rice Market Value (US$ Mn), By Application 2012-2016
TABLE 84 North America Basmati Rice Market Value (US$ Mn), By Application 2017-2022
TABLE 85 North America Basmati Rice Market Value (US$ Mn), By Sales Channel 2012-2016
TABLE 86 North America Basmati Rice Market Value (US$ Mn), By Sales Channel 2017-2022
TABLE 87 Latin America Basmati Rice Market Value (US$ Mn), By Type 2012-2016
TABLE 88 Latin America Basmati Rice Market Value (US$ Mn), By Type 2017-2022
TABLE 89 Latin America Basmati Rice Market Value (US$ Mn), By Species 2012-2016
TABLE 90 Latin America Basmati Rice Market Value (US$ Mn), By Species 2017-2022
TABLE 91 Latin America Basmati Rice Market Value (US$ Mn), By Application 2012-2016
TABLE 92 Latin America Basmati Rice Market Value (US$ Mn), By Application 2017-2022
TABLE 93 Latin America Basmati Rice Market Value (US$ Mn), By Sales Channel 2012-2016
TABLE 94 Latin America Basmati Rice Market Value (US$ Mn), By Sales Channel 2017-2022
TABLE 95 Europe Basmati Rice Market Value (US$ Mn), By Type 2012-2016
TABLE 96 Europe Basmati Rice Market Value (US$ Mn), By Type 2017-2022
TABLE 97 Europe Basmati Rice Market Value (US$ Mn), By Species 2012-2016
TABLE 98 Europe Basmati Rice Market Value (US$ Mn), By Species 2017-2022
TABLE 99 Europe Basmati Rice Market Value (US$ Mn), By Application 2012-2016
TABLE 100 Europe Basmati Rice Market Value (US$ Mn), By Application 2017-2022
TABLE 101 Europe Basmati Rice Market Value (US$ Mn), By Sales Channel 2012-2016
TABLE 102 Europe Basmati Rice Market Value (US$ Mn), By Sales Channel 2017-2022
TABLE 103 Japan Basmati Rice Market Value (US$ Mn), By Type 2012-2016
TABLE 104 Japan Basmati Rice Market Value (US$ Mn), By Type 2017-2022
TABLE 105 Japan Basmati Rice Market Value (US$ Mn), By Species 2012-2016
TABLE 106 Japan Basmati Rice Market Value (US$ Mn), By Species 2017-2022
TABLE 107 Japan Basmati Rice Market Value (US$ Mn), By Application 2012-2016
TABLE 108 Japan Basmati Rice Market Value (US$ Mn), By Application 2017-2022
TABLE 109 Japan Basmati Rice Market Value (US$ Mn), By Sales Channel 2012-2016
TABLE 110 Japan Basmati Rice Market Value (US$ Mn), By Sales Channel 2017-2022
TABLE 111 APEJ Basmati Rice Market Value (US$ Mn), By Type 2012-2016
TABLE 112 APEJ Basmati Rice Market Value (US$ Mn), By Type 2017-2022
TABLE 113 APEJ Basmati Rice Market Value (US$ Mn), By Species 2012-2016
TABLE 114 APEJ Basmati Rice Market Value (US$ Mn), By Species 2017-2022
TABLE 115 APEJ Basmati Rice Market Value (US$ Mn), By Application 2012-2016
TABLE 116 APEJ Basmati Rice Market Value (US$ Mn), By Application 2017-2022
TABLE 117 APEJ Basmati Rice Market Value (US$ Mn), By Sales Channel 2012-2016
TABLE 118 APEJ Basmati Rice Market Value (US$ Mn), By Sales Channel 2017-2022
TABLE 119 MEA Basmati Rice Market Value (US$ Mn), By Type 2012-2016
TABLE 120 MEA Basmati Rice Market Value (US$ Mn), By Type 2017-2022
TABLE 121 MEA Basmati Rice Market Value (US$ Mn), By Species 2012-2016
TABLE 122 MEA Basmati Rice Market Value (US$ Mn), By Species 2017-2022
TABLE 123 MEA Basmati Rice Market Value (US$ Mn), By Application 2012-2016
TABLE 124 MEA Basmati Rice Market Value (US$ Mn), By Application 2017-2022
TABLE 125 MEA Basmati Rice Market Value (US$ Mn), By Sales Channel 2012-2016
TABLE 126 MEA Basmati Rice Market Value (US$ Mn), By Sales Channel 2017-2022
TABLE 127 US Basmati Rice Market Value (US$ Mn), By Type 2012-2016
TABLE 128 US Basmati Rice Market Value (US$ Mn), By Type 2017-2022
TABLE 129 US Basmati Rice Market Value (US$ Mn), By Species 2012-2016
TABLE 130 US Basmati Rice Market Value (US$ Mn), By Species 2017-2022
TABLE 131 US Basmati Rice Market Value (US$ Mn), By Application 2012-2016
TABLE 132 US Basmati Rice Market Value (US$ Mn), By Application 2017-2022
TABLE 133 US Basmati Rice Market Value (US$ Mn), By Sales Channel 2012-2016
TABLE 134 US Basmati Rice Market Value (US$ Mn), By Sales Channel 2017-2022
TABLE 135 Canada Basmati Rice Market Value (US$ Mn), By Type 2012-2016
TABLE 136 Canada Basmati Rice Market Value (US$ Mn), By Type 2017-2022
TABLE 137 Canada Basmati Rice Market Value (US$ Mn), By Species 2012-2016
TABLE 138 Canada Basmati Rice Market Value (US$ Mn), By Species 2017-2022
TABLE 139 Canada Basmati Rice Market Value (US$ Mn), By Application 2012-2016
TABLE 140 Canada Basmati Rice Market Value (US$ Mn), By Application 2017-2022
TABLE 141 Canada Basmati Rice Market Value (US$ Mn), By Sales Channel 2012-2016
TABLE 142 Canada Basmati Rice Market Value (US$ Mn), By Sales Channel 2017-2022
TABLE 143 Brazil Basmati Rice Market Value (US$ Mn), By Type 2012-2016
TABLE 144 Brazil Basmati Rice Market Value (US$ Mn), By Type 2017-2022
TABLE 145 Brazil Basmati Rice Market Value (US$ Mn), By Species 2012-2016
TABLE 146 Brazil Basmati Rice Market Value (US$ Mn), By Species 2017-2022
TABLE 147 Brazil Basmati Rice Market Value (US$ Mn), By Application 2012-2016
TABLE 148 Brazil Basmati Rice Market Value (US$ Mn), By Application 2017-2022
TABLE 149 Brazil Basmati Rice Market Value (US$ Mn), By Sales Channel 2012-2016
TABLE 150 Brazil Basmati Rice Market Value (US$ Mn), By Sales Channel 2017-2022
TABLE 151 Mexico Basmati Rice Market Value (US$ Mn), By Type 2012-2016
TABLE 152 Mexico Basmati Rice Market Value (US$ Mn), By Type 2017-2022
TABLE 153 Mexico Basmati Rice Market Value (US$ Mn), By Species 2012-2016
TABLE 154 Mexico Basmati Rice Market Value (US$ Mn), By Species 2017-2022
TABLE 155 Mexico Basmati Rice Market Value (US$ Mn), By Application 2012-2016
TABLE 156 Mexico Basmati Rice Market Value (US$ Mn), By Application 2017-2022
TABLE 157 Mexico Basmati Rice Market Value (US$ Mn), By Sales Channel 2012-2016
TABLE 158 Mexico Basmati Rice Market Value (US$ Mn), By Sales Channel 2017-2022
TABLE 159 Argentina Basmati Rice Market Value (US$ Mn), By Type 2012-2016
TABLE 160 Argentina Basmati Rice Market Value (US$ Mn), By Type 2017-2022
TABLE 161 Argentina Basmati Rice Market Value (US$ Mn), By Species 2012-2016
TABLE 162 Argentina Basmati Rice Market Value (US$ Mn), By Species 2017-2022
TABLE 163 Argentina Basmati Rice Market Value (US$ Mn), By Application 2012-2016
TABLE 164 Argentina Basmati Rice Market Value (US$ Mn), By Application 2017-2022
TABLE 165 Argentina Basmati Rice Market Value (US$ Mn), By Sales Channel 2012-2016
TABLE 166 Argentina Basmati Rice Market Value (US$ Mn), By Sales Channel 2017-2022
TABLE 167 Germany Basmati Rice Market Value (US$ Mn), By Type 2012-2016
TABLE 168 Germany Basmati Rice Market Value (US$ Mn), By Type 2017-2022
TABLE 169 Germany Basmati Rice Market Value (US$ Mn), By Species 2012-2016
TABLE 170 Germany Basmati Rice Market Value (US$ Mn), By Species 2017-2022
TABLE 171 Germany Basmati Rice Market Value (US$ Mn), By Application 2012-2016
TABLE 172 Germany Basmati Rice Market Value (US$ Mn), By Application 2017-2022
TABLE 173 Germany Basmati Rice Market Value (US$ Mn), By Sales Channel 2012-2016
TABLE 174 Germany Basmati Rice Market Value (US$ Mn), By Sales Channel 2017-2022
TABLE 175 UK Basmati Rice Market Value (US$ Mn), By Type 2012-2016
TABLE 176 UK Basmati Rice Market Value (US$ Mn), By Type 2017-2022
TABLE 177 UK Basmati Rice Market Value (US$ Mn), By Species 2012-2016
TABLE 178 UK Basmati Rice Market Value (US$ Mn), By Species 2017-2022
TABLE 179 UK Basmati Rice Market Value (US$ Mn), By Application 2012-2016
TABLE 180 UK Basmati Rice Market Value (US$ Mn), By Application 2017-2022
TABLE 181 UK Basmati Rice Market Value (US$ Mn), By Sales Channel 2012-2016
TABLE 182 UK Basmati Rice Market Value (US$ Mn), By Sales Channel 2017-2022
TABLE 183 France Basmati Rice Market Value (US$ Mn), By Type 2012-2016
TABLE 184 France Basmati Rice Market Value (US$ Mn), By Type 2017-2022
TABLE 185 France Basmati Rice Market Value (US$ Mn), By Species 2012-2016
TABLE 186 France Basmati Rice Market Value (US$ Mn), By Species 2017-2022
TABLE 187 France Basmati Rice Market Value (US$ Mn), By Application 2012-2016
TABLE 188 France Basmati Rice Market Value (US$ Mn), By Application 2017-2022
TABLE 189 France Basmati Rice Market Value (US$ Mn), By Sales Channel 2012-2016
TABLE 190 France Basmati Rice Market Value (US$ Mn), By Sales Channel 2017-2022
TABLE 191 Spain Basmati Rice Market Value (US$ Mn), By Type 2012-2016
TABLE 192 Spain Basmati Rice Market Value (US$ Mn), By Type 2017-2022
TABLE 193 Spain Basmati Rice Market Value (US$ Mn), By Species 2012-2016
TABLE 194 Spain Basmati Rice Market Value (US$ Mn), By Species 2017-2022
TABLE 195 Spain Basmati Rice Market Value (US$ Mn), By Application 2012-2016
TABLE 196 Spain Basmati Rice Market Value (US$ Mn), By Application 2017-2022
TABLE 197 Spain Basmati Rice Market Value (US$ Mn), By Sales Channel 2012-2016
TABLE 198 Spain Basmati Rice Market Value (US$ Mn), By Sales Channel 2017-2022
TABLE 199 Italy Basmati Rice Market Value (US$ Mn), By Type 2012-2016
TABLE 200 Italy Basmati Rice Market Value (US$ Mn), By Type 2017-2022
TABLE 201 Italy Basmati Rice Market Value (US$ Mn), By Species 2012-2016
TABLE 202 Italy Basmati Rice Market Value (US$ Mn), By Species 2017-2022
TABLE 203 Italy Basmati Rice Market Value (US$ Mn), By Application 2012-2016
TABLE 204 Italy Basmati Rice Market Value (US$ Mn), By Application 2017-2022
TABLE 205 Italy Basmati Rice Market Value (US$ Mn), By Sales Channel 2012-2016
TABLE 206 Italy Basmati Rice Market Value (US$ Mn), By Sales Channel 2017-2022
TABLE 207 Nordic Basmati Rice Market Value (US$ Mn), By Type 2012-2016
TABLE 208 Nordic Basmati Rice Market Value (US$ Mn), By Type 2017-2022
TABLE 209 Nordic Basmati Rice Market Value (US$ Mn), By Species 2012-2016
TABLE 210 Nordic Basmati Rice Market Value (US$ Mn), By Species 2017-2022
TABLE 211 Nordic Basmati Rice Market Value (US$ Mn), By Application 2012-2016
TABLE 212 Nordic Basmati Rice Market Value (US$ Mn), By Application 2017-2022
TABLE 213 Nordic Basmati Rice Market Value (US$ Mn), By Sales Channel 2012-2016
TABLE 214 Nordic Basmati Rice Market Value (US$ Mn), By Sales Channel 2017-2022
TABLE 215 Japan Basmati Rice Market Value (US$ Mn), By Type 2012-2016
TABLE 216 Japan Basmati Rice Market Value (US$ Mn), By Type 2017-2022
TABLE 217 Japan Basmati Rice Market Value (US$ Mn), By Species 2012-2016
TABLE 218 Japan Basmati Rice Market Value (US$ Mn), By Species 2017-2022
TABLE 219 Japan Basmati Rice Market Value (US$ Mn), By Application 2012-2016
TABLE 220 Japan Basmati Rice Market Value (US$ Mn), By Application 2017-2022
TABLE 221 Japan Basmati Rice Market Value (US$ Mn), By Sales Channel 2012-2016
TABLE 222 Japan Basmati Rice Market Value (US$ Mn), By Sales Channel 2017-2022
TABLE 223 China Basmati Rice Market Value (US$ Mn), By Type 2012-2016
TABLE 224 China Basmati Rice Market Value (US$ Mn), By Type 2017-2022
TABLE 225 China Basmati Rice Market Value (US$ Mn), By Species 2012-2016
TABLE 226 China Basmati Rice Market Value (US$ Mn), By Species 2017-2022
TABLE 227 China Basmati Rice Market Value (US$ Mn), By Application 2012-2016
TABLE 228 China Basmati Rice Market Value (US$ Mn), By Application 2017-2022
TABLE 229 China Basmati Rice Market Value (US$ Mn), By Sales Channel 2012-2016
TABLE 230 China Basmati Rice Market Value (US$ Mn), By Sales Channel 2017-2022
TABLE 231 India Basmati Rice Market Value (US$ Mn), By Type 2012-2016
TABLE 232 India Basmati Rice Market Value (US$ Mn), By Type 2017-2022
TABLE 233 India Basmati Rice Market Value (US$ Mn), By Species 2012-2016
TABLE 234 India Basmati Rice Market Value (US$ Mn), By Species 2017-2022
TABLE 235 India Basmati Rice Market Value (US$ Mn), By Application 2012-2016
TABLE 236 India Basmati Rice Market Value (US$ Mn), By Application 2017-2022
TABLE 237 India Basmati Rice Market Value (US$ Mn), By Sales Channel 2012-2016
TABLE 238 India Basmati Rice Market Value (US$ Mn), By Sales Channel 2017-2022
TABLE 239 Malaysia Basmati Rice Market Value (US$ Mn), By Type 2012-2016
TABLE 240 Malaysia Basmati Rice Market Value (US$ Mn), By Type 2017-2022
TABLE 241 Malaysia Basmati Rice Market Value (US$ Mn), By Species 2012-2016
TABLE 242 Malaysia Basmati Rice Market Value (US$ Mn), By Species 2017-2022
TABLE 243 Malaysia Basmati Rice Market Value (US$ Mn), By Application 2012-2016
TABLE 244 Malaysia Basmati Rice Market Value (US$ Mn), By Application 2017-2022
TABLE 245 Malaysia Basmati Rice Market Value (US$ Mn), By Sales Channel 2012-2016
TABLE 246 Malaysia Basmati Rice Market Value (US$ Mn), By Sales Channel 2017-2022
TABLE 247 Thailand Basmati Rice Market Value (US$ Mn), By Type 2012-2016
TABLE 248 Thailand Basmati Rice Market Value (US$ Mn), By Type 2017-2022
TABLE 249 Thailand Basmati Rice Market Value (US$ Mn), By Species 2012-2016
TABLE 250 Thailand Basmati Rice Market Value (US$ Mn), By Species 2017-2022
TABLE 251 Thailand Basmati Rice Market Value (US$ Mn), By Application 2012-2016
TABLE 252 Thailand Basmati Rice Market Value (US$ Mn), By Application 2017-2022
TABLE 253 Thailand Basmati Rice Market Value (US$ Mn), By Sales Channel 2012-2016
TABLE 254 Thailand Basmati Rice Market Value (US$ Mn), By Sales Channel 2017-2022
TABLE 255 Singapore Basmati Rice Market Value (US$ Mn), By Type 2012-2016
TABLE 256 Singapore Basmati Rice Market Value (US$ Mn), By Type 2017-2022
TABLE 257 Singapore Basmati Rice Market Value (US$ Mn), By Species 2012-2016
TABLE 258 Singapore Basmati Rice Market Value (US$ Mn), By Species 2017-2022
TABLE 259 Singapore Basmati Rice Market Value (US$ Mn), By Application 2012-2016
TABLE 260 Singapore Basmati Rice Market Value (US$ Mn), By Application 2017-2022
TABLE 261 Singapore Basmati Rice Market Value (US$ Mn), By Sales Channel 2012-2016
TABLE 262 Singapore Basmati Rice Market Value (US$ Mn), By Sales Channel 2017-2022
TABLE 263 Australia Basmati Rice Market Value (US$ Mn), By Type 2012-2016
TABLE 264 Australia Basmati Rice Market Value (US$ Mn), By Type 2017-2022
TABLE 265 Australia Basmati Rice Market Value (US$ Mn), By Species 2012-2016
TABLE 266 Australia Basmati Rice Market Value (US$ Mn), By Species 2017-2022
TABLE 267 Australia Basmati Rice Market Value (US$ Mn), By Application 2012-2016
TABLE 268 Australia Basmati Rice Market Value (US$ Mn), By Application 2017-2022
TABLE 269 Australia Basmati Rice Market Value (US$ Mn), By Sales Channel 2012-2016
TABLE 270 Australia Basmati Rice Market Value (US$ Mn), By Sales Channel 2017-2022
TABLE 271 GCC Countries Basmati Rice Market Value (US$ Mn), By Type 2012-2016
TABLE 272 GCC Countries Basmati Rice Market Value (US$ Mn), By Type 2017-2022
TABLE 273 GCC Countries Basmati Rice Market Value (US$ Mn), By Species 2012-2016
TABLE 274 GCC Countries Basmati Rice Market Value (US$ Mn), By Species 2017-2022
TABLE 275 GCC Countries Basmati Rice Market Value (US$ Mn), By Application 2012-2016
TABLE 276 GCC Countries Basmati Rice Market Value (US$ Mn), By Application 2017-2022
TABLE 277 GCC Countries Basmati Rice Market Value (US$ Mn), By Sales Channel 2012-2016
TABLE 278 GCC Countries Basmati Rice Market Value (US$ Mn), By Sales Channel 2017-2022
TABLE 279 South Africa Basmati Rice Market Value (US$ Mn), By Type 2012-2016
TABLE 280 South Africa Basmati Rice Market Value (US$ Mn), By Type 2017-2022
TABLE 281 South Africa Basmati Rice Market Value (US$ Mn), By Species 2012-2016
TABLE 282 South Africa Basmati Rice Market Value (US$ Mn), By Species 2017-2022
TABLE 283 South Africa Basmati Rice Market Value (US$ Mn), By Application 2012-2016
TABLE 284 South Africa Basmati Rice Market Value (US$ Mn), By Application 2017-2022
TABLE 285 South Africa Basmati Rice Market Value (US$ Mn), By Sales Channel 2012-2016
TABLE 286 South Africa Basmati Rice Market Value (US$ Mn), By Sales Channel 2017-2022
TABLE 287 Nigeria Basmati Rice Market Value (US$ Mn), By Type 2012-2016
TABLE 288 Nigeria Basmati Rice Market Value (US$ Mn), By Type 2017-2022
TABLE 289 Nigeria Basmati Rice Market Value (US$ Mn), By Species 2012-2016
TABLE 290 Nigeria Basmati Rice Market Value (US$ Mn), By Species 2017-2022
TABLE 291 Nigeria Basmati Rice Market Value (US$ Mn), By Application 2012-2016
TABLE 292 Nigeria Basmati Rice Market Value (US$ Mn), By Application 2017-2022
TABLE 293 Nigeria Basmati Rice Market Value (US$ Mn), By Sales Channel 2012-2016
TABLE 294 Nigeria Basmati Rice Market Value (US$ Mn), By Sales Channel 2017-2022
TABLE 295 Israel Basmati Rice Market Value (US$ Mn), By Type 2012-2016
TABLE 296 Israel Basmati Rice Market Value (US$ Mn), By Type 2017-2022
TABLE 297 Israel Basmati Rice Market Value (US$ Mn), By Species 2012-2016
TABLE 298 Israel Basmati Rice Market Value (US$ Mn), By Species 2017-2022
TABLE 299 Israel Basmati Rice Market Value (US$ Mn), By Application 2012-2016
TABLE 300 Israel Basmati Rice Market Value (US$ Mn), By Application 2017-2022
TABLE 301 Israel Basmati Rice Market Value (US$ Mn), By Sales Channel 2012-2016
TABLE 302 Israel Basmati Rice Market Value (US$ Mn), By Sales Channel 2017-2022
List of Figures
FIG. 1 Global Basmati Rice Market Value (US$ Mn), 2012-2016
FIG. 2 Global Basmati Rice Market Value (US$ Mn) Forecast, 2017-2022
FIG. 3 Global Basmati Rice Market Value (US$ Mn) and Y-o-Y, 2015-2022
FIG. 4 Global Raw Segment Market Value (US$ Mn) By Region, 2012-2016
FIG. 5 Global Raw Segment Market Value (US$ Mn) By Region, 2017-2022
FIG. 6 Global Raw Segment Y-o-Y Growth Rate, By Region, 2015-2022
FIG. 7 Global Steamed Segment Market Value (US$ Mn) By Region, 2012-2016
FIG. 8 Global Steamed Segment Market Value (US$ Mn) By Region, 2017-2022
FIG. 9 Global Steamed Segment Y-o-Y Growth Rate, By Region, 2015-2022
FIG. 10 Global Parboiled Segment Market Value (US$ Mn) By Region, 2012-2016
FIG. 11 Global Parboiled Segment Market Value (US$ Mn) By Region, 2017-2022
FIG. 12 Global Parboiled Segment Y-o-Y Growth Rate, By Region, 2015-2022
FIG. 13 Global White Segment Market Value (US$ Mn) By Region, 2012-2016
FIG. 14 Global White Segment Market Value (US$ Mn) By Region, 2017-2022
FIG. 15 Global White Segment Y-o-Y Growth Rate, By Region, 2015-2022
FIG. 16 Global Brown Segment Market Value (US$ Mn) By Region, 2012-2016
FIG. 17 Global Brown Segment Market Value (US$ Mn) By Region, 2017-2022
FIG. 18 Global Brown Segment Y-o-Y Growth Rate, By Region, 2015-2022
FIG. 19 Global Other Species Segment Market Value (US$ Mn) By Region, 2012-2016
FIG. 20 Global Other Species Segment Market Value (US$ Mn) By Region, 2017-2022
FIG. 21 Global Other Species Segment Y-o-Y Growth Rate, By Region, 2015-2022
FIG. 22 Global Food Segment Market Value (US$ Mn) By Region, 2012-2016
FIG. 23 Global Food Segment Market Value (US$ Mn) By Region, 2017-2022
FIG. 24 Global Food Segment Y-o-Y Growth Rate, By Region, 2015-2022
FIG. 25 Global Cosmetic and Personal Care Segment Market Value (US$ Mn) By Region, 2012-2016
FIG. 26 Global Cosmetic and Personal Care Segment Market Value (US$ Mn) By Region, 2017-2022
FIG. 27 Global Cosmetic and Personal Care Segment Y-o-Y Growth Rate, By Region, 2015-2022
FIG. 28 Global Other Application Segment Market Value (US$ Mn) By Region, 2012-2016
FIG. 29 Global Other Application Segment Market Value (US$ Mn) By Region, 2017-2022
FIG. 30 Global Other Application Segment Y-o-Y Growth Rate, By Region, 2015-2022
FIG. 31 Global HORECA Segment Market Value (US$ Mn) By Region, 2012-2016
FIG. 32 Global HORECA Segment Market Value (US$ Mn) By Region, 2017-2022
FIG. 33 Global HORECA Segment Y-o-Y Growth Rate, By Region, 2015-2022
FIG. 34 Global Modern Trade Segment Market Value (US$ Mn) By Region, 2012-2016
FIG. 35 Global Modern Trade Segment Market Value (US$ Mn) By Region, 2017-2022
FIG. 36 Global Modern Trade Segment Y-o-Y Growth Rate, By Region, 2015-2022
FIG. 37 Global Convenience Store Segment Market Value (US$ Mn) By Region, 2012-2016
FIG. 38 Global Convenience Store Segment Market Value (US$ Mn) By Region, 2017-2022
FIG. 39 Global Convenience Store Segment Y-o-Y Growth Rate, By Region, 2015-2022
FIG. 40 Global Online Store Segment Market Value (US$ Mn) By Region, 2012-2016
FIG. 41 Global Online Store Segment Market Value (US$ Mn) By Region, 2017-2022
FIG. 42 Global Online Store Segment Y-o-Y Growth Rate, By Region, 2015-2022
FIG. 43 Global Traditional Grocery Stores Segment Market Value (US$ Mn) By Region, 2012-2016
FIG. 44 Global Traditional Grocery Stores Segment Market Value (US$ Mn) By Region, 2017-2022
FIG. 45 Global Traditional Grocery Stores Segment Y-o-Y Growth Rate, By Region, 2015-2022
FIG. 46 Global Other Sales Channel Segment Market Value (US$ Mn) By Region, 2012-2016
FIG. 47 Global Other Sales Channel Segment Market Value (US$ Mn) By Region, 2017-2022
FIG. 48 Global Other Sales Channel Segment Y-o-Y Growth Rate, By Region, 2015-2022
FIG. 49 North America Basmati Rice Market Value (US$ Mn), By Type 2012-2016
FIG. 50 North America Basmati Rice Market Value (US$ Mn), By Type 2017-2022
FIG. 51 North America Basmati Rice Market Value (US$ Mn), By Species 2012-2016
FIG. 52 North America Basmati Rice Market Value (US$ Mn), By Species 2017-2022
FIG. 53 North America Basmati Rice Market Value (US$ Mn), By Application 2012-2016
FIG. 54 North America Basmati Rice Market Value (US$ Mn), By Application 2017-2022
FIG. 55 North America Basmati Rice Market Value (US$ Mn), By Sales Channel 2012-2016
FIG. 56 North America Basmati Rice Market Value (US$ Mn), By Sales Channel 2017-2022
FIG. 57 Latin America Basmati Rice Market Value (US$ Mn), By Type 2012-2016
FIG. 58 Latin America Basmati Rice Market Value (US$ Mn), By Type 2017-2022
FIG. 59 Latin America Basmati Rice Market Value (US$ Mn), By Species 2012-2016
FIG. 60 Latin America Basmati Rice Market Value (US$ Mn), By Species 2017-2022
FIG. 61 Latin America Basmati Rice Market Value (US$ Mn), By Application 2012-2016
FIG. 62 Latin America Basmati Rice Market Value (US$ Mn), By Application 2017-2022
FIG. 63 Latin America Basmati Rice Market Value (US$ Mn), By Sales Channel 2012-2016
FIG. 64 Latin America Basmati Rice Market Value (US$ Mn), By Sales Channel 2017-2022
FIG. 65 Europe Basmati Rice Market Value (US$ Mn), By Type 2012-2016
FIG. 66 Europe Basmati Rice Market Value (US$ Mn), By Type 2017-2022
FIG. 67 Europe Basmati Rice Market Value (US$ Mn), By Species 2012-2016
FIG. 68 Europe Basmati Rice Market Value (US$ Mn), By Species 2017-2022
FIG. 69 Europe Basmati Rice Market Value (US$ Mn), By Application 2012-2016
FIG. 70 Europe Basmati Rice Market Value (US$ Mn), By Application 2017-2022
FIG. 71 Europe Basmati Rice Market Value (US$ Mn), By Sales Channel 2012-2016
FIG. 72 Europe Basmati Rice Market Value (US$ Mn), By Sales Channel 2017-2022
FIG. 73 Japan Basmati Rice Market Value (US$ Mn), By Type 2012-2016
FIG. 74 Japan Basmati Rice Market Value (US$ Mn), By Type 2017-2022
FIG. 75 Japan Basmati Rice Market Value (US$ Mn), By Species 2012-2016
FIG. 76 Japan Basmati Rice Market Value (US$ Mn), By Species 2017-2022
FIG. 77 Japan Basmati Rice Market Value (US$ Mn), By Application 2012-2016
FIG. 78 Japan Basmati Rice Market Value (US$ Mn), By Application 2017-2022
FIG. 79 Japan Basmati Rice Market Value (US$ Mn), By Sales Channel 2012-2016
FIG. 80 Japan Basmati Rice Market Value (US$ Mn), By Sales Channel 2017-2022
FIG. 81 APEJ Basmati Rice Market Value (US$ Mn), By Type 2012-2016
FIG. 82 APEJ Basmati Rice Market Value (US$ Mn), By Type 2017-2022
FIG. 83 APEJ Basmati Rice Market Value (US$ Mn), By Species 2012-2016
FIG. 84 APEJ Basmati Rice Market Value (US$ Mn), By Species 2017-2022
FIG. 85 APEJ Basmati Rice Market Value (US$ Mn), By Application 2012-2016
FIG. 86 APEJ Basmati Rice Market Value (US$ Mn), By Application 2017-2022
FIG. 87 APEJ Basmati Rice Market Value (US$ Mn), By Sales Channel 2012-2016
FIG. 88 APEJ Basmati Rice Market Value (US$ Mn), By Sales Channel 2017-2022
FIG. 89 MEA Basmati Rice Market Value (US$ Mn), By Type 2012-2016
FIG. 90 MEA Basmati Rice Market Value (US$ Mn), By Type 2017-2022
FIG. 91 MEA Basmati Rice Market Value (US$ Mn), By Species 2012-2016
FIG. 92 MEA Basmati Rice Market Value (US$ Mn), By Species 2017-2022
FIG. 93 MEA Basmati Rice Market Value (US$ Mn), By Application 2012-2016
FIG. 94 MEA Basmati Rice Market Value (US$ Mn), By Application 2017-2022
FIG. 95 MEA Basmati Rice Market Value (US$ Mn), By Sales Channel 2012-2016
FIG. 96 MEA Basmati Rice Market Value (US$ Mn), By Sales Channel 2017-2022
Copyright © Transparency Market Research, Inc. All Rights reserved
Trust Online

Basmati Rice Market