
Reports
Reports
Global Barrier Resins Market: Snapshot
The global barrier resins market is expected to witness growth on the back of increasing preference for packaged food over non-packed food. The increasing health and hygiene considerations is leading consumers to opt for packaged food that is safe and is less likely to cause adverse effects. However, packaged food that is transported over long distances and is meant for later use needs to be prevented from spoilage and retain freshness as well. Barrier resins are used to prevent loss of flavor and to prevent permeation of oxygen in eatables.
Further, the emergence of newer materials for barrier resins such as LDPE, HDPE, and LLDPE that are increasingly taking over traditionally used materials such as PVDC due to health hazards associated with them is likely to provide growth opportunities to barrier resins market in the future. In addition, high production cost and long lead time are some other factors restraining this market over the past couple of years.
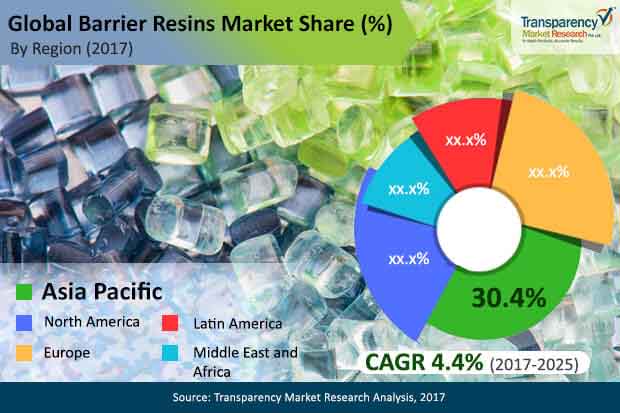
A report by Transparency Market Research (TMR) estimates the global barrier resins market to expand at a CAGR of 4.4% between 2017 and 2025, for the market’s valuation to become US$3.9 bn by the end of 2025 from US$2.7 bn in 2016.
Food and Beverage Application Segment Wins by Share due to High Consumption of Packaged Food
In this report, the global barrier resins market has been studied on the basis of material, application, and geography. On the basis of material type, the global barrier resins market is classified into nylon, EVOH, PVDC, and others. Of them, the EVOH segment is likely to hold dominance in the market over the forecast period. The high growth of EVOH segment is mainly because of excellent properties of EVOH of gas barrier, resistance to organic solvents and water, and easy processing. Nylon is also anticipated to emerge as a key segment over the forecast period on account of its low cost in comparison to other materials such as EVOH. On the other hand, PVDC segment is likely to display a declined market share owing to health hazards associated with the release of chlorine.
Based on application, the market has been segmented into chemical industry, cosmetics & personal care, agriculture, food and beverage, medical, and others. Of them, food and beverage segment led the market in 2016 holding 54.8% share. Going forward, food and beverage is likely to display a CAGR of 4.6% between 2017 and 2025. On the other hand, the medical segment 16.7% of the global market in 2016; the medical segment is expected to display increased share in the upcoming years due to the need for alternative materials to be used for medical packaging applications. Cosmetic & personal care application segment is also likely to display an increased market share, predominantly due to the growth of cosmetic and personal care industry in emerging economies.
Asia Pacific to Continue to Remain Attractive
The key regions into which the global barrier resins market is divided based on geography are North America, Europe, Asia Pacific, Latin America, and the Middle East and Africa. North America, among all, held the leading share in the global barrier resins market in 2016. The high consumption of packaged food and growth of the medical industry are key factors behind the growth of North America barrier resins market.
Europe is also a key market due to high volume demand for barrier resins from food and beverage application segment.
Vis-à-vis volume, Asia Pacific led the global barrier resins market holding more than 55% share. Going forward too, the region is anticipated to account for significant revenue contribution.
Key players operating in the global barrier resins market include Kuraray Co. Ltd., The Dow Chemicals Company, E.l.DU PONT DE Nemours and Company, Asahi Kasei Corporation, Solvay S.A., Honeywell International Inc., Mitsubishi Gas Chemical Inc., INEO Group Ltd., and Invista among others.
Rising Inclination towards Packaged Food to Augment Barrier Resins Market Growth
The worldwide barrier resins market is relied upon to observe development on the rear of expanding inclination for bundled food over non-pressed food. The expanding wellbeing and cleanliness contemplations is driving buyers to select bundled food that is protected and is more averse to cause antagonistic impacts. In any case, bundled food that is moved over significant distances and is intended for later use should be kept from deterioration and hold newness too. Barrier resins are utilized to forestall loss of flavor and to forestall saturation of oxygen in eatables.
Arisen nations have high use of bundled food that significantly extended the premium for barrier resins market. Extended work life, higher tendency towards bundled food instead of new food has driven the market. Additionally, the increasing demand for therapeutic administrations has helped the barrier resins market to experience high advancement possibilities in the approaching years. North America is driving and furthermore followed by Europe for the worldwide barrier resins market. Also, creating economies are similarly showing high tendency towards packaged food, which will produce additional income for the barrier resins market in impending years.
Furthermore, the rise of fresher materials for barrier resins, for example, LDPE, HDPE, and LLDPE that are progressively taking over generally utilized materials, for example, PVDC because of wellbeing perils related with them is probably going to give development freedoms to barrier resins market later on. Also, high creation cost and long lead time are some different elements limiting this market over the recent years.
Developing nations have high use of bundled food that generously extended the premium for barrier resins market. Extended work life, higher tendency towards bundled food instead of new food has driven the market. Likewise, developing mindfulness for therapeutic administrations have helped the barrier resins market to experience high improvement possibilities in the approaching years. North America is driving and furthermore followed by Europe for the worldwide barrier resins market. Additionally, creating economies are moreover showing high tendency towards bundled food, which will produce additional income for the barrier resins market in impending years.
1. Preface
1.1. Report Scope and Market Segmentation
1.2. Research Highlights
1.3. Research Objectives
1.4. Key Questions Answered
2. Assumptions and Research Methodology
2.1. Report Assumptions
2.2. Abbreviations Used
2.3. Research Methodology
3. Executive Summary
3.1. Global Barrier Resins Market Size, by Market Value (US$ Bn) and Market Value Share, by Region
4. Market Overview
4.1. Product Overview
4.2. Key Industry Developments
4.3. Drivers and Restraints Snapshot Analysis
4.3.1. Drivers
4.3.1.1. Rise in demand for small size flexible packaging
4.3.1.2. Decrease in usage of PVC
4.3.2. Restraints
4.3.2.1. High production cost and long lead time
4.3.3. Opportunities
4.3.3.1. Rising awareness about consumption of high quality food products
4.3.3.2. Growing need to increase the shelf life of food products
4.4. Porter’s Analysis
4.5. Global Barrier Resins Market Analysis and Forecast
4.6. Value Chain Analysis
4.7. SWOT Analysis
5. Global Barrier Resins Market Analysis and Forecasts, By Material
5.1. Key Findings
5.2. Introduction
5.3. Global Barrier Resins Market Value Share Analysis, By Material
5.4. Market Size (Kilo Tons) (US$ Mn) Forecast By Material
5.4.1. Nylon
5.4.2. EVOH
5.4.3. PVDC
5.4.4. Others
5.5. Global Barrier Resins Market Analysis, by Material
5.6. Global Barrier Resins Market Attractiveness Analysis by Material
6. Global Barrier Resins Market Analysis and Forecasts, By Application
6.1. Key Findings
6.2. Introduction
6.3. Global Barrier Resins Market Value Share Analysis, by Application
6.4. Market Size (Kilo Tons) (US$ Mn) Forecast By Application
6.4.1. Chemical Industry
6.4.2. Cosmetics & Personal Care
6.4.3. Agriculture
6.4.4. Food and Beverage
6.4.5. Medical
6.4.6. Others
6.5. Global Barrier Resins Market Analysis, by Application
6.6. Global Barrier Resins Market Attractiveness Analysis By Application
7. Global Barrier Resins Market Analysis By Region
7.1. Global Barrier Resins Market Value Share Analysis, by Region
7.2. Market Size (Kilo Tons) (US$ Mn) Forecast By Region
7.3. Barrier Resins Market Attractiveness Analysis, By Region Type
8. North America Barrier Resins Market Analysis
8.1. Key Findings
8.2. North America Barrier Resins Market Overview
8.3. North America Market Value Share Analysis, By Material
8.4. North America Market Forecast By Material
8.4.1. Nylon
8.4.2. EVOH
8.4.3. PVDC
8.4.4. Others
8.5. North America Market Value Share Analysis, By Application
8.6. North America Market Forecast By Application Type
8.6.1. Chemical Industry
8.6.2. Cosmetics & Personal Care
8.6.3. Agriculture
8.6.4. Food & Beverage
8.6.5. Medical
8.6.6. Others
8.7. North America Market Value Share Analysis, By Country
8.8. North America Market Forecast By Country
8.8.1. U.S.
8.8.2. Canada
8.9. U.S. Market Forecast By Material
8.9.1. Nylon
8.9.2. EVOH
8.9.3. PVDC
8.9.4. Others
8.10. U.S. Market Forecast By Application Type
8.10.1. Chemical Industries
8.10.2. Cosmetics & Personal Care
8.10.3. Agriculture
8.10.4. Food and Beverage
8.10.5. Medical
8.10.6. Others
8.11. Canada Market Forecast By Material
8.11.1. Nylon
8.11.2. EVOH
8.11.3.PVDC
8.11.4.Others
8.12. Canada Market Forecast By Application Type
8.12.1. Chemical Industries
8.12.2. Cosmetics & Personal Care
8.12.3. Agriculture
8.12.4. Food and Beverage
8.12.5. Medical
8.12.6. Others
8.13. North America Market Attractiveness Analysis , By Material
8.14. North America Market Attractiveness Analysis, By Application
8.15. PEST Analysis
9. Europe Barrier Resins Market Analysis
9.1. Key Findings
9.2. Europe Barrier Resins Market Overview
9.3. Europe Market Value Share Analysis, By Material
9.4. Europe Market Forecast By Material
9.4.1. Nylon
9.4.2. EVOH
9.4.3. PVDC
9.4.4. Others
9.5. Europe Market Value Share Analysis, By Application
9.6. Europe Market Forecast By Application
9.6.1. Chemical Industries
9.6.2. Cosmetics and Personal Care
9.6.3. Agriculture
9.6.4. Food and Beverages
9.6.5. Medical
9.6.6. Others
9.7. Europe Market Value Share Analysis, By Country
9.8. Europe Market Forecast By Country
9.8.1. Germany
9.8.2. UK
9.8.3. France
9.8.4. Italy
9.8.5. Spain
9.8.6. Rest of Europe
9.9. Germany Market Forecast By Material
9.9.1. Nylon
9.9.2. EVOH
9.9.3. PVDC
9.9.4. Others
9.10. Germany Market Forecast By Application Type
9.10.1. Chemical Industries
9.10.2. Cosmetics and Personal Care
9.10.3. Agriculture
9.10.4. Food and Beverages
9.10.5. Medical
9.10.6. Others
9.11. UK Market Forecast By Material
9.11.1. Nylon
9.11.2. EVOH
9.11.3. PVDC
9.11.4. Others
9.12. UK Market Forecast By Application
9.12.1. Chemical Industries
9.12.2. Cosmetics and Personal Care
9.12.3. Agriculture
9.12.4. Food and Beverages
9.12.5. Medical
9.12.6. Others
9.13. France Market Forecast By Material
9.13.1. Nylon
9.13.2. EVOH
9.13.3. PVDC
9.13.4. Others
9.14. France Market Forecast By Application Type
9.14.1. Chemical Industries
9.14.2. Cosmetics and Personal Care
9.14.3. Agriculture
9.14.4. Food and Beverages
9.14.5. Medical
9.14.6. Others
9.15. Italy Market Forecast By Material
9.15.1. Nylon
9.15.2. EVOH
9.15.3. PVDC
9.15.4. Others
9.16. Italy Market Forecast By Application Type
9.16.1. Chemical Industries
9.16.2. Cosmetics and Personal Care
9.16.3. Agriculture
9.16.4. Food and Beverages
9.16.5. Medical
9.16.6. Others
9.17. Spain Market Forecast By Material
9.17.1. Nylon
9.17.2. EVOH
9.17.3. PVDC
9.17.4. Others
9.18. Spain Market Forecast By Application Type
9.18.1. Chemical Industries
9.18.2. Cosmetics and Personal Care
9.18.3. Agriculture
9.18.4. Food and Beverages
9.18.5. Medical
9.18.6. Others
9.19. Rest of Europe Market Forecast By Material
9.19.1. Nylon
9.19.2. EVOH
9.19.3. PVDC
9.19.4. Others
9.20. Rest Of Europe Market Forecast By Application Type
9.20.1 Chemicals Industry
9.20.2. Cosmetics and Personal Care
9.20.3. Agriculture
9.20.4. Food and Beverages
9.20.5. Medical
9.20.6. Others
9.21. Europe Market Attractiveness Analysis, By Material
9.22. Europe Market Attractiveness Analysis, By Applications
9.23. PEST Analysis
10. Asia Pacific Barrier Resins Market Analysis
10.1. Key Findings
10.2. Asia Pacific Barrier Resins Market Overview
10.3. Asia Pacific Market Value Share Analysis, By Material
10.4. Asia Pacific Market Forecast By Material
10.4.1 Nylon
10.4.2. EVOH
10.4.3. PVDC
10.4.4. Others
10.5. Asia Pacific Market Value Share Analysis, By Application
10.6. Asia Pacific Market Forecast By Application Type
10.6.1 Chemicals Industry
10.6.2. Cosmetics and Personal Care
10.6.3. Agriculture
10.6.4. Food and Beverages
10.6.5. Medical
10.6.6. Others
10.7. Asia Pacific Market Value Share Analysis, By Country
10.8. Asia Pacific Market Forecast By Country
10.8.1. China
10.8.2. India
10.8.3. Japan
10.8.4. ASEAN
10.8.5. Rest of Asia Pacific
10.9. China Market Forecast By Material
10.9.1 Nylon
10.9.2. EVOH
10.9.3. PVDC
10.9.4. Others
10.10. China Market Forecast By Application Type
10.10.1 Chemicals Industry
10.10.2. Cosmetics and Personal Care
10.10.3. Agriculture
10.10.4. Food and Beverages
10.10.5. Medical
10.10.6. Others
10.11. India Market Forecast By Material
10.11.1. Nylon
10.11.2. EVOH
10.11.3.. PVDC
10.11.4. Others
10.12. India Market Forecast By Application
10.12.1 Chemicals Industry
10.12.2. Cosmetics and Personal Care
10.12.3. Agriculture
10.12.4. Food and Beverages
10.12.5. Medical
10.12.6. Others
10.13. Japan Market Forecast By Material
10.13.1. Nylon
10.13.2. EVOH
10.13.3.. PVDC
10.13.4. Others
10.14. Japan Market Forecast By Application
10.14.1. Chemical Industries
10.14.2. Cosmetics and Personal Care
10.14.3. Agriculture
10.14.4. Food and Beverages
10.14.5. Medical
10.14.6. Others
10.15. ASEAN Market Forecast By Material
10.15.1. Nylon
10.15.2. EVOH
10.15.3.. PVDC
10.15.4. Others
10.16. ASEAN Market Forecast By Application
10.16.1. Chemical Industries
10.16.2. Cosmetics and Personal Care
10.16.3. Agriculture
10.16.4. Food and Beverages
10.16.5. Medical
10.16.6. Others
10.17. Rest of Asia Pacific Market Forecast By Material
10.17.1. Nylon
10.17.2. EVOH
10.17.3.. PVDC
10.17.4. Others
10.18. Rest of Asia Pacific Market Forecast By Application
10.18.1. Chemical Industries
10.18.1. Chemical Industries
10.18.2. Cosmetics and Personal Care
10.18.3. Agriculture
10.18.4. Food and Beverages
10.18.5. Medical
10.18.6. Others
10.19. Asia Pacific Barrier Resins Market Attractiveness Analysis, By Material
10.20. Asia Pacific Barrier Resins Market Attractiveness Analysis, By Application
10.21. PEST Analysis
11. Middle East and Africa (MEA) Barrier Resins Market Analysis
11.1. Key Findings
11.2. Middle East and Africa Barrier Resins Market Overview
11.3. Middle East and Africa Market Value Share Analysis, By Material
11.4. Middle East and Africa Market Forecast By Material
11.4.1. Nylon
11.4.2. EVOH
11.4.3. PVDC
11.4.4. Others
11.5. Middle East and Africa Market Value Share Analysis, By Application
11.6. Middle East and Africa Market Forecast By Application
11.6.1. Chemical Industries
11.6.2. Cosmetics and Personal Care
11.6.3. Agriculture
11.6.4. Food and Beverages
11.6.5. Medical
11.6.6. Others
11.7. Middle East and Africa Market Value Share Analysis, By Country
11.8. Middle East and Africa Market Forecast By Country
11.8.1. GCC
11.8.2. South Africa
11.8.3. Rest of Middle East & Africa
11.9. GCC Market Forecast By Material
11.9..1. Nylon
11.9..2. EVOH
11.9..3.. PVDC
11.9..4. Others
11.10. GCC Market Forecast By Application Type
11.10.1. Chemical Industries
11.10.2. Cosmetics and Personal Care
11.10..3. Agriculture
11.10..4. Food and Beverages
11.10.5. Medical
11.10.6. Others
11.11. South Africa Market Forecast By Material
11.11.1. Nylon
11.11.2. EVOH
11.11.3.. PVDC
11.11.4 Others
11.12. South Africa Market Forecast By Application Type
11.12.1. Chemical Industries
11.12.2. Cosmetics and Personal Care
11.12..3. Agriculture
11.12..4. Food and Beverages
11.12.5. Medical
11.12.6. Others
11.13. Rest of Middle East & Africa Market Forecast By Product
11.13.1. Nylon
11.13.2. EVOH
11.13.3. PVDC
11.13.4.. Others
11.14. Rest of Middle East & Africa Market Forecast By Application Type
11.14.1. Chemical Industries
11.14.2. Cosmetics and Personal Care
11.14.3. Agriculture
11.14.4. Food and Beverages
11.14.5. Medical
11.14.6. Others
11.15. Middle East and Africa Market Attractiveness Analysis, By Material
11.16. Middle East and Africa Market Attractiveness Analysis, By Application
11.17. PEST Analysis
12. Latin America Barrier Resins Market Analysis
12.1. Key Findings
12.2. Latin America Barrier Resins Market Overview
12.3. Latin America Market Value Share Analysis, By Material
12.4. Latin America Market Forecast By Material
12.4.1. Nylon
12.4.2. EVOH
12.4.3. PVDC
12.4.4. Others
12.5. Latin America Market Value Share Analysis, By Application
12.6. Latin America Market Forecast By Application
12.6.1. Chemical Industries
12.6.2. Cosmetics and Personal Care
12.6.3. Agriculture
12.6.4. Food and Beverages
12.6.5. Medical
12.6.6. Others
12.7. Latin America Market Value Share Analysis, By Country
12.8. Latin America Market Forecast By Country
12.8.1. Brazil
12.8.2. Mexico
12.8.3. Rest of Latin America
12.9. Brazil Market Forecast By Material
12.9.1. Nylon
12.9.2. EVOH
12.9.3. PVDC
12.9.4. Others
12.10. Brazil Market Forecast By Application
12.10.1. Chemical Industries
12.10.2. Cosmetics and Personal Care
12.10.3. Agriculture
12.10.4. Food and Beverages
12.10.5. Medical
12.10.6. Others
12.11. Mexico Market Forecast By Material
12.11.1. Nylon
12.11.2. EVOH
12.11.3. PVDC
12.11.4 Others
12.12. Mexico Market Forecast By Application
12.12.1. Chemical Industries
12.12.2. Cosmetics and Personal Care
12.12.3. Agriculture
12.12.4. Food and Beverages
12.12.5. Medical
12.12.6. Others
12.13. Rest of Latin America Market Forecast By Product
12.13.1. Nylon
12.13.2. EVOH
12.13.3. PVDC
12.13.4. Others
12.14. Rest of Latin America Market Forecast By Application
12.14.1. Chemical Industries
12.14.2. Cosmetics & Personal Care
12.14.3. Cosmetics & Pharmaceuticals
12.14.3. Agriculture
12.14.4. Food and Beverages
12.14.5. Medical
12.14.6. Others
12.15. Latin America Market Attractiveness Analysis, By Material
12.16. Latin America Market Attractiveness Analysis, By Application
12.17. PEST Analysis
13. Competition Landscape
13.1. Competition Matrix
13.2. Company Profiles: Key Players
13.2.1. Kuraray Co., Ltd.
13.2.1.1. Company Overview
13.2.1.2. Financial Overview
13.2.1.3. Business Strategy
13.2.1.4. Recent Developments
13.2.2. The Dow Chemicals Company
13.2.2.1. Company Overview
13.2.2.2. Financial Overview
13.2.2.3. Business Strategy
13.2.2.4. Recent Developments
13.2.3. E. I. DU PONT DE NEMOURS AND COMPANY
13.2.3.1. Company Overview
13.2.3.2. Financial Overview
13.2.3.3. Business Strategy
13.2.3.4. Recent Developments
13.2.4. Asahi Kasei Corporation
13.2.4.1. Company Overview
13.2.4.2. Financial Overview
13.2.4.3. Business Strategy
13.2.4.4. Recent Developments
13.2.5. Solvay S.A.
13.2.5.1. Company Overview
13.2.5.2. Financial Overview
13.2.5.3. Business Strategy
13.2.5.4. Recent Developments
13.2.6. Honeywell International Inc.
13.2.6.1. Company Overview
13.2.6.2. Financial Overview
13.2.6.3. Business Strategy
13.2.6.4. Recent Developments
13.2.7. Mitsubishi Gas Chemical, Inc.
13.2.7.1. Company Overview
13.2.7.2. Financial Overview
13.2.7.3. Business Strategy
13.2.7.4. Recent Developments
13.2.8. INEOS Group Ltd.
13.2.8.1. Company Overview
13.2.8.2. Financial Overview
13.2.8.3. Business Strategy
13.2.8.4. Recent Developments
13.2.9. INVISTA
13.2.9.1. Company Overview
13.2.9.2. Recent Developments
List of Figure
Figure 1: Global Barrier Resins Market Snapshot
Figure 2: Global Barrier Resins Market Size (US$ Mn) and Volume (Kilo Tons) Forecast, 2016–2025
Figure 3: Global Barrier Resins Market Size (US$ Mn) Forecast, 2016–2025
Figure 4: Global Barrier Resins Market, Y-o-Y Growth (%), 2016–2025
Figure 5: Global Barrier Resins Market Value Share Analysis, by Material, 2016 and 2025
Figure 6: Global Nylon Segment Volume (Kilo Tons) Value (US$ Mn) Forecast, 2016–2025
Figure 7: Global EVOH Segment Volume (Kilo Tons) Value (US$ Mn) Forecast, 2016–2025
Figure 8: Global PVDC Segment Volume (Kilo Tons) Value (US$ Mn) Forecast, 2016–2025
Figure 9: Global Others Segment Volume (Kilo Tons) Value (US$ Mn) Forecast, 2016–2025
Figure 10: Global Barrier Resins Market Attractiveness Analysis, by Material
Figure 11: Global Barrier Resins Market Value Share Analysis, by Application, 2016 and 2025
Figure 12: Global Chemical Segment, by Volume (Kilo Tons) & Value (US$ Mn) Forecast 2016–2025
Figure 13: Global Cosmetics & Personal Care Segment, by Volume (Kilo Tons) & Value (US$ Mn) Forecast 2016–2025
Figure 14: Global Agriculture Segment, by Volume (Kilo Tons) & Value (US$ Mn) Forecast 2016–2025
Figure 15: Global Food & Beverage Segment, by Volume (Kilo Tons) & Value (US$ Mn) Forecast 2016–2025
Figure 16: Global Medical Segment, by Volume (Kilo Tons) & Value (US$ Mn) Forecast 2016–2025
Figure 17: Global Others Segment, by Volume (Kilo Tons) & Value (US$ Mn) Forecast 2016–2025
Figure 18: Global Barrier Resins Market Attractiveness Analysis, by Applications
Figure 19: Global Barrier Resins Market Value Share Analysis, by Region, 2016 and 2025
Figure 20: Global Barrier Resins Market Attractiveness Analysis, by Applications
Figure 21: North America Barrier Resins Market Size (US$ Mn) and Volume (Kilo Tons) Forecast, 2016–2025
Figure 22: North America Barrier Resins Market Attractiveness Analysis, by Country
Figure 23: North America Barrier Resins Market Value Share Analysis, by Material, 2016 and 2025
Figure 24: North America Barrier Resins Market Value Share Analysis, by Application, 2016 and 2025
Figure 25: North America Barrier Resins Market Value Share Analysis, by Country, 2016 and 2025
Figure 26: Market Attractiveness Analysis , By Material
Figure 27: Market Attractiveness Analysis, By Application
Figure 28: North America Barrier Resins Market Attractiveness Analysis, by Material
Figure 29: North America Barrier Resins Market Attractiveness Analysis, by Application
Figure 30: Europe Barrier Resins Market Size (US$ Mn) and Volume (Kilo Tons) Forecast, 2016–2025
Figure 31: Europe Barrier Resins Market Attractiveness Analysis, by Country and Sub-region
Figure 32: Europe Barrier Resins Market Value Share Analysis, by Material, 2016 and 2025
Figure 33: Europe Barrier Resins Market Value Share Analysis, by Application, 2016 and 2025
Figure 34: Europe Barrier Resins Market Value Share Analysis, by Country and Sub-region, 2016 and 2025
Figure 35: Europe Barrier Resins Market Attractiveness Analysis, by Material
Figure 36: Europe Barrier Resins Market Attractiveness Analysis, by Application
Figure 37: Asia Pacific Barrier Resins Market Size (US$ Mn) and Volume (Kilo Tons) Forecast, 2016–2025
Figure 38: Asia Pacific Barrier Resins Market Attractiveness Analysis, by Country and Sub-regions
Figure 39: Asia Pacific Barrier Resins Market Value Share Analysis, by Material, 2016 and 2025
Figure 40: Asia Pacific Barrier Resins Market Value Share Analysis, by Application, 2016 and 2025
Figure 41: Asia Pacific Barrier Resins Market Value Share Analysis, by Country and Sub-regions, 2016 and 2025
Figure 42: Asia Pacific Barrier Resins Market Attractiveness Analysis, by Material
Figure 43: Asia Pacific Barrier Resins Market Attractiveness Analysis, by Application
Figure 44: Middle East & Africa Barrier Resins Market Size (US$ Mn) and Volume (Kilo Tons) Forecast, 2016–2025
Figure 45: Middle East & Africa Barrier Resins Market Attractiveness Analysis, by Country and Sub-regions
Figure 46: Middle East & Africa Barrier Resins Market Value Share Analysis, by Material, 2016 and 2025
Figure 47: Middle East & Africa Barrier Resins Market Value Share Analysis, by Application, 2016 and 2025
Figure 48 :Middle East & Africa Barrier Resins Market Value Share Analysis, by Country and Sub-regions, 2016 and 2025
Figure 49: Middle East and Africa Barrier Resins Market Attractiveness Analysis, by Material
Figure 50: Middle East & Africa Barrier Resins Market Attractiveness Analysis, by Application
Figure 51: Latin America Barrier Resins Market Size (US$ Mn) and Volume (Kilo Tons) Forecast, 2016–2025
Figure 52: Latin America Barrier Resins Market Attractiveness Analysis, by Country and Sub-regions
Figure 53: Latin America Barrier Resins Market Value Share Analysis, by Material, 2016 and 2025
Figure 54: Latin America Barrier Resins Market Value Share Analysis, by Application, 2016 and 2025
Figure 55: Latin America Barrier Resins Market Value Share Analysis, by Country and Sub-regions, 2016 and 2025
Figure 56: Latin America Barrier Resins Market Attractiveness Analysis, by Material
Figure 57: Latin America Barrier Resins Market Attractiveness Analysis, by Application
Figure 58: Competition Matrix (1/2)
Figure 59: Competition Matrix (2/2)
Copyright © Transparency Market Research, Inc. All Rights reserved
Trust Online

Barrier Resins Market