
Reports
Reports
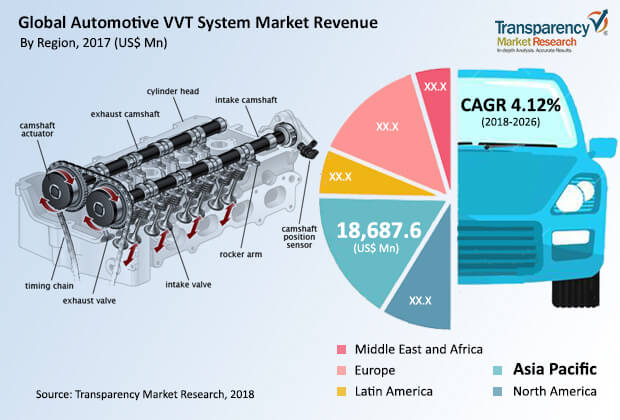
An automotive VVT system helps prolong engine life, as it adeptly improves performance, fuel economy, or emissions. Automotive VVT systems enhance combustion, enrich engine process, improve engine power, reduce fuel consumption, and reduce emissions. They help improve the emission regulator system and minimize ignition glitches in the spark plug, which are likely to lead to serious drivability issues. The VVT system also allows the usage of a smaller engine to achieve the same performance. These factors are expected to drive the demand for automotive VVT systems considerably during the forecast period. The components used in an automotive VVT system include timing solenoid, timing belt, timing idler/pulley, ECU, CAM, and actuators.
Emission from automobiles accounts for 28% of the overall greenhouse gases produced including carbon dioxide and methane, which hamper the environment. This hampered environment affects the health of human beings by propagating respiratory disorders. Regulatory bodies are enacting stringent norms on carbon emissions of automotive to reduce curb such situations and carbon emission. The VVT system helps change the valve timing according to the IC engine cycle. This lead to lowered carbon emission. This, in turn, is anticipated to boost the automotive VVT system market. Engine life is likely to improve due to a VVT system, as it helps maintain the proper cycle of the engine. Expansion of the global automotive VVT system market can be attributable toward the rapid expansion of the automotive industry, rise sales of passenger and commercial vehicles as well as increase in purchasing power of consumers.
Rise in the emission of polluted gases, such as methane, increases the carbon footprint from the transportation sector, which has led to the development of battery electric vehicles. This in turn is estimated to restrain the IC engine vehicles market during forecast period. The function of the VVT system is directly related to the IC engine of the vehicle and any impact on the IC engine is likely to hamper the automotive VVT system market. The automotive VVT system market in some regions is expanding at a moderate pace, owing to minimal usage of VVT system in battery electrical vehicles. This, in turn is expected to hamper the demand for VVT systems.
However, maintenance of components of the VVT system, as it is incorporated in the heat affected zone, and introduction of battery electric vehicles in certain regions are restraining factors that are anticipated to hamper the automotive VVT system market during the forecast period. The global automotive VVT system market is anticipated to expand at a CAGR of more than 4% between 2018 and 2026.
Double Over Head Cam (DOHC) valve train design for the VVT system enables a wider angle between intake valve and exhaust valve as compared to the Single Over Head Cam (SOHC), and Over Head Valve (OHV). Consequently, the DOHC VVT system holds a larger share as compared to other valve train designs. This provides a limited airflow at higher engine speeds. The gasoline fuel segment is anticipated to dominate the market by the end of forecast period. This is primarily due to its major application in the passenger and light duty vehicles. The continuous VVT system is anticipated to dominate the market, as the system offers continuous modification of the valve timing. Rising pollution levels, increasing concerns about human health, and impending necessity for efficient cars to curb carbon footprint are projected to boost the demand for these VVT systems.
In 2017, Asia Pacific held a noticeable share of the global automotive VVT systems market. Recent increase in production and demand of vehicles in counties of Latin America is anticipated to boost the market in the region at a significant growth rate in the near future. Latin America is expected to witness lower penetration of battery electric vehicles, as adoption of BEVs is not prominent in the region. The economic dynamos in Asia Pacific such as China, Japan, and South Korea are focusing more on the adoption of battery electric vehicles and are expected to witness restrained growth of VVT system, as battery electrical vehicles are expected to hamper the market of automotive VVT systems. However, Asia Pacific witnesses a considerable demand for VVT systems from the developing countries in South Asia and ASEAN. Decline in car loan interest rates, availability of customized financial schemes, and increase in per capita income of consumers are some factors that are boosting the production of passenger vehicles, which in turn is anticipated to drive the automotive VVT systems market in the region during forecast period.
The automotive VVT system market witnesses the presence of a few major players, as manufacturing of VVT systems is a complicated and expensive affair. Numerous regional players manufacture the components required for the VVT system. These players dominated the market for particular application and aftermarket segments. Major players operating in the global automotive VVT system market include Johnson Controls, Inc., Mikuni American Corporation, Aisin Seiki Co. Ltd., Camcraft, Inc., Federal-Mogul LLC, Eaton Corporation, Hitachi Automotive Systems, Mitsubishi Electric Corporation, Robert Bosch GmbH, DENSO Corporation, Schaeffler AG, Honda Motor Co., Ltd., BorgWarner Inc., and Toyota Motor Corporation. Strategic players are focusing more on mergers and acquisitions with regional players, which provide different components required to fabricate the VVT system in order to develop their businesses. Several key players emphasize more on R&D in order to improve functionality and efficiency of the VVT system.
Automotive VVT System Market to Gain Momentum Owing to Rising Level of Vehicular Pollution Worldwide
The increasing number of automobile production and the rise in the level of pollution levels with release of harmful greenhouse gases into the environment is a prime factor contributing to the growth of the global automotive VVT System Market. An automotive VVT system drags out motor life, as it skillfully improves execution, efficiency, or discharges. Automotive VVT systems upgrade burning, enhance motor cycle, improve motor force, decrease fuel utilization, and diminish discharges. They help improve the emanation controller system and limit start glitches in the sparkle plug, which are probably going to prompt genuine drivability issues. The VVT system additionally permits the use of a more modest motor to accomplish a similar presentation. These components are required to drive the interest for automotive VVT systems impressively in the coming years.
The variable valve timing (VVT) system has gotten ordinary in automotive assembling. Automotive VVT system improves mileage and execution of vehicles. The have become a critical component to control emanation system, including improving the activity of flash fittings. Advances in IC motor cycles have additionally improved the activity of automotive VVT systems. The broad interest in automotive VVT system market originates from severe execution of vehicle discharge standards worldwide throughout the long term. The ascent being used of these in traveler and business vehicles is the key main thrust for the deals on the lookout.
Discharge from cars represents 28% of the general ozone depleting substances including methane and carbon dioxide that causes major hindrances to the climate. This hampered climate influences the soundness of people by proliferating respiratory issues. Administrative bodies are authorizing tough standards on fossil fuel byproducts of automotive to diminish control such circumstances and fossil fuel byproduct. The VVT system helps to adjust the valve timing as per the IC motor cycle, thereby lowering the level of carbon emission, ultimately promoting the automotive VVT system market. Motor life is probably going to improve because of a VVT system, as it keeps up the legitimate pattern of the motor.
1. Preface
1.1. Market Definition and Scope
1.2. Market Segmentation
1.3. Key Research Objectives
1.4. Research Highlights
2. Assumptions and Research Methodology
3. Executive Summary : Global Automotive VVT System Market
3.1. Global Automotive VVT System Market Size, Units, US$ Mn, 2017–2026
4. Market Overview
4.1. Introduction
4.1.1. Automotive VVT System Market Definition
4.1.2. Technology Roadmap
4.2. Key Market Indicators
4.3. Market Dynamics
4.3.1. Drivers
4.3.2. Restraints
4.3.3. Opportunity
4.4. Porter’s Five Force Analysis
4.5. Value Chain Analysis
4.5.1. List of Key Manufacturers
4.5.2. List of Customers
4.5.3. Level of Integration
4.6. SWOT Analysis
5. Global Emission Regulation Analysis
6. Battery Electric Vehicle Impact
7. Price Trend Analysis
8. Global Automotive VVT System Market Analysis and Forecasts, by Fuel Type
8.1. Introduction & Definition
8.2. Key Findings
8.3. Market Size (Units) (US$ Mn) Forecast, by Fuel Type, 2017–2026
8.3.1. Gasoline
8.3.2. Diesel
8.4. Fuel Type Comparison Matrix
8.5. Market Attractiveness, by Fuel Type
9. Global Automotive VVT System Market Analysis and Forecasts, by Methods
9.1. Introduction & Definition
9.2. Key Findings
9.3. Market Size (Units) (US$ Mn) Forecast, by Methods, 2017–2026
9.3.1. Cam Phasing
9.3.2. Cam Changing
9.3.3. Cam Phasing + Changing
9.3.4. Variable Valve Actuation
9.4. Advance Driver Assist Segment Comparison Matrix
9.5. Market Attractiveness By Method
10. Global Automotive VVT System Market Analysis and Forecasts, by Technology
10.1. Introduction & Definition
10.2. Key Findings
10.3. Market Size (Units) (US$ Mn) Forecast, by Technology, 2017–2026
10.3.1. VVT-i
10.3.2. Dual VVT-i
10.3.3. VVT-iE
10.3.4. VVT-iW
10.4. By Technology Comparison Matrix
10.5. Market Attractiveness, by Technology
11. Global Automotive VVT System Market Analysis and Forecasts, by Number of Valves
11.1. Introduction & Definition
11.2. Key Findings
11.3. Market Size (Units) (US$ Mn) Forecast, by Number of Valves, 2017–2026
11.3.1. Less Than 12
11.3.2. 16
11.3.3. Between 17 to 23
11.3.4. More than 24
11.4. Number of Valves Comparison Matrix
11.5. Market Attractiveness, by Number of Valves
12. Global Automotive VVT System Market Analysis and Forecast, by System
12.1. Introduction & Definition
12.2. Key Findings
12.3. Market Size (Units) (US$ Mn) Forecast, by System, 2017–2026
12.3.1. Discrete
12.3.2. Continuous
12.4. Number of Valves Comparison Matrix
12.5. Market Attractiveness, by System
13. Global Automotive VVT System Market Analysis and Forecasts, by Valve Actuation Type
13.1. Introduction & Definition
13.2. Key Findings
13.3. Market Size (Units) (US$ Mn) Forecast, by Valve Actuation Type, 2017–2026
13.3.1. Type I
13.3.2. Type II
13.3.3. Type III
13.3.4. Type IV
13.3.5. Type V
13.4. Valve Actuation Comparison Matrix
13.5. Market Attractiveness, by Valve Actuation Type
14. Global Automotive VVT System Market Analysis and Forecast, by Valve Train
14.1. Introduction & Definition
14.2. Key Findings
14.3. Market Size (Units) (US$ Mn) Forecast, by Valve Train, 2017–2026
14.3.1. Single Overhead Cam (SOHC)
14.3.2. Double Overhead Cam (DOHC)
14.3.3. Over Head Valve (OHV)
14.4. Valve Train Comparison Matrix
14.5. Market Attractiveness, by Valve Train
15. Global Automotive VVT System Market Analysis and Forecast, by Sales Channel
15.1. Introduction & Definition
15.2. Key Findings
15.3. Market Size (Units) (US$ Mn) Forecast, by Sales Channel, 2017–2026
15.3.1. OEM
15.3.2. Aftermarket
15.4. Sales Channel Comparison Matrix
15.5. Market Attractiveness, by Sales Channel
16. Global Automotive VVT System Market Analysis and Forecasts, by Vehicle Type
16.1. Introduction & Definition
16.2. Key Findings
16.3. Market Size (Units) (US$ Mn) Forecast, by Vehicle Type, 2017–2026
16.3.1. Passenger Vehicle
16.3.2. Commercial Vehicle
16.3.2.1. LCV
16.3.2.2. HCV
16.3.3. Electric Vehicle
16.3.3.1. HEV
16.3.3.2. PHEV
16.4. Vehicle Type Comparison Matrix
16.5. Market Attractiveness, By Vehicle Type
17. Global Automotive VVT System Market Analysis and Forecast, by Region
17.1. Key Findings
17.2. Market Size (Units) (US$ Mn) Forecast, by Region, 2017–2026
17.2.1. North America
17.2.2. Latin America
17.2.3. Europe
17.2.4. Asia Pacific
17.2.5. Middle East & Africa
17.3. Market Attractiveness, by Region
18. North America Automotive VVT System Market Size and Forecast (Units) (US$ Mn), 2017–2026
18.1. Key Findings
18.2. North America Market, by Fuel Type
18.2.1. Gasoline
18.2.2. Diesel
18.3. North America Market, by Methods
18.3.1. Cam Phasing
18.3.2. Cam Changing
18.3.3. Cam Phasing + Changing
18.3.4. Variable Valve Actuation
18.4. North America Market, by Technology
18.4.1. VVT-i
18.4.2. Dual VVT-i
18.4.3. VVT-iE
18.4.4. VVT-iW
18.5. North America Market, by Number of Valves
18.5.1. Less Than 12
18.5.2. 16
18.5.3. Between 17 to 23
18.5.4. More than 24
18.6. North America Market, by System
18.6.1. Discrete
18.6.2. Continuous
18.7. North America Market, by Valve Actuation
18.7.1. Type I
18.7.2. Type II
18.7.3. Type III
18.7.4. Type IV
18.7.5. Type V
18.8. North America Market, by Valve Train
18.8.1. Single Overhead Cam (SOHC)
18.8.2. Double Overhead Cam (DOHC)
18.8.3. Over Head Valve (OHV)
18.9. North America Market, by Sales Channel
18.9.1. OEM
18.9.2. Aftermarket
18.10. North America Market, by Vehicle Type
18.10.1. Passenger Vehicle
18.10.2. Commercial Vehicle
18.10.2.1. LCV
18.10.2.2. HCV
18.10.3. Electric Vehicle
18.10.3.1. HEV
18.10.3.2. PHEV
18.11. U.S. Market Size & Forecast, by Fuel Type
18.11.1. Gasoline
18.11.2. Diesel
18.12. U.S. Market Size & Forecast, by Method
18.12.1. Cam Phasing
18.12.2. Cam Changing
18.12.3. Cam Phasing + Changing
18.12.4. Variable Valve Actuation
18.13. U.S. Market Size & Forecast, By Technology
18.13.1. VVT-i
18.13.2. Dual VVT-i
18.13.3. VVT-iE
18.13.4. VVT-iW
18.14. U.S. Market Size & Forecast, by Valve Train
18.14.1. Less Than 12
18.14.2. 16
18.14.3. Between 17 to 23
18.14.4. More than 24
18.15. U.S. Market, by System
18.15.1. Discrete
18.15.2. Continuous
18.16. U.S. Market Size & Forecast, by Valve Actuation
18.16.1. Type I
18.16.2. Type II
18.16.3. Type III
18.16.4. Type IV
18.16.5. Type V
18.17. U.S. Market, by Valve Train
18.17.1. Single Overhead Cam (SOHC)
18.17.2. Double Overhead Cam (DOHC)
18.17.3. Over Head Valve (OHV)
18.18. U.S. Market Size & Forecast, by Sales Channel
18.18.1. OEM
18.18.2. Aftermarket
18.19. U.S. Market Size & Forecast, by Vehicle Type
18.19.1. Passenger Vehicle
18.19.2. Commercial Vehicle
18.19.2.1. LCV
18.19.2.2. HCV
18.19.3. Electric Vehicle
18.19.3.1. HEV
18.19.3.2. PHEV
18.20. Canada Market Size & Forecast, by Fuel Type
18.20.1. Gasoline
18.20.2. Diesel
18.21. Canada Market Size & Forecast, by Method
18.21.1. Cam Phasing
18.21.2. Cam Changing
18.21.3. Cam Phasing + Changing
18.21.4. Variable Valve Actuation
18.22. Canada Market Size & Forecast, by Technology
18.22.1. VVT-i
18.22.2. Dual VVT-i
18.22.3. VVT-iE
18.22.4. VVT-iW
18.23. Canada Market Size & Forecast, by Number of Valves
18.23.1. Less Than 12
18.23.2. 16
18.23.3. Between 17 to 23
18.23.4. More than 24
18.24. Canada Market, by System
18.24.1. Discrete
18.24.2. Continuous
18.25. Canada Market Size & Forecast, by Valve Actuation
18.25.1. Type I
18.25.2. Type II
18.25.3. Type III
18.25.4. Type IV
18.25.5. Type V
18.26. Canada Market, by Valve Train
18.26.1. Single Overhead Cam (SOHC)
18.26.2. Double Overhead Cam (DOHC)
18.26.3. Over Head Valve (OHV)
18.27. Canada Market Size & Forecast, by Sales Channel
18.27.1. OEM
18.27.2. Aftermarket
18.28. Canada Market Size & Forecast, by Vehicle Type
18.28.1. Passenger Vehicle
18.28.2. Commercial Vehicle
18.28.2.1. LCV
18.28.2.2. HCV
18.28.3. Electric Vehicle
18.28.3.1. HEV
18.28.3.2. PHEV
18.29. Comparison Matrix
18.29.1. By Fuel Type
18.29.2. By Methods
18.29.3. By Technology
18.29.4. By Valve Train
18.29.5. By Number of Valves
18.29.6. By System
18.29.7. By Valve Actuation Type
18.29.8. By Sales Channel
18.29.9. By Vehicle
18.30. PEST Analysis
19. Latin America Automotive VVT System Market Size and Forecast (Units) (US$ Mn), 2017–2026
19.1. Key Findings
19.2. Latin America Market, by Fuel Type
19.2.1. Gasoline
19.2.2. Diesel
19.3. Latin America Market, by Method
19.3.1. Cam Phasing
19.3.2. Cam Changing
19.3.3. Cam Phasing + Changing
19.3.4. Variable Valve Actuation
19.4. Latin America Market Size & Forecast, by Technology
19.4.1. VVT-i
19.4.2. Dual VVT-i
19.4.3. VVT-iE
19.4.4. VVT-iW
19.5. Latin America Market, by Number of Valves
19.5.1. Less Than 12
19.5.2. 16
19.5.3. Between 17 to 23
19.5.4. More than 24
19.6. Latin America Market, by System
19.6.1. Discrete
19.6.2. Continuous
19.7. Latin America Market, by Valve Actuation
19.7.1. Type I
19.7.2. Type II
19.7.3. Type III
19.7.4. Type IV
19.7.5. Type V
19.8. Latin America Market, by Valve Train
19.8.1. Single Overhead Cam (SOHC)
19.8.2. Double Overhead Cam (DOHC)
19.8.3. Over Head Valve (OHV)
19.9. Latin America Market, by Sales Channel
19.9.1. OEM
19.9.2. Aftermarket
19.10. Latin America Market, by Vehicle Type
19.10.1. Passenger Vehicle
19.10.2. Commercial Vehicle
19.10.2.1. LCV
19.10.2.2. HCV
19.10.3. Electric Vehicle
19.10.3.1. HEV
19.10.3.2. PHEV
19.11. Brazil Market Size & Forecast, by Fuel Type
19.11.1. Gasoline
19.11.2. Diesel
19.12. Brazil Market Size & Forecast, by Method
19.12.1. Cam Phasing
19.12.2. Cam Changing
19.12.3. Cam Phasing + Changing
19.12.4. Variable Valve Actuation
19.13. Brazil Market Size & Forecast, by Technology
19.13.1. VVT-i
19.13.2. Dual VVT-i
19.13.3. VVT-iE
19.13.4. VVT-iW
19.14. Brazil Market Size & Forecast, by Valve Train
19.14.1. Less Than 12
19.14.2. 16
19.14.3. Between 17 to 23
19.14.4. More than 24
19.15. Brazil Market, by System
19.15.1. Discrete
19.15.2. Continuous
19.16. Brazil Market Size & Forecast, by Valve Actuation
19.16.1. Type I
19.16.2. Type II
19.16.3. Type III
19.16.4. Type IV
19.16.5. Type V
19.17. Brazil, by Valve Train
19.17.1. Single Overhead Cam (SOHC)
19.17.2. Double Overhead Cam (DOHC)
19.17.3. Over Head Valve (OHV)
19.18. Brazil Market Size & Forecast, by Sales Channel
19.18.1. OEM
19.18.2. Aftermarket
19.19. Brazil Market Size & Forecast, by Vehicle Type
19.19.1. Passenger Vehicle
19.19.2. Commercial Vehicle
19.19.2.1. LCV
19.19.2.2. HCV
19.19.3. Electric Vehicle
19.19.3.1. HEV
19.19.3.2. PHEV
19.20. Mexico Market Size & Forecast, by Fuel Type
19.20.1. Gasoline
19.20.2. Diesel
19.21. Mexico Market Size & Forecast, by Method
19.21.1. Cam Phasing
19.21.2. Cam Changing
19.21.3. Cam Phasing + Changing
19.21.4. Variable Valve Actuation
19.22. Mexico Market Size & Forecast, by Technology
19.22.1. VVT-i
19.22.2. Dual VVT-i
19.22.3. VVT-iE
19.22.4. VVT-iW
19.23. Mexico Market Size & Forecast, by Number of Valves
19.23.1. Less Than 12
19.23.2. 16
19.23.3. Between 17 to 23
19.23.4. More than 24
19.24. Mexico Market, by System
19.24.1. Discrete
19.24.2. Continuous
19.25. Mexico Market Size & Forecast, by Valve Actuation
19.25.1. Type I
19.25.2. Type II
19.25.3. Type III
19.25.4. Type IV
19.25.5. Type V
19.26. Mexico Market, by Valve Train
19.26.1. Single Overhead Cam (SOHC)
19.26.2. Double Overhead Cam (DOHC)
19.26.3. Over Head Valve (OHV)
19.27. Mexico Market Size & Forecast, by Sales Channel
19.27.1. OEM
19.27.2. Aftermarket
19.28. Mexico Market Size & Forecast, by Vehicle Type
19.28.1. Passenger Vehicle
19.28.2. Commercial Vehicle
19.28.2.1. LCV
19.28.2.2. HCV
19.28.3. Electric Vehicle
19.28.3.1. HEV
19.28.3.2. PHEV
19.29. Rest of Latin America Market Size & Forecast, by Fuel Type
19.29.1. Gasoline
19.29.2. Diesel
19.30. Rest of Latin America Market Size & Forecast, by Method
19.30.1. Cam Phasing
19.30.2. Cam Changing
19.30.3. Cam Phasing + Changing
19.30.4. Variable Valve Actuation
19.31. Rest of Latin America Market Size & Forecast, by Technology
19.31.1. VVT-i
19.31.2. Dual VVT-i
19.31.3. VVT-iE
19.31.4. VVT-iW
19.32. Rest of Latin America Market Size & Forecast, by Number of Valves
19.32.1. Less Than 12
19.32.2. 16
19.32.3. Between 17 to 23
19.32.4. More than 24
19.33. Rest of Latin America Market, by System
19.33.1. Discrete
19.33.2. Continuous
19.34. Rest of Latin America Market Size & Forecast, by Valve Actuation
19.34.1. Type I
19.34.2. Type II
19.34.3. Type III
19.34.4. Type IV
19.34.5. Type V
19.35. Latin America, by Valve Train
19.35.1. Single Overhead Cam (SOHC)
19.35.2. Double Overhead Cam (DOHC)
19.35.3. Over Head Valve (OHV)
19.36. Rest of Latin America Market Size & Forecast, by Sales Channel
19.36.1. OEM
19.36.2. Aftermarket
19.37. Rest of Latin America Market Size & Forecast, by Vehicle Type
19.37.1. Passenger Vehicle
19.37.2. Commercial Vehicle
19.37.2.1. LCV
19.37.2.2. HCV
19.37.3. Electric Vehicle
19.37.3.1. HEV
19.37.3.2. PHEV
19.38. Comparison Matrix
19.38.1. By Fuel Type
19.38.2. By Methods
19.38.3. By Technology
19.38.4. By Valve Train
19.38.5. By Number of Valves
19.38.6. By Valve Actuation Type
19.38.7. By System
19.38.8. By Sales Channel
19.38.9. By Vehicle
19.39. PEST Analysis
20. Europe Automotive VVT System Market Size and Forecast (Units) (US$ Mn), 2017–2026
20.1. Key Findings
20.2. Europe Market, by Fuel Type
20.2.1. Gasoline
20.2.2. Diesel
20.3. Europe Market, by Method
20.3.1. Cam Phasing
20.3.2. Cam Changing
20.3.3. Cam Phasing + Changing
20.3.4. Variable Valve Actuation
20.4. Europe Market Size & Forecast, by Technology
20.4.1. VVT-i
20.4.2. Dual VVT-i
20.4.3. VVT-iE
20.4.4. VVT-iW
20.5. Europe Market, by Number of Valves
20.5.1. Less Than 12
20.5.2. 16
20.5.3. Between 17 to 23
20.5.4. More than 24
20.6. Europe Market, by System
20.6.1. Discrete
20.6.2. Continuous
20.7. Europe Market, by Valve Actuation
20.7.1. Type I
20.7.2. Type II
20.7.3. Type III
20.7.4. Type IV
20.7.5. Type V
20.8. Europe, by Valve Train
20.8.1. Single Overhead Cam (SOHC)
20.8.2. Double Overhead Cam (DOHC)
20.8.3. Over Head Valve (OHV)
20.9. Europe Market, by Sales Channel
20.9.1. OEM
20.9.2. Aftermarket
20.10. Europe Market, by Vehicle Type
20.10.1. Passenger Vehicle
20.10.2. Commercial Vehicle
20.10.2.1. LCV
20.10.2.2. HCV
20.10.3. Electric Vehicle
20.10.3.1. HEV
20.10.3.2. PHEV
20.11. Germany Market Size & Forecast, by Fuel Type
20.11.1. Gasoline
20.11.2. Diesel
20.12. Germany Market Size & Forecast, by Method
20.12.1. Cam Phasing
20.12.2. Cam Changing
20.12.3. Cam Phasing + Changing
20.12.4. Variable Valve Actuation
20.13. Germany Market Size & Forecast, by Technology
20.13.1. VVT-i
20.13.2. Dual VVT-i
20.13.3. VVT-iE
20.13.4. VVT-iW
20.14. Germany Market Size & Forecast, by Number of Valves
20.14.1. Less Than 12
20.14.2. 16
20.14.3. Between 17 to 23
20.14.4. More than 24
20.15. Germany Market, by System
20.15.1. Discrete
20.15.2. Continuous
20.16. Germany Market Size & Forecast, by Valve Actuation
20.16.1. Type I
20.16.2. Type II
20.16.3. Type III
20.16.4. Type IV
20.16.5. Type V
20.17. Germany Market, by Valve Train
20.17.1. Single Overhead Cam (SOHC)
20.17.2. Double Overhead Cam (DOHC)
20.17.3. Over Head Valve (OHV)
20.18. Germany Market Size & Forecast, by Sales Channel
20.18.1. OEM
20.18.2. Aftermarket
20.19. Germany Market Size & Forecast, by Vehicle Type
20.19.1. Passenger Vehicle
20.19.2. Commercial Vehicle
20.19.2.1. LCV
20.19.2.2. HCV
20.19.3. Electric Vehicle
20.19.3.1. HEV
20.19.3.2. PHEV
20.20. France Market Size & Forecast, by Fuel Type
20.20.1. Gasoline
20.20.2. Diesel
20.21. France Market Size & Forecast, by Method
20.21.1. Cam Phasing
20.21.2. Cam Changing
20.21.3. Cam Phasing + Changing
20.21.4. Variable Valve Actuation
20.22. France Market Size & Forecast, by Technology
20.22.1. VVT-i
20.22.2. Dual VVT-i
20.22.3. VVT-iE
20.22.4. VVT-iW
20.23. France Market Size & Forecast, by Number of Valves
20.23.1. Less Than 12
20.23.2. 16
20.23.3. Between 17 to 23
20.23.4. More than 24
20.24. France Market, by System
20.24.1. Discrete
20.24.2. Continuous
20.25. France Market Size & Forecast, by Valve Actuation
20.25.1. Type I
20.25.2. Type II
20.25.3. Type III
20.25.4. Type IV
20.25.5. Type V
20.26. France Market, by Valve Train
20.26.1. Single Overhead Cam (SOHC)
20.26.2. Double Overhead Cam (DOHC)
20.26.3. Over Head Valve (OHV)
20.27. France Market Size & Forecast, by Sales Channel
20.27.1. OEM
20.27.2. Aftermarket
20.28. France Market Size & Forecast, by Vehicle Type
20.28.1. Passenger Vehicle
20.28.2. Commercial Vehicle
20.28.2.1. LCV
20.28.2.2. HCV
20.28.3. Electric Vehicle
20.28.3.1. HEV
20.28.3.2. PHEV
20.29. U.K. Market Size & Forecast, by Fuel Type
20.29.1. Gasoline
20.29.2. Diesel
20.30. U.K. Market Size & Forecast, by Method
20.30.1. Cam Phasing
20.30.2. Cam Changing
20.30.3. Cam Phasing + Changing
20.30.4. Variable Valve Actuation
20.31. U.K. Market Size & Forecast, by Technology
20.31.1. VVT-i
20.31.2. Dual VVT-i
20.31.3. VVT-iE
20.31.4. VVT-iW
20.32. U.K. Market Size & Forecast, by Number of Valves
20.32.1. Less Than 12
20.32.2. 16
20.32.3. Between 17 to 23
20.32.4. More than 24
20.33. U.K. Market, by System
20.33.1. Discrete
20.33.2. Continuous
20.34. U.K. Market Size & Forecast, by Valve Actuation
20.34.1. Type I
20.34.2. Type II
20.34.3. Type III
20.34.4. Type IV
20.34.5. Type V
20.35. U.K. Market, by Valve Train
20.35.1. Single Overhead Cam (SOHC)
20.35.2. Double Overhead Cam (DOHC)
20.35.3. Over Head Valve (OHV)
20.36. U.K. Market Size & Forecast, by Sales Channel
20.36.1. OEM
20.36.2. Aftermarket
20.37. U.K. Market Size & Forecast, by Vehicle Type
20.37.1. Passenger Vehicle
20.37.2. Commercial Vehicle
20.37.2.1. LCV
20.37.2.2. HCV
20.37.3. Electric Vehicle
20.37.3.1. HEV
20.37.3.2. PHEV
20.38. Spain Market Size & Forecast, by Fuel Type
20.38.1. Gasoline
20.38.2. Diesel
20.39. Spain Market Size & Forecast, by Method
20.39.1. Cam Phasing
20.39.2. Cam Changing
20.39.3. Cam Phasing + Changing
20.39.4. Variable Valve Actuation
20.40. Spain Market Size & Forecast, by Technology
20.40.1. VVT-i
20.40.2. Dual VVT-i
20.40.3. VVT-iE
20.40.4. VVT-iW
20.41. Spain Market Size & Forecast, by Number of Valves
20.41.1. Less Than 12
20.41.2. 16
20.41.3. Between 17 to 23
20.41.4. More than 24
20.42. Spain Market, by System
20.42.1. Discrete
20.42.2. Continuous
20.43. Spain Market Size & Forecast, by Valve Actuation
20.43.1. Type I
20.43.2. Type II
20.43.3. Type III
20.43.4. Type IV
20.43.5. Type V
20.44. Spain Market, by Valve Train
20.44.1. Single Overhead Cam (SOHC)
20.44.2. Double Overhead Cam (DOHC)
20.44.3. Over Head Valve (OHV)
20.45. Spain Market Size & Forecast, by Sales Channel
20.45.1. OEM
20.45.2. Aftermarket
20.46. Spain Market Size & Forecast b Vehicle Type
20.46.1. Passenger Vehicle
20.46.2. Commercial Vehicle
20.46.2.1. LCV
20.46.2.2. HCV
20.46.3. Electric Vehicle
20.46.3.1. HEV
20.46.3.2. PHEV
20.47. Italy Market Size & Forecast, by Fuel Type
20.47.1. Gasoline
20.47.2. Diesel
20.48. Italy Market Size & Forecast, by Method
20.48.1. Cam Phasing
20.48.2. Cam Changing
20.48.3. Cam Phasing + Changing
20.48.4. Variable Valve Actuation
20.49. Italy Market Size & Forecast, by Technology
20.49.1. VVT-i
20.49.2. Dual VVT-i
20.49.3. VVT-iE
20.49.4. VVT-iW
20.50. Italy Market Size & Forecast, by Number of Valves
20.50.1. Less Than 12
20.50.2. 16
20.50.3. Between 17 to 23
20.50.4. More than 24
20.51. Italy Market, by System
20.51.1. Discrete
20.51.2. Continuous
20.52. Italy Market Size & Forecast, by Valve Actuation
20.52.1. Type I
20.52.2. Type II
20.52.3. Type III
20.52.4. Type IV
20.52.5. Type V
20.53. Italy Market, by Valve Train
20.53.1. Single Overhead Cam (SOHC)
20.53.2. Double Overhead Cam (DOHC)
20.53.3. Over Head Valve (OHV)
20.54. Italy Market Size & Forecast, by Sales Channel
20.54.1. OEM
20.54.2. Aftermarket
20.55. Italy Market Size & Forecast, by Vehicle Type
20.55.1. Passenger Vehicle
20.55.2. Commercial Vehicle
20.55.2.1. LCV
20.55.2.2. HCV
20.55.3. Electric Vehicle
20.55.3.1. HEV
20.55.3.2. PHEV
20.56. Rest of Europe Market Size & Forecast, by Fuel Type
20.56.1. Gasoline
20.56.2. Diesel
20.57. Rest of Europe Market Size & Forecast, by Method
20.57.1. Cam Phasing
20.57.2. Cam Changing
20.57.3. Cam Phasing + Changing
20.57.4. Variable Valve Actuation
20.58. Rest of Europe Market Size & Forecast, by Technology
20.58.1. VVT-i
20.58.2. Dual VVT-i
20.58.3. VVT-iE
20.58.4. VVT-iW
20.59. Rest of Europe Market Size & Forecast, by Valve Train
20.59.1. Less Than 12
20.59.2. 16
20.59.3. Between 17 to 23
20.59.4. More than 24
20.60. Rest of Europe Market, by System
20.60.1. Discrete
20.60.2. Continuous
20.61. Rest of Europe Market Size & Forecast, by Valve Actuation
20.61.1. Type I
20.61.2. Type II
20.61.3. Type III
20.61.4. Type IV
20.61.5. Type V
20.62. Rest of Europe Market, by Valve Train
20.62.1. Single Overhead Cam (SOHC)
20.62.2. Double Overhead Cam (DOHC)
20.62.3. Over Head Valve (OHV)
20.63. Rest of Europe Market Size & Forecast, by Sales Channel
20.63.1. OEM
20.63.2. Aftermarket
20.64. Rest of Europe Market Size & Forecast, by Vehicle Type
20.64.1. Passenger Vehicle
20.64.2. Commercial Vehicle
20.64.2.1. LCV
20.64.2.2. HCV
20.64.3. Electric Vehicle
20.64.3.1. HEV
20.64.3.2. PHEV
20.65. Comparison Matrix
20.65.1. By Fuel Type
20.65.2. By Methods
20.65.3. By Technology
20.65.4. By Valve Train
20.65.5. By Valve Actuation Type
20.65.6. By Number of Valves
20.65.7. By System
20.65.8. By Sales Channel
20.65.9. By Vehicle
20.66. PEST Analysis
21. Asia Pacific Automotive VVT System Market Size and Forecast (Units) (US$ Mn), 2017–2026
21.1. Key Findings
21.2. Asia Pacific Market, by Fuel Type
21.2.1. Gasoline
21.2.2. Diesel
21.3. Asia Pacific Market, by Method
21.3.1. Cam Phasing
21.3.2. Cam Changing
21.3.3. Cam Phasing + Changing
21.3.4. Variable Valve Actuation
21.4. Asia Pacific Market Size & Forecast, by Technology
21.4.1. VVT-i
21.4.2. Dual VVT-i
21.4.3. VVT-iE
21.4.4. VVT-iW
21.5. Asia Pacific Market, by Number of Valves
21.5.1. Less Than 12
21.5.2. 16
21.5.3. Between 17 to 23
21.5.4. More than 24
21.6. Asia Pacific Market, by System
21.6.1. Discrete
21.6.2. Continuous
21.7. Asia Pacific Market, by Valve Actuation
21.7.1. Type I
21.7.2. Type II
21.7.3. Type III
21.7.4. Type IV
21.7.5. Type V
21.8. Asia Pacific Market, by Valve Train
21.8.1. Single Overhead Cam (SOHC)
21.8.2. Double Overhead Cam (DOHC)
21.8.3. Over Head Valve (OHV)
21.9. Asia Pacific Market, by Sales Channel
21.9.1. OEM
21.9.2. Aftermarket
21.10. Asia Pacific Market, by Vehicle Type
21.10.1. Passenger Vehicle
21.10.2. Commercial Vehicle
21.10.2.1. LCV
21.10.2.2. HCV
21.10.3. Electric Vehicle
21.10.3.1. HEV
21.10.3.2. PHEV
21.11. China Market Size & Forecast, by Fuel Type
21.11.1. Gasoline
21.11.2. Diesel
21.12. China Market Size & Forecast, by Method
21.12.1. Cam Phasing
21.12.2. Cam Changing
21.12.3. Cam Phasing + Changing
21.12.4. Variable Valve Actuation
21.13. China Market Size & Forecast, by Technology
21.13.1. VVT-i
21.13.2. Dual VVT-i
21.13.3. VVT-iE
21.13.4. VVT-iW
21.14. China Market Size & Forecast, by Number of Valves
21.14.1. Less Than 12
21.14.2. 16
21.14.3. Between 17 to 23
21.14.4. More than 24
21.15. China Market Size & Forecast, by Valve Actuation
21.15.1. Type I
21.15.2. Type II
21.15.3. Type III
21.15.4. Type IV
21.15.5. Type V
21.16. China Market, by Valve Train
21.16.1. Single Overhead Cam (SOHC)
21.16.2. Double Overhead Cam (DOHC)
21.16.3. Over Head Valve (OHV)
21.17. China Market Size & Forecast, by Sales Channel
21.17.1. OEM
21.17.2. Aftermarket
21.18. China Market Size & Forecast, by Vehicle Type
21.18.1. Passenger Vehicle
21.18.2. Commercial Vehicle
21.19. Japan Market Size & Forecast, by Fuel Type
21.19.1. Gasoline
21.19.2. Diesel
21.20. Japan Market Size & Forecast, by Method
21.20.1. Cam Phasing
21.20.2. Cam Changing
21.20.3. Cam Phasing + Changing
21.20.4. Variable Valve Actuation
21.21. Japan Market Size & Forecast, by Technology
21.21.1. VVT-i
21.21.2. Dual VVT-i
21.21.3. VVT-iE
21.21.4. VVT-iW
21.22. Japan Market Size & Forecast, by Number of Valves
21.22.1. Less Than 12
21.22.2. 16
21.22.3. Between 17 to 23
21.22.4. More than 24
21.23. Japan Market, by System
21.23.1. Discrete
21.23.2. Continuous
21.24. Japan Market Size & Forecast, by Valve Actuation
21.24.1. Type I
21.24.2. Type II
21.24.3. Type III
21.24.4. Type IV
21.24.5. Type V
21.25. Japan Market, by Valve Train
21.25.1. Single Overhead Cam (SOHC)
21.25.2. Double Overhead Cam (DOHC)
21.25.3. Over Head Valve (OHV)
21.26. Japan Market Size & Forecast, by Sales Channel
21.26.1. OEM
21.26.2. Aftermarket
21.27. Japan Market Size & Forecast, by Vehicle Type
21.27.1. Passenger Vehicle
21.27.2. Commercial Vehicle
21.28. India Market Size & Forecast, by Fuel Type
21.28.1. Gasoline
21.28.2. Diesel
21.29. India Market Size & Forecast, by Method
21.29.1. Cam Phasing
21.29.2. Cam Changing
21.29.3. Cam Phasing + Changing
21.29.4. Variable Valve Actuation
21.30. India Market Size & Forecast, by Technology
21.30.1. VVT-i
21.30.2. Dual VVT-i
21.30.3. VVT-iE
21.30.4. VVT-iW
21.31. India Market Size & Forecast, by Number of Valves
21.31.1. Less Than 12
21.31.2. 16
21.31.3. Between 17 to 23
21.31.4. More than 24
21.32. India Market, by System
21.32.1. Discrete
21.32.2. Continuous
21.33. India Market Size & Forecast, by Valve Actuation
21.33.1. Type I
21.33.2. Type II
21.33.3. Type III
21.33.4. Type IV
21.33.5. Type V
21.34. India Market, by Valve Train
21.34.1. Single Overhead Cam (SOHC)
21.34.2. Double Overhead Cam (DOHC)
21.34.3. Over Head Valve (OHV)
21.35. India Market Size & Forecast, by Sales Channel
21.35.1. OEM
21.35.2. Aftermarket
21.36. India Market Size & Forecast, by Vehicle Type Segment
21.36.1. Passenger Vehicle
21.36.2. Commercial Vehicle
21.36.2.1. LCV
21.36.2.2. HCV
21.36.3. Electric Vehicle
21.36.3.1. HEV
21.36.3.2. PHEV
21.37. ASEAN Market Size & Forecast, by Fuel Type
21.37.1. Gasoline
21.37.2. Diesel
21.38. ASEAN Market Size & Forecast, by Method
21.38.1. Cam Phasing
21.38.2. Cam Changing
21.38.3. Cam Phasing + Changing
21.38.4. Variable Valve Actuation
21.39. ASEAN Market Size & Forecast, by Technology
21.39.1. VVT-i
21.39.2. Dual VVT-i
21.39.3. VVT-iE
21.39.4. VVT-iW
21.40. ASEAN Market Size & Forecast, by Number of Valves
21.40.1. Less Than 12
21.40.2. 16
21.40.3. Between 17 to 23
21.40.4. More than 24
21.41. ASEAN Market, by System
21.41.1. Discrete
21.41.2. Continuous
21.42. ASEAN Market Size & Forecast, by Valve Actuation
21.42.1. Type I
21.42.2. Type II
21.42.3. Type III
21.42.4. Type IV
21.42.5. Type V
21.43. ASEAN Market, by Valve Train
21.43.1. Single Overhead Cam (SOHC)
21.43.2. Double Overhead Cam (DOHC)
21.43.3. Over Head Valve (OHV)
21.44. ASEAN Market Size & Forecast, by Sales Channel
21.44.1. OEM
21.44.2. Aftermarket
21.45. ASEAN Market Size & Forecast, by Vehicle Type
21.45.1. Passenger Vehicle
21.45.2. Commercial Vehicle
21.46. Rest of Asia Pacific Market Size & Forecast, by Fuel Type
21.46.1. Gasoline
21.46.2. Diesel
21.47. Rest of Asia Pacific Market Size & Forecast, by Method
21.47.1. Cam Phasing
21.47.2. Cam Changing
21.47.3. Cam Phasing + Changing
21.47.4. Variable Valve Actuation
21.48. Rest of Asia Pacific Market Size & Forecast, by Technology
21.48.1. VVT-i
21.48.2. Dual VVT-i
21.48.3. VVT-iE
21.48.4. VVT-iW
21.49. Rest of Asia Pacific Market Size & Forecast, by Number of Valves
21.49.1. Less Than 12
21.49.2. 16
21.49.3. Between 17 to 23
21.49.4. More than 24
21.50. Rest of Asia Pacific Market, by System
21.50.1. Discrete
21.50.2. Continuous
21.51. Rest of Asia Pacific Market Size & Forecast, by Valve Actuation
21.51.1. Type I
21.51.2. Type II
21.51.3. Type III
21.51.4. Type IV
21.51.5. Type V
21.52. Rest of Asia Pacific Market, by Valve Train
21.52.1. Single Overhead Cam (SOHC)
21.52.2. Double Overhead Cam (DOHC)
21.52.3. Over Head Valve (OHV)
21.53. Rest of Asia Pacific Market Size & Forecast, by Sales Channel
21.53.1. OEM
21.53.2. Aftermarket
21.54. Rest of Asia Pacific Market Size & Forecast, by Vehicle Type
21.54.1. Passenger Vehicle
21.54.2. Commercial Vehicle
21.54.2.1. LCV
21.54.2.2. HCV
21.54.3. Electric Vehicle
21.54.3.1. HEV
21.54.3.2. PHEV
21.55. Comparison Matrix
21.55.1. By Fuel Type
21.55.2. By Methods
21.55.3. By Technology
21.55.4. By Valve Train
21.55.5. By Valve Actuation Type
21.55.6. By Number of Valves
21.55.7. By System
21.55.8. By Sales Channel
21.55.9. By Vehicle
21.56. PEST Analysis
22. Middle East & Africa Automotive VVT System Market Size and Forecast (Units) (US$ Mn), 2017–2026
22.1. Key Findings
22.2. Middle East & Africa Market, by Fuel Type
22.2.1. Gasoline
22.2.2. Diesel
22.3. Middle East & Africa Market, by Method
22.3.1. Cam Phasing
22.3.2. Cam Changing
22.3.3. Cam Phasing + Changing
22.3.4. Variable Valve Actuation
22.4. Middle East & Africa Market Size & Forecast, by Technology
22.4.1. VVT-i
22.4.2. Dual VVT-i
22.4.3. VVT-iE
22.4.4. VVT-iW
22.5. Middle East & Africa Market, by Number of Valves
22.5.1. Less Than 12
22.5.2. 16
22.5.3. Between 17 to 23
22.5.4. More than 24
22.6. Middle East & Africa Market, by System
22.6.1. Discrete
22.6.2. Continuous
22.7. Middle East & Africa Market, by Valve Actuation
22.7.1. Type I
22.7.2. Type II
22.7.3. Type III
22.7.4. Type IV
22.7.5. Type V
22.8. Middle East & Africa Market, by Valve Train
22.8.1. Single Overhead Cam (SOHC)
22.8.2. Double Overhead Cam (DOHC)
22.8.3. Over Head Valve (OHV)
22.9. Middle East & Africa Market, by Sales Channel
22.9.1. OEM
22.9.2. Aftermarket
22.10. Middle East & Africa Market, by Vehicle Type
22.10.1. Passenger Vehicle
22.10.2. Commercial Vehicle
22.10.2.1. LCV
22.10.2.2. HCV
22.10.3. Electric Vehicle
22.10.3.1. HEV
22.10.3.2. PHEV
22.11. GCC Market Size & Forecast, by Fuel Type
22.11.1. Gasoline
22.11.2. Diesel
22.12. GCC Market Size & Forecast, by Method
22.12.1. Cam Phasing
22.12.2. Cam Changing
22.12.3. Cam Phasing + Changing
22.12.4. Variable Valve Actuation
22.13. GCC Market Size & Forecast, by Technology
22.13.1. VVT-i
22.13.2. Dual VVT-i
22.13.3. VVT-iE
22.13.4. VVT-iW
22.14. GCC Market Size & Forecast, by Number of Valves
22.14.1. Less Than 12
22.14.2. 16
22.14.3. Between 17 to 23
22.14.4. More than 24
22.15. GCC Market, by System
22.15.1. Discrete
22.15.2. Continuous
22.16. GCC Market Size & Forecast, by Valve Actuation
22.16.1. Type I
22.16.2. Type II
22.16.3. Type III
22.16.4. Type IV
22.16.5. Type V
22.17. GCC Market, by Valve Train
22.17.1. Single Overhead Cam (SOHC)
22.17.2. Double Overhead Cam (DOHC)
22.17.3. Over Head Valve (OHV)
22.18. GCC Market Size & Forecast, by Sales Channel
22.18.1. OEM
22.18.2. Aftermarket
22.19. GCC Market Size & Forecast, by Vehicle Type
22.19.1. Passenger Vehicle
22.19.2. Commercial Vehicle
22.19.2.1. LCV
22.19.2.2. HCV
22.19.3. Electric Vehicle
22.19.3.1. HEV
22.19.3.2. PHEV
22.20. South Africa Market Size & Forecast, by Fuel Type
22.20.1. Gasoline
22.20.2. Diesel
22.21. South Africa Market Size & Forecast, by Method
22.21.1. Cam Phasing
22.21.2. Cam Changing
22.21.3. Cam Phasing + Changing
22.21.4. Variable Valve Actuation
22.22. South Africa Market Size & Forecast, by Technology
22.22.1. VVT-i
22.22.2. Dual VVT-i
22.22.3. VVT-iE
22.22.4. VVT-iW
22.23. South Africa Market Size & Forecast, by Number of Valves
22.23.1. Less Than 12
22.23.2. 16
22.23.3. Between 17 to 23
22.23.4. More than 24
22.24. South Africa Market, by System
22.24.1. Discrete
22.24.2. Continuous
22.25. South Africa Market Size & Forecast, by Valve Actuation
22.25.1. Type I
22.25.2. Type II
22.25.3. Type III
22.25.4. Type IV
22.25.5. Type V
22.26. South Africa Market, by Valve Train
22.26.1. Single Overhead Cam (SOHC)
22.26.2. Double Overhead Cam (DOHC)
22.26.3. Over Head Valve (OHV)
22.27. South Africa Market Size & Forecast, by Sales Channel
22.27.1. OEM
22.27.2. Aftermarket
22.28. South Africa Market Size & Forecast, by Vehicle Type
22.28.1. Passenger Vehicle
22.28.2. Commercial Vehicle
22.28.2.1. LCV
22.28.2.2. HCV
22.28.3. Electric Vehicle
22.28.3.1. HEV
22.28.3.2. PHEV
22.29. Rest of Middle East & Africa Market Size & Forecast, by Fuel Type
22.29.1. Gasoline
22.29.2. Diesel
22.30. Rest of Middle East & Africa Market Size & Forecast, by Method
22.30.1. Cam Phasing
22.30.2. Cam Changing
22.30.3. Cam Phasing + Changing
22.30.4. Variable Valve Actuation
22.31. Rest of Middle East & Africa Market Size & Forecast, by Technology
22.31.1. VVT-i
22.31.2. Dual VVT-i
22.31.3. VVT-iE
22.31.4. VVT-iW
22.32. Rest of Middle East & Africa Market Size & Forecast, by Number of Valves
22.32.1. Less Than 12
22.32.2. 16
22.32.3. Between 17 to 23
22.32.4. More than 24
22.33. Rest of Middle Ease & Africa Market, by System
22.33.1. Discrete
22.33.2. Continuous
22.34. Rest of Middle East & Africa Market Size & Forecast, by Valve Actuation
22.34.1. Type I
22.34.2. Type II
22.34.3. Type III
22.34.4. Type IV
22.34.5. Type V
22.35. Rest of Middle East & Africa Market, by Valve Train
22.35.1. Single Overhead Cam (SOHC)
22.35.2. Double Overhead Cam (DOHC)
22.35.3. Over Head Valve (OHV)
22.36. Rest of Middle East & Africa Market Size & Forecast, by Sales Channel
22.36.1. OEM
22.36.2. Aftermarket
22.37. Rest of Middle East & Africa Market Size & Forecast, by Vehicle Type
22.37.1. Passenger Vehicle
22.37.2. Commercial Vehicle
22.37.2.1. LCV
22.37.2.2. HCV
22.37.3. Electric Vehicle
22.37.3.1. HEV
22.37.3.2. PHEV
22.38. Comparison Matrix
22.38.1. By Fuel Type
22.38.2. By Methods
22.38.3. By Technology
22.38.4. By Valve Train
22.38.5. By Valve Actuation Type
22.38.6. By Number of Valve
22.38.7. By System
22.38.8. By Sales Channel
22.38.9. By Vehicle
22.39. PEST Analysis
23. Company Profiles
23.1. Competitive Landscape (by Tier & Size of Company)
23.2. Company Financials
23.3. Manufacturing Footprint
23.4. Key Executive Matrix
23.5. Executive Bios/ Business expansion/ Key executive changes
23.5.1. Schaeffler AG
23.5.1.1. Company Overview
23.5.1.2. Financial Overview
23.5.1.3. Business Strategy
23.5.1.4. Recent Developments
23.5.2. BorgWarner Inc.
23.5.2.1. Company Overview
23.5.2.2. Financial Overview
23.5.2.3. Business Strategy
23.5.2.4. Recent Developments
23.5.3. AISIN SEIKI
23.5.3.1. Company Overview
23.5.3.2. Financial Overview
23.5.3.3. Business Strategy
23.5.3.4. Recent Developments
23.5.4. Robert Bosch GmbH
23.5.4.1. Company Overview
23.5.4.2. Financial Overview
23.5.4.3. Business Strategy
23.5.4.4. Recent Developments
23.5.5. Camcraft
23.5.5.1. Company Overview
23.5.5.2. Financial Overview
23.5.5.3. Business Strategy
23.5.5.4. Recent Developments
23.5.6. Toyota Motor Corporation
23.5.6.1. Company Overview
23.5.6.2. Financial Overview
23.5.6.3. Business Strategy
23.5.6.4. Recent Developments
23.5.7. Honda Motor Co., Ltd.
23.5.7.1. Company Overview
23.5.7.2. Financial Overview
23.5.7.3. Business Strategy
23.5.7.4. Recent Developments
23.5.8. Federal-Mogul LLC
23.5.8.1. Company Overview
23.5.8.2. Financial Overview
23.5.8.3. Business Strategy
23.5.8.4. Recent Developments
23.5.9. Eaton Corporation
23.5.9.1. Company Overview
23.5.9.2. Financial Overview
23.5.9.3. Business Strategy
23.5.9.4. Recent Developments
23.5.10. Johnson Controls, Inc.
23.5.10.1. Company Overview
23.5.10.2. Financial Overview
23.5.10.3. Business Strategy
23.5.10.4. Recent Developments
23.5.11. Mikuni American Corporation
23.5.11.1. Company Overview
23.5.11.2. Financial Overview
23.5.11.3. Business Strategy
23.5.11.4. Recent Developments
23.5.12. Mitsubishi Electric Corporation
23.5.12.1. Company Overview
23.5.12.2. Financial Overview
23.5.12.3. Business Strategy
23.5.12.4. Recent Developments
23.5.13. Hitachi Automotive Systems
15.3.13.1. Company Overview
15.3.13.2. Financial Overview
15.3.13.3. Business Strategy
15.3.13.4. Recent Developments
23.5.14. DENSO Corporation
15.3.13.5. Company Overview
15.3.13.6. Financial Overview
15.3.13.7. Business Strategy
15.3.13.8. Recent Developments
24. Primary Key Insights
List of Tables
Table 1: Global Automotive VVT System Market Volume (Million Units) and Forecast, by Valve Train, 2017–2026
Table 2: Global Automotive VVT System Market Size (US$ Mn) and Forecast, by Valve Train, 2017–2026
Table 3: Global Automotive VVT System Market Volume (Million Units) Forecast, by Fuel Type, 2017–2026
Table 4: Global Automotive VVT System Market Size (US$ Mn) Forecast, by Fuel Type, 2017–2026
Table 5: Global Automotive VVT System Market Volume (Million Units) Forecast, by System Type, 2017–2026
Table 6: Global Automotive VVT System Market Size (US$ Mn) Forecast, by System Type, 2017–2026
Table 7: Global Automotive VVT System Market Volume (Million Units) Forecast, by Number of Valves, 2017–2026
Table 8: Global Automotive VVT System Market Size (US$ Mn) Forecast, by Number of Valves, 2017–2026
Table 9: Global Automotive VVT System Market Volume (Million Units) Forecast, by Technology, 2017–2026
Table 10: Global Automotive VVT System Market Size (US$ Mn) Forecast, by Technology, 2017–2026
Table 11: Global Automotive VVT System Market Volume (Million Units) Forecast, by Methods, 2017–2026
Table 12: Global Automotive VVT System Market Size (US$ Mn) Forecast, by Methods, 2017–2026
Table 13: Global Automotive VVT System Market Volume (Million Units) and Forecast, by Actuation Type, 2017–2026
Table 14: Global Automotive VVT System Market Size (US$ Mn) and Forecast, by Actuation Type, 2017–2026
Table 15: Global Automotive VVT System Market Volume (Million Units) and Forecast, by Vehicle Type, 2017–2026
Table 16: Global Automotive VVT System Market Size (US$ Mn) and Forecast, by Vehicle Type, 2017–2026
Table 17: Global Automotive VVT System Market Volume (Million Units) and Forecast, by Sales Channel, 2017–2026
Table 18: Global Automotive VVT System Market Size (US$ Mn) and Forecast, by Sales Channel, 2017–2026
Table 19: Global Automotive VVT System Market Revenue (US$ Mn) Forecast, by Region, 2017–2026
Table 20: Global Automotive VVT System Volume (million units) Forecast, by Region, 2017–2026
Table 21: North America Automotive VVT System Market Volume (Million Units) and Forecast, by Valve Train, 2017–2026
Table 22: North America Automotive VVT System Market Size (US$ Mn) and Forecast, by Valve Train, 2017–2026
Table 23: North America Automotive VVT System Market Volume (Million Units) Forecast, by Fuel Type, 2017–2026
Table 24: North America Automotive VVT System Market Size (US$ Mn) Forecast, by Fuel Type, 2017–2026
Table 25: North America Automotive VVT System Market Volume (Million Units) Forecast, by System Type, 2017–2026
Table 26: North America Automotive VVT System Market Size (US$ Mn) Forecast, by System Type, 2017–2026
Table 27: North America Automotive VVT System Market Volume (Million Units) Forecast, by Number of Valves, 2017–2026
Table 28: North America Automotive VVT System Market Size (US$ Mn) Forecast, by Number of Valves, 2017–2026
Table 29: North America Automotive VVT System Market Volume (Million Units) Forecast, by Technology, 2017–2026
Table 30: North America Automotive VVT System Market Size (US$ Mn) Forecast, by Technology, 2017–2026
Table 31: North America Automotive VVT System Market Volume (Million Units) Forecast, by Methods, 2017–2026
Table 32: North America Automotive VVT System Market Size (US$ Mn) Forecast, by Methods, 2017–2026
Table 33: North America Automotive VVT System Market Volume (Million Units) and Forecast, by Actuation Type, 2017–2026
Table 34: North America Automotive VVT System Market Size (US$ Mn) and Forecast, by Actuation Type, 2017–2026
Table 35: North America Automotive VVT System Market Volume (Million Units) and Forecast, by Vehicle Type, 2017–2026
Table 36: North America Automotive VVT System Market Size (US$ Mn) and Forecast, by Vehicle Type, 2017–2026
Table 37: North America Automotive VVT System Market Volume (Million Units) and Forecast, by Sales Channel, 2017–2026
Table 38: North America Automotive VVT System Market Size (US$ Mn) and Forecast, by Sales Channel, 2017–2026
Table 39: North America Automotive VVT System Market Size (US$ Mn) Forecast, by Country, 2017–2026
Table 40: North America Automotive VVT System Market Volume (Million Units) Forecast, by Country, 2017–2026
Table 41: U. S. Automotive VVT System Market Volume (Million Units) and Forecast, by Valve Train, 2017–2026
Table 42: U. S. Automotive VVT System Market Size (US$ Mn) and Forecast, by Valve Train, 2017–2026
Table 43: U. S. Automotive VVT System Market Volume (Million Units) Forecast, by Fuel Type, 2017–2026
Table 44: U. S. Automotive VVT System Market Size (US$ Mn) Forecast, by Fuel Type, 2017–2026
Table 45: U. S. Automotive VVT System Market Volume (Million Units) Forecast, by System Type, 2017–2026
Table 46: U. S. Automotive VVT System Market Size (US$ Mn) Forecast, by System Type, 2017–2026
Table 47: U. S. Automotive VVT System Market Volume (Million Units) Forecast, by Number of Valves, 2017–2026
Table 48: U. S. Automotive VVT System Market Size (US$ Mn) Forecast, by Number of Valves, 2017–2026
Table 49: U. S. Automotive VVT System Market Volume (Million Units) Forecast, by Technology, 2017–2026
Table 50: U. S. Automotive VVT System Market Size (US$ Mn) Forecast, by Technology, 2017–2026
Table 51: U. S. Automotive VVT System Market Volume (Million Units) Forecast, by Methods, 2017–2026
Table 52: U. S. Automotive VVT System Market Size (US$ Mn) Forecast, by Methods, 2017–2026
Table 53: U. S. Automotive VVT System Market Volume (Million Units) and Forecast, by Actuation Type, 2017–2026
Table 54: U. S. Automotive VVT System Market Size (US$ Mn) and Forecast, by Actuation Type, 2017–2026
Table 55: U. S. Automotive VVT System Market Volume (Million Units) and Forecast, by Vehicle Type, 2017–2026
Table 56: U. S. Automotive VVT System Market Size (US$ Mn) and Forecast, by Vehicle Type, 2017–2026
Table 57: Canada Automotive VVT System Market Volume (Million Units) and Forecast, by Valve Train, 2017–2026
Table 58: Canada Automotive VVT System Market Size (US$ Mn) and Forecast, by Valve Train, 2017–2026
Table 59: Canada Automotive VVT System Market Volume (Million Units) Forecast, by Fuel Type, 2017–2026
Table 60: Canada Automotive VVT System Market Size (US$ Mn) Forecast, by Fuel Type, 2017–2026
Table 61: Canada Automotive VVT System Market Volume (Million Units) Forecast, by System Type, 2017–2026
Table 62: Canada Automotive VVT System Market Size (US$ Mn) Forecast, by System Type, 2017–2026
Table 63: Canada Automotive VVT System Market Volume (Million Units) Forecast, by Number of Valves, 2017–2026
Table 64: Canada Automotive VVT System Market Size (US$ Mn) Forecast, by Number of Valves, 2017–2026
Table 65: Canada Automotive VVT System Market Volume (Million Units) Forecast, by Technology, 2017–2026
Table 66: Canada Automotive VVT System Market Size (US$ Mn) Forecast, by Technology, 2017–2026
Table 67: Canada Automotive VVT System Market Volume (Million Units) Forecast, by Methods, 2017–2026
Table 68: Canada Automotive VVT System Market Size (US$ Mn) Forecast, by Methods, 2017–2026
Table 69: Canada Automotive VVT System Market Volume (Million Units) and Forecast, by Actuation Type, 2017–2026
Table 70: Canada Automotive VVT System Market Size (US$ Mn) and Forecast, by Actuation Type, 2017–2026
Table 71: Canada Automotive VVT System Market Volume (Million Units) and Forecast, by Vehicle Type, 2017–2026
Table 72: Canada Automotive VVT System Market Size (US$ Mn) and Forecast, by Vehicle Type, 2017–2026
Table 73: Latin America Automotive VVT System Market Volume (Million Units) and Forecast, by Valve Train, 2017–2026
Table 74: Latin America Automotive VVT System Market Size (US$ Mn) and Forecast, by Valve Train, 2017–2026
Table 75: Latin America Automotive VVT System Market Volume (Million Units) Forecast, by Fuel Type, 2017–2026
Table 76: Latin America Automotive VVT System Market Size (US$ Mn) Forecast, by Fuel Type, 2017–2026
Table 77: Latin America Automotive VVT System Market Volume (Million Units) Forecast, by System Type, 2017–2026
Table 78: Latin America Automotive VVT System Market Size (US$ Mn) Forecast, by System Type, 2017–2026
Table 79: Latin America Automotive VVT System Market Volume (Million Units) Forecast, by Number of Valves, 2017–2026
Table 80: Latin America Automotive VVT System Market Size (US$ Mn) Forecast, by Number of Valves, 2017–2026
Table 81: Latin America Automotive VVT System Market Volume (Million Units) Forecast, by Technology, 2017–2026
Table 82: Latin America Automotive VVT System Market Size (US$ Mn) Forecast, by Technology, 2017–2026
Table 83: Latin America Automotive VVT System Market Volume (Million Units) Forecast, by Methods, 2017–2026
Table 84: Latin America Automotive VVT System Market Size (US$ Mn) Forecast, by Methods, 2017–2026
Table 85: Latin America Automotive VVT System Market Volume (Million Units) and Forecast, by Actuation Type, 2017–2026
Table 86: Latin America Automotive VVT System Market Size (US$ Mn) and Forecast, by Actuation Type, 2017–2026
Table 87: Latin America Automotive VVT System Market Volume (Million Units) and Forecast, by Vehicle Type, 2017–2026
Table 88: Latin America Automotive VVT System Market Size (US$ Mn) and Forecast, by Vehicle Type, 2017–2026
Table 89: Latin America Automotive VVT System Market Volume (Million Units) and Forecast, by Sales Channel, 2017–2026
Table 90: Latin America Automotive VVT System Market Size (US$ Mn) and Forecast, by Sales Channel, 2017–2026
Table 91: Latin America Automotive VVT System Market Size (US$ Mn) Forecast, by Country, 2017–2026
Table 92: Latin America Automotive VVT System Market Volume (Million Units) Forecast, by Country, 2017–2026
Table 93: Brazil Automotive VVT System Market Volume (Million Units) and Forecast, by Valve Train, 2017–2026
Table 94: Brazil Automotive VVT System Market Size (US$ Mn) and Forecast, by Valve Train, 2017–2026
Table 95: Brazil Automotive VVT System Market Volume (Million Units) Forecast, by Fuel Type, 2017–2026
Table 96: Brazil Automotive VVT System Market Size (US$ Mn) Forecast, by Fuel Type, 2017–2026
Table 97: Brazil Automotive VVT System Market Volume (Million Units) Forecast, by System Type, 2017–2026
Table 98: Brazil Automotive VVT System Market Size (US$ Mn) Forecast, by System Type, 2017–2026
Table 99: Brazil Automotive VVT System Market Volume (Million Units) Forecast, by Number of Valves, 2017–2026
Table 100: Brazil Automotive VVT System Market Size (US$ Mn) Forecast, by Number of Valves, 2017–2026
Table 101: Brazil Automotive VVT System Market Volume (Million Units) Forecast, by Technology, 2017–2026
Table 102: Brazil Automotive VVT System Market Size (US$ Mn) Forecast, by Technology, 2017–2026
Table 103: Brazil Automotive VVT System Market Volume (Million Units) Forecast, by Methods, 2017–2026
Table 104: Brazil Automotive VVT System Market Size (US$ Mn) Forecast, by Methods, 2017–2026
Table 105: Brazil Automotive VVT System Market Volume (Million Units) and Forecast, by Actuation Type, 2017–2026
Table 106: Brazil Automotive VVT System Market Size (US$ Mn) and Forecast, by Actuation Type, 2017–2026
Table 107: Brazil Automotive VVT System Market Volume (Million Units) and Forecast, by Vehicle Type, 2017–2026
Table 108: Brazil Automotive VVT System Market Size (US$ Mn) and Forecast, by Vehicle Type, 2017–2026
Table 109: Mexico Automotive VVT System Market Volume (Million Units) and Forecast, by Valve Train, 2017–2026
Table 110: Mexico Automotive VVT System Market Size (US$ Mn) and Forecast, by Valve Train, 2017–2026
Table 111: Mexico Automotive VVT System Market Volume (Million Units) Forecast, by Fuel Type, 2017–2026
Table 112: Mexico Automotive VVT System Market Size (US$ Mn) Forecast, by Fuel Type, 2017–2026
Table 113: Mexico Automotive VVT System Market Volume (Million Units) Forecast, by System Type, 2017–2026
Table 114: Mexico Automotive VVT System Market Size (US$ Mn) Forecast, by System Type, 2017–2026
Table 115: Mexico Automotive VVT System Market Volume (Million Units) Forecast, by Number of Valves, 2017–2026
Table 116: Mexico Automotive VVT System Market Size (US$ Mn) Forecast, by Number of Valves, 2017–2026
Table 117: Mexico Automotive VVT System Market Volume (Million Units) Forecast, by Technology, 2017–2026
Table 118: Mexico Automotive VVT System Market Size (US$ Mn) Forecast, by Technology, 2017–2026
Table 119: Mexico Automotive VVT System Market Volume (Million Units) Forecast, by Methods, 2017–2026
Table 120: Mexico Automotive VVT System Market Size (US$ Mn) Forecast, by Methods, 2017–2026
Table 121: Mexico Automotive VVT System Market Volume (Million Units) and Forecast, by Actuation Type, 2017–2026
Table 122: Mexico Automotive VVT System Market Size (US$ Mn) and Forecast, by Actuation Type, 2017–2026
Table 123: Mexico Automotive VVT System Market Volume (Million Units) and Forecast, by Vehicle Type, 2017–2026
Table 124: Mexico Automotive VVT System Market Size (US$ Mn) and Forecast, by Vehicle Type, 2017–2026
Table 125: Rest of Latin America Automotive VVT System Market Volume (Million Units) and Forecast, by Valve Train, 2017–2026
Table 126: Rest of Latin America Automotive VVT System Market Size (US$ Mn) and Forecast, by Valve Train, 2017–2026
Table 127: Rest of Latin America Automotive VVT System Market Volume (Million Units) Forecast, by Fuel Type, 2017–2026
Table 128: Rest of Latin America Automotive VVT System Market Size (US$ Mn) Forecast, by Fuel Type, 2017–2026
Table 130: Rest of Latin America Automotive VVT System Market Volume (Million Units) Forecast, by System Type, 2017–2026
Table 131: Rest of Latin America Automotive VVT System Market Size (US$ Mn) Forecast, by System Type, 2017–2026
Table 132: Rest of Latin America Automotive VVT System Market Volume (Million Units) Forecast, by Number of Valves, 2017–2026
Table 133: Rest of Latin America Automotive VVT System Market Size (US$ Mn) Forecast, by Number of Valves, 2017–2026
Table 134: Rest of Latin America Automotive VVT System Market Volume (Million Units) Forecast, by Technology, 2017–2026
Table 135: Rest of Latin America Automotive VVT System Market Size (US$ Mn) Forecast, by Technology, 2017–2026
Table 136: Rest of Latin America Automotive VVT System Market Volume (Million Units) Forecast, by Methods, 2017–2026
Table 137: Rest of Latin America Automotive VVT System Market Size (US$ Mn) Forecast, by Methods, 2017–2026
Table 138: Rest of Latin America Automotive VVT System Market Volume (Million Units) and Forecast, by Actuation Type, 2017–2026
Table 139: Rest of Latin America Automotive VVT System Market Size (US$ Mn) and Forecast, by Actuation Type, 2017–2026
Table 140: Rest of Latin America Automotive VVT System Market Volume (Million Units) and Forecast, by Vehicle Type, 2017–2026
Table 141: Rest of Latin America Automotive VVT System Market Size (US$ Mn) and Forecast, by Vehicle Type, 2017–2026
Table 142: Europe Automotive VVT System Market Volume (Million Units) and Forecast, by Valve Train, 2017–2026
Table 143: Europe Automotive VVT System Market Size (US$ Mn) and Forecast, by Valve Train, 2017–2026
Table 144: Europe Automotive VVT System Market Volume (Million Units) Forecast, by Fuel Type, 2017–2026
Table 145: Europe Automotive VVT System Market Size (US$ Mn) Forecast, by Fuel Type, 2017–2026
Table 146: Europe Automotive VVT System Market Volume (Million Units) Forecast, by System Type, 2017–2026
Table 147: Europe Automotive VVT System Market Size (US$ Mn) Forecast, by System Type, 2017–2026
Table 148: Europe Automotive VVT System Market Volume (Million Units) Forecast, by Number of Valves, 2017–2026
Table 149: Europe Automotive VVT System Market Size (US$ Mn) Forecast, by Number of Valves, 2017–2026
Table 150: Europe Automotive VVT System Market Volume (Million Units) Forecast, by Technology, 2017–2026
Table 151: Europe Automotive VVT System Market Size (US$ Mn) Forecast, by Technology, 2017–2026
Table 152: Europe Automotive VVT System Market Volume (Million Units) Forecast, by Methods, 2017–2026
Table 153: Europe Automotive VVT System Market Size (US$ Mn) Forecast, by Methods, 2017–2026
Table 154: Europe Automotive VVT System Market Volume (Million Units) and Forecast, by Actuation Type, 2017–2026
Table 155: Europe Automotive VVT System Market Size (US$ Mn) and Forecast, by Actuation Type, 2017–2026
Table 156: Europe Automotive VVT System Market Volume (Million Units) and Forecast, by Vehicle Type, 2017–2026
Table 157: Europe Automotive VVT System Market Size (US$ Mn) and Forecast, by Vehicle Type, 2017–2026
Table 158: Europe Automotive VVT System Market Volume (Million Units) and Forecast, by Sales Channel, 2017–2026
Table 159: Europe Automotive VVT System Market Size (US$ Mn) and Forecast, by Sales Channel, 2017–2026
Table 160: Europe Automotive VVT System Market Size (US$ Mn) Forecast, by Country and Sub-regions, 2017–2026
Table 161: Europe Automotive VVT System Market Volume (Million Units) Forecast, by Country and Sub-regions, 2017–2026
Table 162: Germany Automotive VVT System Market Volume (Million Units) and Forecast, by Valve Train, 2017–2026
Table 163: Germany Automotive VVT System Market Size (US$ Mn) and Forecast, by Valve Train, 2017–2026
Table 164: Germany Automotive VVT System Market Volume (Million Units) Forecast, by Fuel Type, 2017–2026
Table 165: Germany Automotive VVT System Market Size (US$ Mn) Forecast, by Fuel Type, 2017–2026
Table 166: Germany Automotive VVT System Market Volume (Million Units) Forecast, by System Type, 2017–2026
Table 167: Germany Automotive VVT System Market Size (US$ Mn) Forecast, by System Type, 2017–2026
Table 168: Germany Automotive VVT System Market Volume (Million Units) Forecast, by Number of Valves, 2017–2026
Table 169: Germany Automotive VVT System Market Size (US$ Mn) Forecast, by Number of Valves, 2017–2026
Table 170: Germany Automotive VVT System Market Volume (Million Units) Forecast, by Technology, 2017–2026
Table 171: Germany Automotive VVT System Market Size (US$ Mn) Forecast, by Technology, 2017–2026
Table 172: Germany Automotive VVT System Market Volume (Million Units) Forecast, by Methods, 2017–2026
Table 173: Germany Automotive VVT System Market Size (US$ Mn) Forecast, by Methods, 2017–2026
Table 174: Germany Automotive VVT System Market Volume (Million Units) and Forecast, by Actuation Type, 2017–2026
Table 175: Germany Automotive VVT System Market Size (US$ Mn) and Forecast, by Actuation Type, 2017–2026
Table 176: Germany Automotive VVT System Market Volume (Million Units) and Forecast, by Vehicle Type, 2017–2026
Table 177: Germany Automotive VVT System Market Size (US$ Mn) and Forecast, by Vehicle Type, 2017–2026
Table 178: U. K. Automotive VVT System Market Volume (Million Units) and Forecast, by Valve Train, 2017–2026
Table 179: U. K. Automotive VVT System Market Size (US$ Mn) and Forecast, by Valve Train, 2017–2026
Table 180: U. K. Automotive VVT System Market Volume (Million Units) Forecast, by Fuel Type, 2017–2026
Table 181: U. K. Automotive VVT System Market Size (US$ Mn) Forecast, by Fuel Type, 2017–2026
Table 182: U. K. Automotive VVT System Market Volume (Million Units) Forecast, by System Type, 2017–2026
Table 183: U. K. Automotive VVT System Market Size (US$ Mn) Forecast, by System Type, 2017–2026
Table 184: U. K. Automotive VVT System Market Volume (Million Units) Forecast, by Number of Valves, 2017–2026
Table 185: U. K. Automotive VVT System Market Size (US$ Mn) Forecast, by Number of Valves, 2017–2026
Table 186: U. K. Automotive VVT System Market Volume (Million Units) Forecast, by Technology, 2017–2026
Table 187: U. K. Automotive VVT System Market Size (US$ Mn) Forecast, by Technology, 2017–2026
Table 188: U. K. Automotive VVT System Market Volume (Million Units) Forecast, by Methods, 2017–2026
Table 189: U. K. Automotive VVT System Market Size (US$ Mn) Forecast, by Methods, 2017–2026
Table 190: U. K. Automotive VVT System Market Volume (Million Units) and Forecast, by Actuation Type, 2017–2026
Table 191: U. K. Automotive VVT System Market Size (US$ Mn) and Forecast, by Actuation Type, 2017–2026
Table 192: U. K. Automotive VVT System Market Volume (Million Units) and Forecast, by Vehicle Type, 2017–2026
Table 193: U. K. Automotive VVT System Market Size (US$ Mn) and Forecast, by Vehicle Type, 2017–2026
Table 194: France Automotive VVT System Market Volume (Million Units) and Forecast, by Valve Train, 2017–2026
Table 195: France Automotive VVT System Market Size (US$ Mn) and Forecast, by Valve Train, 2017–2026
Table 196: France Automotive VVT System Market Volume (Million Units) Forecast, by Fuel Type, 2017–2026
Table 197: France Automotive VVT System Market Size (US$ Mn) Forecast, by Fuel Type, 2017–2026
Table 198: France Automotive VVT System Market Volume (Million Units) Forecast, by System Type, 2017–2026
Table 199: France Automotive VVT System Market Size (US$ Mn) Forecast, by System Type, 2017–2026
Table 200: France Automotive VVT System Market Volume (Million Units) Forecast, by Number of Valves, 2017–2026
Table 201: France Automotive VVT System Market Size (US$ Mn) Forecast, by Number of Valves, 2017–2026
Table 202: France Automotive VVT System Market Volume (Million Units) Forecast, by Technology, 2017–2026
Table 203: France Automotive VVT System Market Size (US$ Mn) Forecast, by Technology, 2017–2026
Table 204: France Automotive VVT System Market Volume (Million Units) Forecast, by Methods, 2017–2026
Table 205: France Automotive VVT System Market Size (US$ Mn) Forecast, by Methods, 2017–2026
Table 206: France Automotive VVT System Market Volume (Million Units) and Forecast, by Actuation Type, 2017–2026
Table 207: France Automotive VVT System Market Size (US$ Mn) and Forecast, by Actuation Type, 2017–2026
Table 208: France Automotive VVT System Market Volume (Million Units) and Forecast, by Vehicle Type, 2017–2026
Table 209: France Automotive VVT System Market Size (US$ Mn) and Forecast, by Vehicle Type, 2017–2026
Table 210: Italy Automotive VVT System Market Volume (Million Units) and Forecast, by Valve Train, 2017–2026
Table 211: Italy Automotive VVT System Market Size (US$ Mn) and Forecast, by Valve Train, 2017–2026
Table 212: Italy Automotive VVT System Market Volume (Million Units) Forecast, by Fuel Type, 2017–2026
Table 213: Italy Automotive VVT System Market Size (US$ Mn) Forecast, by Fuel Type, 2017–2026
Table 214: Italy Automotive VVT System Market Volume (Million Units) Forecast, by System Type, 2017–2026
Table 215: Italy Automotive VVT System Market Size (US$ Mn) Forecast, by System Type, 2017–2026
Table 216: Italy Automotive VVT System Market Volume (Million Units) Forecast, by Number of Valves, 2017–2026
Table 217: Italy Automotive VVT System Market Size (US$ Mn) Forecast, by Number of Valves, 2017–2026
Table 218: Italy Automotive VVT System Market Volume (Million Units) Forecast, by Technology, 2017–2026
Table 219: Italy Automotive VVT System Market Size (US$ Mn) Forecast, by Technology, 2017–2026
Table 220: Italy Automotive VVT System Market Volume (Million Units) Forecast, by Methods, 2017–2026
Table 221: Italy Automotive VVT System Market Size (US$ Mn) Forecast, by Methods, 2017–2026
Table 222: Italy Automotive VVT System Market Volume (Million Units) and Forecast, by Actuation Type, 2017–2026
Table 223: Italy Automotive VVT System Market Size (US$ Mn) and Forecast, by Actuation Type, 2017–2026
Table 224: Italy Automotive VVT System Market Volume (Million Units) and Forecast, by Vehicle Type, 2017–2026
Table 225: Italy Automotive VVT System Market Size (US$ Mn) and Forecast, by Vehicle Type, 2017–2026
Table 226: Spain Automotive VVT System Market Volume (Million Units) and Forecast, by Valve Train, 2017–2026
Table 227: Spain Automotive VVT System Market Size (US$ Mn) and Forecast, by Valve Train, 2017–2026
Table 228: Spain Automotive VVT System Market Volume (Million Units) Forecast, by Fuel Type, 2017–2026
Table 229: Spain Automotive VVT System Market Size (US$ Mn) Forecast, by Fuel Type, 2017–2026
Table 230: Spain Automotive VVT System Market Volume (Million Units) Forecast, by System Type, 2017–2026
Table 231: Spain Automotive VVT System Market Size (US$ Mn) Forecast, by System Type, 2017–2026
Table 232: Spain Automotive VVT System Market Volume (Million Units) Forecast, by Number of Valves, 2017–2026
Table 233: Spain Automotive VVT System Market Size (US$ Mn) Forecast, by Number of Valves, 2017–2026
Table 234: Spain Automotive VVT System Market Volume (Million Units) Forecast, by Technology, 2017–2026
Table 235: Spain Automotive VVT System Market Size (US$ Mn) Forecast, by Technology, 2017–2026
Table 236: Spain Automotive VVT System Market Volume (Million Units) Forecast, by Methods, 2017–2026
Table 237: Spain Automotive VVT System Market Size (US$ Mn) Forecast, by Methods, 2017–2026
Table 238: Spain Automotive VVT System Market Volume (Million Units) and Forecast, by Actuation Type, 2017–2026
Table 239: Spain Automotive VVT System Market Size (US$ Mn) and Forecast, by Actuation Type, 2017–2026
Table 240: Spain Automotive VVT System Market Volume (Million Units) and Forecast, by Vehicle Type, 2017–2026
Table 241: Spain Automotive VVT System Market Size (US$ Mn) and Forecast, by Vehicle Type, 2017–2026
Table 242: Rest of Europe Automotive VVT System Market Volume (Million Units) and Forecast, by Valve Train, 2017–2026
Table 243: Rest of Europe Automotive VVT System Market Size (US$ Mn) and Forecast, by Valve Train, 2017–2026
Table 244: Rest of Europe Automotive VVT System Market Volume (Million Units) Forecast, by Fuel Type, 2017–2026
Table 245: Rest of Europe Automotive VVT System Market Size (US$ Mn) Forecast, by Fuel Type, 2017–2026
Table 246: Rest of Europe Automotive VVT System Market Volume (Million Units) Forecast, by System Type, 2017–2026
Table 247: Rest of Europe Automotive VVT System Market Size (US$ Mn) Forecast, by System Type, 2017–2026
Table 248: Rest of Europe Automotive VVT System Market Volume (Million Units) Forecast, by Number of Valves, 2017–2026
Table 249: Rest of Europe Automotive VVT System Market Size (US$ Mn) Forecast, by Number of Valves, 2017–2026
Table 250: Rest of Europe Automotive VVT System Market Volume (Million Units) Forecast, by Technology, 2017–2026
Table 251: Rest of Europe Automotive VVT System Market Size (US$ Mn) Forecast, by Technology, 2017–2026
Table 252: Rest of Europe Automotive VVT System Market Volume (Million Units) Forecast, by Methods, 2017–2026
Table 253: Rest of Europe Automotive VVT System Market Size (US$ Mn) Forecast, by Methods, 2017–2026
Table 254: Rest of Europe Automotive VVT System Market Volume (Million Units) and Forecast, by Actuation Type, 2017–2026
Table 255: Rest of Europe Automotive VVT System Market Size (US$ Mn) and Forecast, by Actuation Type, 2017–2026
Table 256: Rest of Europe Automotive VVT System Market Volume (Million Units) and Forecast, by Vehicle Type, 2017–2026
Table 257: Rest of Europe Automotive VVT System Market Size (US$ Mn) and Forecast, by Vehicle Type, 2017–2026
Table 258: Asia Pacific Automotive VVT System Market Volume (Million Units) and Forecast, by Valve Train, 2017–2026
Table 260: Asia Pacific Automotive VVT System Market Size (US$ Mn) and Forecast, by Valve Train, 2017–2026
Table 261: Asia Pacific Automotive VVT System Market Volume (Million Units) Forecast, by Fuel Type, 2017–2026
Table 262: Asia Pacific Automotive VVT System Market Size (US$ Mn) Forecast, by Fuel Type, 2017–2026
Table 263: Asia Pacific Automotive VVT System Market Volume (Million Units) Forecast, by System Type, 2017–2026
Table 264: Asia Pacific Automotive VVT System Market Size (US$ Mn) Forecast, by System Type, 2017–2026
Table 265: Asia Pacific Automotive VVT System Market Volume (Million Units) Forecast, by Number of Valves, 2017–2026
Table 266: Asia Pacific Automotive VVT System Market Size (US$ Mn) Forecast, by Number of Valves, 2017–2026
Table 267: Asia Pacific Automotive VVT System Market Volume (Million Units) Forecast, by Technology, 2017–2026
Table 268: Asia Pacific Automotive VVT System Market Size (US$ Mn) Forecast, by Technology, 2017–2026
Table 269: Asia Pacific Automotive VVT System Market Volume (Million Units) Forecast, by Methods, 2017–2026
Table 270: Asia Pacific Automotive VVT System Market Size (US$ Mn) Forecast, by Methods, 2017–2026
Table 271: Asia Pacific Automotive VVT System Market Volume (Million Units) and Forecast, by Actuation Type, 2017–2026
Table 272: Asia Pacific Automotive VVT System Market Size (US$ Mn) and Forecast, by Actuation Type, 2017–2026
Table 273: Asia Pacific Automotive VVT System Market Volume (Million Units) and Forecast, by Vehicle Type, 2017–2026
Table 274: Asia Pacific Automotive VVT System Market Size (US$ Mn) and Forecast, by Vehicle Type, 2017–2026
Table 275: Asia Pacific Automotive VVT System Market Volume (Million Units) and Forecast, by Sales Channel, 2017–2026
Table 276: Asia Pacific Automotive VVT System Market Size (US$ Mn) and Forecast, by Sales Channel, 2017–2026
Table 277: Asia Pacific Automotive VVT System Market Size (US$ Mn) Forecast, by Country and Sub-regions, 2017–2026
Table 278: Asia Pacific Automotive VVT System Market Volume (Million Units) Forecast, by Country and Sub-regions, 2017–2026
Table 279: China Automotive VVT System Market Volume (Million Units) and Forecast, by Valve Train, 2017–2026
Table 280: China Automotive VVT System Market Size (US$ Mn) and Forecast, by Valve Train, 2017–2026
Table 281: China Automotive VVT System Market Volume (Million Units) Forecast, by Fuel Type, 2017–2026
Table 282: China Automotive VVT System Market Size (US$ Mn) Forecast, by Fuel Type, 2017–2026
Table 283: China Automotive VVT System Market Volume (Million Units) Forecast, by System Type, 2017–2026
Table 284: China Automotive VVT System Market Size (US$ Mn) Forecast, by System Type, 2017–2026
Table 285: China Automotive VVT System Market Volume (Million Units) Forecast, by Number of Valves, 2017–2026
Table 286: China Automotive VVT System Market Size (US$ Mn) Forecast, by Number of Valves, 2017–2026
Table 287: China Automotive VVT System Market Volume (Million Units) Forecast, by Technology, 2017–2026
Table 288: China Automotive VVT System Market Size (US$ Mn) Forecast, by Technology, 2017–2026
Table 289: China Automotive VVT System Market Volume (Million Units) Forecast, by Methods, 2017–2026
Table 290: China Automotive VVT System Market Size (US$ Mn) Forecast, by Methods, 2017–2026
Table 291: China Automotive VVT System Market Volume (Million Units) and Forecast, by Actuation Type, 2017–2026
Table 292: China Automotive VVT System Market Size (US$ Mn) and Forecast, by Actuation Type, 2017–2026
Table 293: China Automotive VVT System Market Volume (Million Units) and Forecast, by Vehicle Type, 2017–2026
Table 294: China Automotive VVT System Market Size (US$ Mn) and Forecast, by Vehicle Type, 2017–2026
Table 295: India Automotive VVT System Market Volume (Million Units) and Forecast, by Valve Train, 2017–2026
Table 296: India Automotive VVT System Market Size (US$ Mn) and Forecast, by Valve Train, 2017–2026
Table 297: India Automotive VVT System Market Volume (Million Units) Forecast, by Fuel Type, 2017–2026
Table 298: India Automotive VVT System Market Size (US$ Mn) Forecast, by Fuel Type, 2017–2026
Table 299: India Automotive VVT System Market Volume (Million Units) Forecast, by System Type, 2017–2026
Table 300: India Automotive VVT System Market Size (US$ Mn) Forecast, by System Type, 2017–2026
Table 301: India Automotive VVT System Market Volume (Million Units) Forecast, by Number of Valves, 2017–2026
Table 302: India Automotive VVT System Market Size (US$ Mn) Forecast, by Number of Valves, 2017–2026
Table 303: India Automotive VVT System Market Volume (Million Units) Forecast, by Technology, 2017–2026
Table 304: India Automotive VVT System Market Size (US$ Mn) Forecast, by Technology, 2017–2026
Table 305: India Automotive VVT System Market Volume (Million Units) Forecast, by Methods, 2017–2026
Table 306: India Automotive VVT System Market Size (US$ Mn) Forecast, by Methods, 2017–2026
Table 307: India Automotive VVT System Market Volume (Million Units) and Forecast, by Actuation Type, 2017–2026
Table 308: India Automotive VVT System Market Size (US$ Mn) and Forecast, by Actuation Type, 2017–2026
Table 309: India Automotive VVT System Market Volume (Million Units) and Forecast, by Vehicle Type, 2017–2026
Table 310: India Automotive VVT System Market Size (US$ Mn) and Forecast, by Vehicle Type, 2017–2026
Table 311: Japan Automotive VVT System Market Volume (Million Units) and Forecast, by Valve Train, 2017–2026
Table 312: Japan Automotive VVT System Market Size (US$ Mn) and Forecast, by Valve Train, 2017–2026
Table 313: Japan Automotive VVT System Market Volume (Million Units) Forecast, by Fuel Type, 2017–2026
Table 314: Japan Automotive VVT System Market Size (US$ Mn) Forecast, by Fuel Type, 2017–2026
Table 315: Japan Automotive VVT System Market Volume (Million Units) Forecast, by System Type, 2017–2026
Table 316: Japan Automotive VVT System Market Size (US$ Mn) Forecast, by System Type, 2017–2026
Table 317: Japan Automotive VVT System Market Volume (Million Units) Forecast, by Number of Valves, 2017–2026
Table 318: Japan Automotive VVT System Market Size (US$ Mn) Forecast, by Number of Valves, 2017–2026
Table 319: Japan Automotive VVT System Market Volume (Million Units) Forecast, by Technology, 2017–2026
Table 320: Japan Automotive VVT System Market Size (US$ Mn) Forecast, by Technology, 2017–2026
Table 321: Japan Automotive VVT System Market Volume (Million Units) Forecast, by Methods, 2017–2026
Table 322: Japan Automotive VVT System Market Size (US$ Mn) Forecast, by Methods, 2017–2026
Table 323: Japan Automotive VVT System Market Volume (Million Units) and Forecast, by Actuation Type, 2017–2026
Table 324: Japan Automotive VVT System Market Size (US$ Mn) and Forecast, by Actuation Type, 2017–2026
Table 325: Japan Automotive VVT System Market Volume (Million Units) and Forecast, by Vehicle Type, 2017–2026
Table 326: Japan Automotive VVT System Market Size (US$ Mn) and Forecast, by Vehicle Type, 2017–2026
Table 327: ASEAN Automotive VVT System Market Volume (Million Units) and Forecast, by Valve Train, 2017–2026
Table 328: ASEAN Automotive VVT System Market Size (US$ Mn) and Forecast, by Valve Train, 2017–2026
Table 329: ASEAN Automotive VVT System Market Volume (Million Units) Forecast, by Fuel Type, 2017–2026
Table 330: ASEAN Automotive VVT System Market Size (US$ Mn) Forecast, by Fuel Type, 2017–2026
Table 331: ASEAN Automotive VVT System Market Volume (Million Units) Forecast, by System Type, 2017–2026
Table 332: ASEAN Automotive VVT System Market Size (US$ Mn) Forecast, by System Type, 2017–2026
Table 333: ASEAN Automotive VVT System Market Volume (Million Units) Forecast, by Number of Valves, 2017–2026
Table 334: ASEAN Automotive VVT System Market Size (US$ Mn) Forecast, by Number of Valves, 2017–2026
Table 335: ASEAN Automotive VVT System Market Volume (Million Units) Forecast, by Technology, 2017–2026
Table 336: ASEAN Automotive VVT System Market Size (US$ Mn) Forecast, by Technology, 2017–2026
Table 337: ASEAN Automotive VVT System Market Volume (Million Units) Forecast, by Methods, 2017–2026
Table 338: ASEAN Automotive VVT System Market Size (US$ Mn) Forecast, by Methods, 2017–2026
Table 339: ASEAN Automotive VVT System Market Volume (Million Units) and Forecast, by Actuation Type, 2017–2026
Table 340: ASEAN Automotive VVT System Market Size (US$ Mn) and Forecast, by Actuation Type, 2017–2026
Table 341: ASEAN Automotive VVT System Market Volume (Million Units) and Forecast, by Vehicle Type, 2017–2026
Table 342: ASEAN Automotive VVT System Market Size (US$ Mn) and Forecast, by Vehicle Type, 2017–2026
Table 343: Rest of Asia Pacific Automotive VVT System Market Volume (Million Units) and Forecast, by Valve Train, 2017–2026
Table 344: Rest of Asia Pacific Automotive VVT System Market Size (US$ Mn) and Forecast, by Valve Train, 2017–2026
Table 345: Rest of Asia Pacific Automotive VVT System Market Volume (Million Units) Forecast, by Fuel Type, 2017–2026
Table 346: Rest of Asia Pacific Automotive VVT System Market Size (US$ Mn) Forecast, by Fuel Type, 2017–2026
Table 347: Rest of Asia Pacific Automotive VVT System Market Volume (Million Units) Forecast, by System Type, 2017–2026
Table 348: Rest of Asia Pacific Automotive VVT System Market Size (US$ Mn) Forecast, by System Type, 2017–2026
Table 349: Rest of Asia Pacific Automotive VVT System Market Volume (Million Units) Forecast, by Number of Valves, 2017–2026
Table 350: Rest of Asia Pacific Automotive VVT System Market Size (US$ Mn) Forecast, by Number of Valves, 2017–2026
Table 351: Rest of Asia Pacific Automotive VVT System Market Volume (Million Units) Forecast, by Technology, 2017–2026
Table 352: Rest of Asia Pacific Automotive VVT System Market Size (US$ Mn) Forecast, by Technology, 2017–2026
Table 353: Rest of Asia Pacific Automotive VVT System Market Volume (Million Units) Forecast, by Methods, 2017–2026
Table 354: Rest of Asia Pacific Automotive VVT System Market Size (US$ Mn) Forecast, by Methods, 2017–2026
Table 355: Rest of Asia Pacific Automotive VVT System Market Volume (Million Units) and Forecast, by Actuation Type, 2017–2026
Table 356: Rest of Asia Pacific Automotive VVT System Market Size (US$ Mn) and Forecast, by Actuation Type, 2017–2026
Table 357: Rest of Asia Pacific Automotive VVT System Market Volume (Million Units) and Forecast, by Vehicle Type, 2017–2026
Table 358: Rest of Asia Pacific Automotive VVT System Market Size (US$ Mn) and Forecast, by Vehicle Type, 2017–2026
Table 359: Middle East & Africa Automotive VVT System Market Volume (Million Units) and Forecast, by Valve Train, 2017–2026
Table 360: Middle East & Africa Automotive VVT System Market Size (US$ Mn) and Forecast, by Valve Train, 2017–2026
Table 361: Middle East & Africa Automotive VVT System Market Volume (Million Units) Forecast, by Fuel Type, 2017–2026
Table 362: Middle East & Africa Automotive VVT System Market Size (US$ Mn) Forecast, by Fuel Type, 2017–2026
Table 363: Middle East & Africa Automotive VVT System Market Volume (Million Units) Forecast, by System Type, 2017–2026
Table 364: Middle East & Africa Automotive VVT System Market Size (US$ Mn) Forecast, by System Type, 2017–2026
Table 365: Middle East & Africa Automotive VVT System Market Volume (Million Units) Forecast, by Number of Valves, 2017–2026
Table 366: Middle East & Africa Automotive VVT System Market Size (US$ Mn) Forecast, by Number of Valves, 2017–2026
Table 367: Middle East & Africa Automotive VVT System Market Volume (Million Units) Forecast, by Technology, 2017–2026
Table 368: Middle East & Africa Automotive VVT System Market Size (US$ Mn) Forecast, by Technology, 2017–2026
Table 369: Middle East & Africa Automotive VVT System Market Volume (Million Units) Forecast, by Methods, 2017–2026
Table 370: Middle East & Africa Automotive VVT System Market Size (US$ Mn) Forecast, by Methods, 2017–2026
Table 371: Middle East & Africa Automotive VVT System Market Volume (Million Units) and Forecast, by Actuation Type, 2017–2026
Table 372: Middle East & Africa Automotive VVT System Market Size (US$ Mn) and Forecast, by Actuation Type, 2017–2026
Table 373: Middle East & Africa Automotive VVT System Market Volume (Million Units) and Forecast, by Vehicle Type, 2017–2026
Table 374: Middle East & Africa Automotive VVT System Market Size (US$ Mn) and Forecast, by Vehicle Type, 2017–2026
Table 375: Middle East & Africa Automotive VVT System Market Volume (Million Units) and Forecast, by Sales Channel, 2017–2026
Table 376: Middle East & Africa Automotive VVT System Market Size (US$ Mn) and Forecast, by Sales Channel, 2017–2026
Table 377: Middle East and Africa Automotive VVT System Market Size (US$ Mn) Forecast, by Country and Sub-regions, 2017–2026
Table 378: Middle East and Africa Automotive VVT System Market Volume (Million Units) Forecast, by Country and Sub-regions, 2017–2026
Table 379: GCC Automotive VVT System Market Volume (Million Units) and Forecast, by Valve Train, 2017–2026
Table 380: GCC Automotive VVT System Market Size (US$ Mn) and Forecast, by Valve Train, 2017–2026
Table 381: GCC Automotive VVT System Market Volume (Million Units) Forecast, by Fuel Type, 2017–2026
Table 382: GCC Automotive VVT System Market Size (US$ Mn) Forecast, by Fuel Type, 2017–2026
Table 383: GCC Automotive VVT System Market Volume (Million Units) Forecast, by System Type, 2017–2026
Table 384: GCC Automotive VVT System Market Size (US$ Mn) Forecast, by System Type, 2017–2026
Table 385: GCC Automotive VVT System Market Volume (Million Units) Forecast, by Number of Valves, 2017–2026
Table 386: GCC Automotive VVT System Market Size (US$ Mn) Forecast, by Number of Valves, 2017–2026
Table 387: GCC Automotive VVT System Market Volume (Million Units) Forecast, by Technology, 2017–2026
Table 388: GCC Automotive VVT System Market Size (US$ Mn) Forecast, by Technology, 2017–2026
Table 389: GCC Automotive VVT System Market Volume (Million Units) Forecast, by Methods, 2017–2026
Table 390: GCC Automotive VVT System Market Size (US$ Mn) Forecast, by Methods, 2017–2026
Table 391: GCC Automotive VVT System Market Volume (Million Units) and Forecast, by Actuation Type, 2017–2026
Table 392: GCC Automotive VVT System Market Size (US$ Mn) and Forecast, by Actuation Type, 2017–2026
Table 393: GCC Automotive VVT System Market Volume (Million Units) and Forecast, by Vehicle Type, 2017–2026
Table 394: GCC Automotive VVT System Market Size (US$ Mn) and Forecast, by Vehicle Type, 2017–2026
Table 395: South Africa Automotive VVT System Market Volume (Million Units) and Forecast, by Valve Train, 2017–2026
Table 396: South Africa Automotive VVT System Market Size (US$ Mn) and Forecast, by Valve Train, 2017–2026
Table 397: South Africa Automotive VVT System Market Volume (Million Units) Forecast, by Fuel Type, 2017–2026
Table 398: South Africa Automotive VVT System Market Size (US$ Mn) Forecast, by Fuel Type, 2017–2026
Table 399: South Africa Automotive VVT System Market Volume (Million Units) Forecast, by System Type, 2017–2026
Table 400: South Africa Automotive VVT System Market Size (US$ Mn) Forecast, by System Type, 2017–2026
Table 401: South Africa Automotive VVT System Market Volume (Million Units) Forecast, by Number of Valves, 2017–2026
Table 402: South Africa Automotive VVT System Market Size (US$ Mn) Forecast, by Number of Valves, 2017–2026
Table 403: South Africa Automotive VVT System Market Volume (Million Units) Forecast, by Technology, 2017–2026
Table 404: South Africa Automotive VVT System Market Size (US$ Mn) Forecast, by Technology, 2017–2026
Table 405: South Africa Automotive VVT System Market Volume (Million Units) Forecast, by Methods, 2017–2026
Table 406: South Africa Automotive VVT System Market Size (US$ Mn) Forecast, by Methods, 2017–2026
Table 407: South Africa Automotive VVT System Market Volume (Million Units) and Forecast, by Actuation Type, 2017–2026
Table 408: South Africa Automotive VVT System Market Size (US$ Mn) and Forecast, by Actuation Type, 2017–2026
Table 409: South Africa Automotive VVT System Market Volume (Million Units) and Forecast, by Vehicle Type, 2017–2026
Table 410: South Africa Automotive VVT System Market Size (US$ Mn) and Forecast, by Vehicle Type, 2017–2026
Table 411: Rest of MEA Automotive VVT System Market Volume (Million Units) and Forecast, by Valve Train, 2017–2026
Table 412: Rest of MEA Automotive VVT System Market Size (US$ Mn) and Forecast, by Valve Train, 2017–2026
Table 413: Rest of MEA Automotive VVT System Market Volume (Million Units) Forecast, by Fuel Type, 2017–2026
Table 414: Rest of MEA Automotive VVT System Market Size (US$ Mn) Forecast, by Fuel Type, 2017–2026
Table 415: Rest of MEA Automotive VVT System Market Volume (Million Units) Forecast, by System Type, 2017–2026
Table 416: Rest of MEA Automotive VVT System Market Size (US$ Mn) Forecast, by System Type, 2017–2026
Table 417: Rest of MEA Automotive VVT System Market Volume (Million Units) Forecast, by Number of Valves, 2017–2026
Table 418: Rest of MEA Automotive VVT System Market Size (US$ Mn) Forecast, by Number of Valves, 2017–2026
Table 419: Rest of MEA Automotive VVT System Market Volume (Million Units) Forecast, by Technology, 2017–2026
Table 420: Rest of MEA Automotive VVT System Market Size (US$ Mn) Forecast, by Technology, 2017–2026
Table 421: Rest of MEA Automotive VVT System Market Volume (Million Units) Forecast, by Methods, 2017–2026
Table 422: Rest of MEA Automotive VVT System Market Size (US$ Mn) Forecast, by Methods, 2017–2026
Table 423: Rest of MEA Automotive VVT System Market Volume (Million Units) and Forecast, by Actuation Type, 2017–2026
Table 424: Rest of MEA Automotive VVT System Market Size (US$ Mn) and Forecast, by Actuation Type, 2017–2026
Table 425: Rest of MEA Automotive VVT System Market Volume (Million Units) and Forecast, by Vehicle Type, 2017–2026
Table 426: Rest of MEA Automotive VVT System Market Size (US$ Mn) and Forecast, by Vehicle Type, 2017–2026
List of Figures
Figure 1: Global Automotive VVT System Market Size (US$ Mn) (Units) Forecast, 2017–2026
Figure 2: Global Automotive VVT System Market, Y-o-Y Growth (%), 2017–2026
Figure 3: Global Automotive OE VVT System Market Value Share Analysis, by Valve Train, 2017 and 2026
Figure 4: Global DOHC Segment Volume (Million Units) Value (US$ Mn) Forecast, 2017–2026
Figure 5: Global SOHC Segment Volume (Million Units) Value (US$ Mn) Forecast, 2017–2026
Figure 6: Global OHV Segment, by Volume (Million Units) & Value (US$ Mn) Forecast 2016–2025
Figure 7: Global Automotive VVT System Market Attractiveness Analysis, by Valve Train
Figure 8: Global Automotive VVT System Market Value Share Analysis, by Fuel Type, 2017 and 2026
Figure 9: Global Gasoline Segment Volume (Million Units) Value (US$ Mn) Forecast, 2017–2026
Figure 10: Global Diesel Segment Volume (Million Units) Value (US$ Mn) Forecast, 2017–2026
Figure 11: Global Automotive VVT System Market Attractiveness Analysis, by Fuel Type
Figure 12: Global Automotive VVT System Market Value Share Analysis, by System Type, 2017 and 2026
Figure 13: Global Discrete VVT Segment Volume (Million Units) Value (US$ Mn) Forecast, 2017–2026
Figure 14: Global Continuous VVT Segment Volume (Million Units) Value (US$ Mn) Forecast, 2017–2026
Figure 15: Global Automotive VVT System Market Attractiveness Analysis, by System Type
Figure 16: Global Automotive VVT System Market Value Share Analysis, by Number of Valves, 2017 and 2026
Figure 17: Global VVT System Segment Volume (Million Units) Value (US$ Mn) Forecast, 2017–2026
Figure 18: Global 16 VVT System Segment Volume (Million Units) Value (US$ Mn) Forecast, 2017–2026
Figure 19: Global Between 17 to 23 VVT System Segment Volume (Units Million) Value (US$ Mn) Forecast, 2017–2026
Figure 20: Global More than 24 VVT System Segment, by Volume (Million Units) & Value (US$ Mn) Forecast 2017–2026
Figure 21: Global Automotive VVT System Market Attractiveness Analysis, by Number of Valves
Figure 22: Global Automotive VVT System Market Value Share Analysis, by Technology, 2017 and 2026
Figure 23: Global VVT System Segment Volume (Million Units) Value (US$ Mn) Forecast, 2017–2026
Figure 24: Global Dual VVT-i VVT System Segment Volume (Million Units) Value (US$ Mn) Forecast, 2017–2026
Figure 25: Global VVT-iE VVT System Segment Volume (Units Million) Value (US$ Mn) Forecast, 2017–2026
Figure 26: Global VVT-iW VVT System Segment, by Volume (Million Units) & Value (US$ Mn) Forecast 2017–2026
Figure 27: Global Automotive VVT System Market Attractiveness Analysis, by Technology
Figure 28: Global Automotive VVT System Market Value Share Analysis, by Methods, 2017 and 2026
Figure 29: Global VVT System Segment Volume (Million Units) Value (US$ Mn) Forecast, 2017–2026
Figure 30: Global Cam Changing VVT System Segment Volume (Million Units) Value (US$ Mn) Forecast, 2017–2026
Figure 31: Global Cam Phasing + Changing VVT System Segment Volume (Units Million) Value (US$ Mn) Forecast, 2017–2026
Figure 32: Global Variable Valve Actuation VVT System Segment, by Volume (Million Units) & Value (US$ Mn) Forecast 2017–2026
Figure 33: Global Automotive VVT System Market Attractiveness Analysis, by Methods
Figure 34: Global Automotive VVT System Market Value Share Analysis, by Actuation Type, 2017 and 2026
Figure 35: Global Type I Segment Volume (Million Units) Value (US$ Mn) Forecast, 2017–2026
Figure 36: Global Commercial Vehicle Type Volume (Million Units) Value (US$ Mn) Forecast, 2017–2026
Figure 37: Global Type I Segment Volume (Million Units) Value (US$ Mn) Forecast, 2017–2026
Figure 38: Global Commercial Vehicle Type Volume (Million Units) Value (US$ Mn) Forecast, 2017–2026
Figure 39: Global Segment, by Volume (Million Units) & Value (US$ Mn) Forecast 2016–2025
Figure 40: Global Automotive VVT System Market Attractiveness Analysis, by Actuation Type
Figure 41: Global Automotive VVT System Market Value Share Analysis, by Vehicle Type, 2017 and 2026
Figure 42: Global Passenger Vehicle Type Volume (Million Units) Value (US$ Mn) Forecast, 2017–2026
Figure 43: Global Commercial Vehicle Type Volume (Million Units) Value (US$ Mn) Forecast, 2017–2026
Figure 44: Global Passenger Vehicle Type Volume (Million Units) Value (US$ Mn) Forecast, 2017–2026
Figure 45: Global Commercial Vehicle Type Volume (Million Units) Value (US$ Mn) Forecast, 2017–2026
Figure 46: Global Segment, by Volume (Million Units) & Value (US$ Mn) Forecast 2016–2025
Figure 47: Global Automotive VVT System Market Attractiveness Analysis, by Vehicle Type
Figure 48: Global Automotive VVT System Market Value Share Analysis, by Sales Channel, 2017 and 2026
Figure 49: Global OEM Segment Volume (Million Units) Value (US$ Mn) Forecast, 2017–2026
Figure 50: Global Aftermarket Segment Volume (Million Units) Value (US$ Mn) Forecast, 2017–2026
Figure 51: Global Automotive VVT System Market Attractiveness Analysis, by Sales Channel
Figure 52: Global Automotive VVT System Market Value Share Analysis, by Region, 2017 and 2026
Figure 53: Global Automotive VVT System Market Attractiveness Analysis, by Region
Figure 54: North America Automotive VVT System Market Size (US$ Mn) and Volume (Million Units) Forecast, 2017–2026
Figure 55: North America Automotive VVT System Market Attractiveness Analysis, by Country
Figure 56: North America Automotive VVT System Market Value Share Analysis, by Valve Train, 2017 and 2026
Figure 57: North America Automotive VVT System Market Value Share Analysis, by Fuel Type, 2017 and 2026
Figure 58: North America Automotive VVT System Market Value Share Analysis, by System Type, 2017 and 2026
Figure 59: North America Automotive VVT System Market Value Share Analysis, by Number of Valves, 2017 and 2026
Figure 60: North America Automotive VVT System Market Value Share Analysis, by Technology, 2017 and 2026
Figure 61: North America Automotive VVT System Market Value Share Analysis, by Methods, 2017 and 2026
Figure 62: North America Automotive VVT System Market Value Share Analysis, by Actuation Type, 2017 and 2026
Figure 63: North America Automotive VVT System Market Value Share Analysis, by Vehicle Type, 2017 and 2026
Figure 64: North America Automotive VVT System Market Value Share Analysis, by Sales Channel, 2017 and 2026
Figure 65: North America Automotive VVT System Market Value Share Analysis, by Country, 2017 and 2026
Figure 66: North America Automotive VVT System Market Attractiveness Analysis, by Valve Train
Figure 67: North America Automotive VVT System Market Attractiveness Analysis, by Fuel Type
Figure 68: North America Automotive VVT System Market Attractiveness Analysis, by System Type
Figure 69: North America Automotive VVT System Market Attractiveness Analysis, by Number of Valves
Figure 70: North America Automotive VVT System Market Attractiveness Analysis, by Technology
Figure 71: North America Automotive VVT System Market Attractiveness Analysis, by Methods
Figure 72: North America Automotive VVT System Market Attractiveness Analysis, by Actuation Type
Figure 73: North America Automotive VVT System Market Attractiveness Analysis, by Vehicle Type
Figure 74: North America Automotive VVT System Market Attractiveness Analysis, by Sales Channel
Figure 75: Latin America Automotive VVT System Market Size (US$ Mn) and Volume (Million Units) Forecast, 2017–2026
Figure 76: Latin America Automotive VVT System Market Attractiveness Analysis, by Country
Figure 77: Latin America Automotive VVT System Market Value Share Analysis, by Valve Train, 2017 and 2026
Figure 78: Latin America Automotive VVT System Market Value Share Analysis, by Fuel Type, 2017 and 2026
Figure 79: Latin America Automotive VVT System Market Value Share Analysis, by System Type, 2017 and 2026
Figure 80: Latin America Automotive VVT System Market Value Share Analysis, by Number of Valves, 2017 and 2026
Figure 81: Latin America Automotive VVT System Market Value Share Analysis, by Technology, 2017 and 2026
Figure 82: Latin America Automotive VVT System Market Value Share Analysis, by Methods, 2017 and 2026
Figure 83: Latin America Automotive VVT System Market Value Share Analysis, by Actuation Type, 2017 and 2026
Figure 84: Latin America Automotive VVT System Market Value Share Analysis, by Vehicle Type, 2017 and 2026
Figure 85: Latin America Automotive VVT System Market Value Share Analysis, by Sales Channel, 2017 and 2026
Figure 86: Latin America Automotive VVT System Market Value Share Analysis, by Country, 2017 and 2026
Figure 87: Latin America Automotive VVT System Market Attractiveness Analysis, by Valve Train
Figure 88: Latin America Automotive VVT System Market Attractiveness Analysis, by Fuel Type
Figure 89: Latin America Automotive VVT System Market Attractiveness Analysis, by System Type
Figure 90: Latin America Automotive VVT System Market Attractiveness Analysis, by Number of Valves
Figure 91: Latin America Automotive VVT System Market Attractiveness Analysis, by Technology
Figure 92: Latin America Automotive VVT System Market Attractiveness Analysis, by Methods
Figure 93: Latin America Automotive VVT System Market Attractiveness Analysis, by Actuation Type
Figure 94: Latin America Automotive VVT System Market Attractiveness Analysis, by Vehicle Type
Figure 95: Latin America Automotive VVT System Market Attractiveness Analysis, by Sales Channel
Figure 96: Europe Automotive VVT System Market Size (US$ Mn) and Volume (Million Units) Forecast, 2017–2026
Figure 97: Europe Automotive VVT System Market Attractiveness Analysis, by Country and Sub-region
Figure 98: Europe Automotive VVT System Market Value Share Analysis, by Valve Train, 2017 and 2026
Figure 99: Europe Automotive VVT System Market Value Share Analysis, by Fuel Type, 2017 and 2026
Figure 100: Europe Automotive VVT System Market Value Share Analysis, by System Type, 2017 and 2026
Figure 101: Europe Automotive VVT System Market Value Share Analysis, by Number of Valves, 2017 and 2026
Figure 102: Europe Automotive VVT System Market Value Share Analysis, by Technology, 2017 and 2026
Figure 103: Europe Automotive VVT System Market Value Share Analysis, by Methods, 2017 and 2026
Figure 104: Europe Automotive VVT System Market Value Share Analysis, by Actuation Type, 2017 and 2026
Figure 105: Europe Automotive VVT System Market Value Share Analysis, by Vehicle Type, 2017 and 2026
Figure 106: Europe Automotive VVT System Market Value Share Analysis, by Sales Channel, 2017 and 2026
Figure 107: Europe Automotive VVT System Market Value Share Analysis, by Country, 2017 and 2026
Figure 108: Europe Automotive VVT System Market Attractiveness Analysis, by Valve Train
Figure 109: Europe Automotive VVT System Market Attractiveness Analysis, by Fuel Type
Figure 110: Europe Automotive VVT System Market Attractiveness Analysis, by System Type
Figure 111: Europe Automotive VVT System Market Attractiveness Analysis, by Number of Valves
Figure 112: Europe Automotive VVT System Market Attractiveness Analysis, by Technology
Figure 113: Europe Automotive VVT System Market Attractiveness Analysis, by Methods
Figure 114: Europe Automotive VVT System Market Attractiveness Analysis, by Actuation Type
Figure 115: Europe Automotive VVT System Market Attractiveness Analysis, by Vehicle Type
Figure 116: Europe Automotive VVT System Market Attractiveness Analysis, by Sales Channel
Figure 117: Asia Pacific Automotive VVT System Market Size (US$ Mn) and Volume (Million Units) Forecast, 2017–2026
Figure 118: Asia Pacific Automotive VVT System Market Attractiveness Analysis, by Country and Sub-regions
Figure 119: Asia Pacific Automotive VVT System Market Value Share Analysis, by Valve Train, 2017 and 2026
Figure 120: Asia Pacific Automotive VVT System Market Value Share Analysis, by Fuel Type, 2017 and 2026
Figure 121: Asia Pacific Automotive VVT System Market Value Share Analysis, by System Type, 2017 and 2026
Figure 122: Asia Pacific Automotive VVT System Market Value Share Analysis, by Number of Valves, 2017 and 2026
Figure 123: Asia Pacific Automotive VVT System Market Value Share Analysis, by Technology, 2017 and 2026
Figure 124: Asia Pacific Automotive VVT System Market Value Share Analysis, by Methods, 2017 and 2026
Figure 125: Asia Pacific Automotive VVT System Market Value Share Analysis, by Actuation Type, 2017 and 2026
Figure 126: Asia Pacific Automotive VVT System Market Value Share Analysis, by Vehicle Type, 2017 and 2026
Figure 127: Asia Pacific Automotive VVT System Market Value Share Analysis, by Sales Channel, 2017 and 2026
Figure 128: Asia Pacific Automotive VVT System Market Value Share Analysis, by Country and Sub-regions, 2017 and 2026
Figure 129: Asia Pacific Automotive VVT System Market Attractiveness Analysis, by Valve Train
Figure 130: Asia Pacific Automotive VVT System Market Attractiveness Analysis, by Fuel Type
Figure 131: Asia Pacific Automotive VVT System Market Attractiveness Analysis, by System Type
Figure 132: Asia Pacific Automotive VVT System Market Attractiveness Analysis, by Number of Valves
Figure 133: Asia Pacific Automotive VVT System Market Attractiveness Analysis, by Technology
Figure 134: Asia Pacific Automotive VVT System Market Attractiveness Analysis, by Methods
Figure 135: Asia Pacific Automotive VVT System Market Attractiveness Analysis, by Actuation Type
Figure 136: Asia Pacific Automotive VVT System Market Attractiveness Analysis, by Vehicle Type
Figure 137: Asia Pacific Automotive VVT System Market Attractiveness Analysis, by Sales Channel
Figure 138: Middle East & Africa Automotive VVT System Market Size (US$ Mn) and Volume (Million Units) Forecast, 2017–2026
Figure 139: Middle East & Africa Automotive VVT System Market Attractiveness Analysis, by Country and Sub-regions
Figure 140: Middle East & Africa Automotive VVT System Market Value Share Analysis, by Valve Train, 2017 and 2026
Figure 141: Middle East & Africa Automotive VVT System Market Value Share Analysis, by Fuel Type, 2017 and 2026
Figure 142: Middle East & Africa Automotive VVT System Market Value Share Analysis, by System Type, 2017 and 2026
Figure 143: Middle East & Africa Automotive VVT System Market Value Share Analysis, by Number of Valves, 2017 and 2026
Figure 144: Middle East & Africa Automotive VVT System Market Value Share Analysis, by Technology, 2017 and 2026
Figure 145: Middle East & Africa Automotive VVT System Market Value Share Analysis, by Methods, 2017 and 2026
Figure 146: Middle East & Africa Automotive VVT System Market Value Share Analysis, by Actuation Type, 2017 and 2026
Figure 147: Middle East & Africa Automotive VVT System Market Value Share Analysis, by Vehicle Type, 2017 and 2026
Figure 148: Middle East & Africa Automotive VVT System Market Value Share Analysis, by Sales Channel, 2017 and 2026
Figure 149: Middle East & Africa Automotive VVT System Market Value Share Analysis, by Country and Sub-regions, 2017 and 2026
Figure 150: Middle East and Africa Automotive VVT System Market Attractiveness Analysis, by Valve Train
Figure 151: Middle East and Africa Automotive VVT System Market Attractiveness Analysis, by Fuel Type
Figure 152: Middle East and Africa Automotive VVT System Market Attractiveness Analysis, by System Type
Figure 153: Middle East and Africa Automotive VVT System Market Attractiveness Analysis, by Number of Valves
Figure 154: Middle East and Africa Automotive VVT System Market Attractiveness Analysis, by Technology
Figure 155: Middle East and Africa Automotive VVT System Market Attractiveness Analysis, by Methods
Figure 156: Middle East and Africa Automotive VVT System Market Attractiveness Analysis, by Actuation Type
Figure 157: Middle East and Africa Automotive VVT System Market Attractiveness Analysis, by Vehicle Type
Figure 158: Middle East and Africa Automotive VVT System Market Attractiveness Analysis, by Sales Channel
Copyright © Transparency Market Research, Inc. All Rights reserved
Trust Online

Automotive VVT System Market