
Reports
Reports
Global Automated Sample Storage Systems Market: Snapshot
Automated sample storage systems are computer controlled storage devices used for the preservation of samples such as chemical compounds and biological samples. These systems help laboratory facilities store and retrieve samples efficiently as and when required. The sample storage systems vary from manually controlled, relatively simple and small storage operating devices to large computer controlled automated storage devices. Automated sample storage systems help reduce labor costs and lower essential workforce requirements, improving workplace safety and taking personnel out from difficult working conditions such as cold storage environments.
These systems also help in improving space utilization and increasing storage density, both horizontally and vertically. Nowadays, long-term automated sample storage systems are a requirement for almost every research laboratory. Therefore, this sector has raised the opportunity for business investment. A large number of samples can be stored at individual biobanks with the help of automated sample storage systems, instead of installing devices in separate institutes at the regional and national levels. This is likely to drive demand from the automated sample storage systems market in the 2017-2025 forecast period.
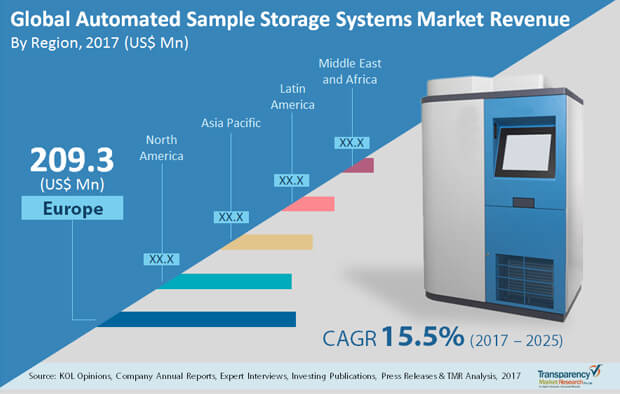
The global automated sample storage systems market is expected to rise from US$617 mn to close to US$2 bn over the 2017-2025 forecast period, exhibiting a robust 15.5% CAGR.
Pharma and Biotech Sector to Dominate Demand from Automated Storage Systems Market
The automated sample storage systems market is segmented by product type, application type, capacity, end user, and region. Based on product type, the automated sample storage systems market is segmented into systems units and reagents and consumables. The reagents and consumables segment dominates the global automated sample storage systems market, accounting for the largest market share in 2016. The segment is anticipated to dominate the automated sample storage system market during the forecast period owing to increasing demand and adoption of automated sample storage systems worldwide.
Based on application type, the automated sample storage systems market is segmented into biological sample storage and compound storage. The biological sample storage segment accounted for largest market share for automated sample storage systems in 2016 due to increasing adoption of automation by biobanks and research laboratories.
Based on capacity, the automated sample storage systems market is segmented into less than 100K samples, 100K - 500K samples, 500K - 2M samples, and more than 2M samples. The less than 100K samples segment accounts for the largest share in the automated sample storage systems market due to the high demand for small capacity storage systems from biobanks and research laboratories.
Based on end user, automated sample storage systems market is segmented into pharmaceutical and biotech companies, academic research labs, private biobanks, and others. Pharmaceutical and biotech companies accounted for the largest market share for automated sample storage systems in 2016 due to increasing demand for compound storage in drug discovery application from pharmaceutical and biotech companies. The growing government support to drug discovery programs in developed Western economies is thus likely to remain a key driver for the global automated sample storage systems market in the coming years.
Asia Pacific to Exhibit Rapid Rise in Automated Sample Storage Systems Market
The global automated sample storage systems market has been segmented into five major regions, namely, North America, Europe, Asia Pacific, Latin America, and the Middle East and Africa., which are further categorized into various countries under each region. Europe dominated the global automated sample storage systems market in 2016 owing to high demand of automated sample storage systems in the region. The Europe automated sample storage systems market was valued at close to US$210 mn in 2017, and is likely to more than triple in valuation over the 2017-2025 forecast period at a steady 15.3% CAGR.
Asia Pacific is projected to constitute the highest growth rate over the forecast period owing to increasing adoption of automated sample storage systems among contract research organizations, research laboratories, and biobanks in the region. The regional market’s projected 19.4% CAGR is expected to propel the market from a 2017 valuation of US$119.5 mn to a 2025 valuation of US$493.5 mn.
Brooks Automation, Inc. dominated the global automated sample storage systems market in 2016. The major factors responsible for its dominance are widespread market presence, innovative product catalog, and huge investment in R&D. Other major players in the automated sample storage systems market include TTP LabTech, Thermo Fisher Scientific, Inc., Angelantoni Life Science, LiCONiC AG, Panasonic Healthcare Co., Ltd., Biotron Healthcare, Haier BioMedical (Haier Group), ASKION, and Tsubakimoto Chain Co.
Section 1 Preface
1.1 Report Scope and Market Segmentation
1.2 Research Highlights
Section 2 Assumptions and Research Methodology
2.1 Assumptions
2.2 Research Methodology
Section 3 Executive Summary
3.1 Global Automated Sample Storage Systems Market Snapshot, 2016
3.2 Global Automated Sample Storage Systems Market: Opportunity Map
Section 4 Market Overview
4.1 Overview
4.2 Global Automated Sample Storage Systems Market Size (US$ Mn) Forecast, 2015–2025
4.3 Global Automated Sample Storage Systems Market Outlook
4.4 Global Automated Sample Storage Systems Market: Key Industry Events
4.5 Global Automated Sample Storage Systems Market: Porter's Analysis
4.6 Decision Making Process for Purchase of Automated Sample Storage Systems
4.7 Automated Sample Storage Systems: Budgets & Return on Investment
4.8 Automated Sample Storage Systems: R&D Scenario
4.9 Automated Sample Storage Systems: Market Entry Challenges
Section 5 Market Dynamics
5.1 Drivers
5.1.1 Increased demand for high level of integrity for critical samples
5.1.2 Growth in drug discovery and clinical diagnostic processes
5.1.3 Increasing public-private relationships in biobanking
5.1.4 Cost cutting through reduced lab professionals
5.1.5 Strategic alliance by leading market players
5.1.6 Miniaturization of processes resulting in low reagent costs and high productivity
5.2 Restraints
5.2.1 High initial investment
5.2.2 Lack of planning for technology development
5.2.3 Low priority/limited adoption for lab automation among small & medium-sized laboratories
5.2.4 Compatibility and portability of existing system
5.3 Opportunity Analysis
5.4 Opportunities
5.4.1 Increasing use in biorepositories
5.4.2 Automation in microbiology & cancer research
5.5 Key Trends
5.5.1 Increasing number of private biobanks
5.5.2 Funding for biobanks
5.5.3 Introduction of new pricing models to make expensive drugs more affordable
Section 6 Automated Sample Storage Systems Market Analysis, by Product Type
6.1 Introduction
6.2 Global Automated Sample Storage Systems Market Value Share Analysis, by Product Type
6.3 Automated Sample Storage Systems Market Analysis, by Product Type
6.3.1 System Units
6.3.2 Reagents & Consumables
6.4 Automated Sample Storage Systems Market Attractiveness Analysis, by Product Type
6.5 Key Trends
Section 7 Automated Sample Storage Systems Market Analysis, by Application
7.1 Introduction
7.2 Global Automated Sample Storage Systems Market Value Share Analysis, by Application
7.3 Automated Sample Storage Systems Market Analysis, by Application
7.3.1 Biological Sample Storage
7.3.2 Compound Storage
7.4 Automated Sample Storage Systems Market Attractiveness Analysis, by Application
7.5 Key Trends
Section 8 Automated Sample Storage Systems Market Analysis, by Capacity
8.1 Introduction
8.2 Global Automated Sample Storage Systems Market Value Share Analysis, by Capacity
8.3 Automated Sample Storage Systems Market Analysis, by Capacity
8.3.1 Less Than 100K Samples
8.3.2 100K - 500K Samples
8.3.3 500K - 2M Samples
8.3.4 More Than 2M Samples
8.4 Automated Sample Storage Systems Market Attractiveness Analysis, by Capacity
8.5 Key Trends
Section 9 Automated Sample Storage Systems Market Analysis, by End User
9.1 Introduction
9.2 Global Automated Sample Storage Systems Market Value Share Analysis, by End User
9.3 Automated Sample Storage Systems Market Analysis, by End User
9.3.1 Pharma & Biotech Companies
9.3.2 Academic Research Labs
9.3.3 Private Biobanks
9.3.4 Others
9.4 Automated Sample Storage Systems Market Attractiveness Analysis, by End User
9.5 Key Trends
Section 10 Automated Sample Storage Systems Market Analysis, by Region
10.1 Global Automated Sample Storage Systems Market Snapshot, by Country
10.2 Global Automated Sample Storage Systems Market Value Share Analysis, by Region
10.3 Automated Sample Storage Systems Market Forecast, by Region
10.4 Automated Sample Storage Systems Market Attractiveness Analysis, by Region
Section 11 North America Automated Sample Storage Systems Market Analysis
11.1 Key Findings
11.2 North America Automated Sample Storage Systems Market Overview
11.3 North America Market Value Share Analysis, by Product Type
11.4 North America Market Forecast, by Product Type
11.4.1 System Units
11.4.2 Reagents & Consumables
11.5 North America Market Value Share Analysis, by Application
11.6 North America Market Forecast, by Application
11.6.1 Biological Sample Storage
11.6.2 Compound Storage
11.7 North America Market Value Share Analysis, by Capacity
11.8 North America Market Forecast, by Capacity
11.8.1 Less Than 100K Samples
11.8.2 100K - 500K Samples
11.8.3 500K - 2M Samples
11.8.4 More Than 2M Samples
11.8 North America Market Value Share Analysis, by End User
11.9 North America Market Forecast, by End User
11.9.1 Pharma & Biotech Companies
11.9.2 Academic Research Labs
11.9.3 Private Biobanks
11.9.4 Others
11.10 Market Analysis, by Country
11.11 Market Value Share Analysis, by Country
11.12 Market Size (US$ Mn) Forecast, by Country, 2017–2025
11.12.1 U.S.
11.12.2 Canada
11.13 Market Attractiveness Analysis
11.13.1 By Product Type
11.13.2 By Application
11.13.3 By Capacity
11.13.4 By End User
11.13.5 By Country
11.14 Market Trends
Section 12 Europe Automated Sample Storage Systems Market Analysis
12.1 Key Findings
12.2 Europe Automated Sample Storage Systems Market Overview
12.3 Europe Market Value Share Analysis, by Product Type
12.4 Europe Market Forecast, by Product Type
12.4.1 System Units
12.4.2 Reagents & Consumables
12.5 Europe Market Value Share Analysis, by Application
12.6 Europe Market Forecast, by Application
12.6.1 Biological Sample Storage
12.6.2 Compound Storage
12.7 Europe Market Value Share Analysis, by Capacity
12.8 Europe Market Forecast, by Capacity
12.8.1 Less Than 100K Samples
12.8.2 100K - 500K Samples
12.8.3 500K - 2M Samples
12.8.4 More Than 2M Samples
12.8 Europe Market Value Share Analysis, by End User
12.9 Europe Market Forecast, by End User
12.9.1 Pharma & Biotech Companies
12.9.2 Academic Research Labs
12.9.3 Private Biobanks
12.9.4 Others
12.10 Market Analysis, by Country
12.11 Market Value Share Analysis, by Country
12.12 Market Size (US$ Mn) Forecast, by Country, 2017–2025
12.12.1 Germany
12.12.2 France
12.12.3 U.K.
12.12.4 Rest of Europe
12.13 Market Attractiveness Analysis
12.13.1 By Product Type
12.13.2 By Application
12.13.3 By Capacity
12.13.4 By End User
12.13.5 By Country
12.14 Market Trends
Section 13 Asia Pacific Automated Sample Storage Systems Market Analysis
13.1 Key Findings
13.2 Asia Pacific Automated Sample Storage Systems Market Overview
13.3 Asia Pacific Market Value Share Analysis, by Product Type
13.4 Asia Pacific Market Forecast, by Product Type
13.4.1 System Units
13.4.2 Reagents & Consumables
13.5 Asia Pacific Market Value Share Analysis, by Application
13.6 Asia Pacific Market Forecast, by Application
13.6.1 Biological Sample Storage
13.6.2 Compound Storage
13.7 Asia Pacific Market Value Share Analysis, by Capacity
13.8 Asia Pacific Market Forecast, by Capacity
13.8.1 Less Than 100K Samples
13.8.2 100K - 500K Samples
13.8.3 500K - 2M Samples
13.8.4 More Than 2M Samples
13.8 Asia Pacific Market Value Share Analysis, by End User
13.9 Asia Pacific Market Forecast, by End User
13.9.1 Pharma & Biotech Companies
13.9.2 Academic Research Labs
13.9.3 Private Biobanks
13.9.4 Others
13.10 Market Analysis, by Country
13.11 Market Value Share Analysis, by Country
13.12 Market Size (US$ Mn) Forecast, by Country, 2017–2025
13.12.1 China
13.12.2 Japan
13.12.3 India
13.12.4 Australia & New Zealand
13.12.5 Rest of Asia Pacific
13.13 Market Attractiveness Analysis
13.13.1 By Product Type
13.13.2 By Application
13.13.3 By Capacity
13.13.4 By End User
13.13.5 By Country
13.14 Market Trends
Section 14 China Automated Sample Storage Systems Market Analysis
14.1 Key Findings
14.2 China Automated Sample Storage Systems Market Overview
14.3 China Market Value Share Analysis, by Product Type
14.4 China Market Forecast, by Product Type
14.4.1 System Units
14.4.2 Reagents & Consumables
14.5 China Market Value Share Analysis, by Application
14.6 China Market Forecast, by Application
14.6.1 Biological Sample Storage
14.6.2 Compound Storage
14.7 China Market Value Share Analysis, by Capacity
14.8 China Market Forecast, by Capacity
14.8.1 Less Than 100K Samples
14.8.2 100K - 500K Samples
14.8.3 500K - 2M Samples
14.8.4 More Than 2M Samples
14.8 China Market Value Share Analysis, by End User
14.9 China Market Forecast, by End User
14.9.1 Pharma & Biotech Companies
14.9.2 Academic Research Labs
14.9.3 Private Biobanks
14.9.4 Others
14.10 Market Analysis, by Country
14.11 Market Value Share Analysis, by Country
14.12 Market Attractiveness Analysis
14.12.1 By Product Type
14.12.2 By Application
14.12.3 By Capacity
14.12.4 By End User
14.13 Market Trends
Section 15 Japan Automated Sample Storage Systems Market Analysis
15.1 Key Findings
15.2 Japan Automated Sample Storage Systems Market Overview
15.3 Japan Market Value Share Analysis, by Product Type
15.4 Japan Market Forecast, by Product Type
15.4.1 System Units
15.4.2 Reagents & Consumables
15.5 Japan Market Value Share Analysis, by Application
15.6 Japan Market Forecast, by Application
15.6.1 Biological Sample Storage
15.6.2 Compound Storage
15.7 Japan Market Value Share Analysis, by Capacity
15.8 Japan Market Forecast, by Capacity
15.8.1 Less Than 100K Samples
15.8.2 100K - 500K Samples
15.8.3 500K - 2M Samples
15.8.4 More Than 2M Samples
15.8 Japan Market Value Share Analysis, by End User
15.9 Japan Market Forecast, by End User
15.9.1 Pharma & Biotech Companies
15.9.2 Academic Research Labs
15.9.3 Private Biobanks
15.9.4 Others
15.10 Market Analysis, by Country
15.11 Market Value Share Analysis, by Country
15.12 Market Attractiveness Analysis
15.12.1 By Product Type
15.12.2 By Application
15.12.3 By Capacity
15.12.4 By End User
15.13 Market Trends
Section 16 India Automated Sample Storage Systems Market Analysis
16.1 Key Findings
16.2 India Automated Sample Storage Systems Market Overview
16.3 India Market Value Share Analysis, by Product Type
16.4 India Market Forecast, by Product Type
16.4.1 System Units
16.4.2 Reagents & Consumables
16.5 India Market Value Share Analysis, by Application
16.6 India Market Forecast, by Application
16.6.1 Biological Sample Storage
16.6.2 Compound Storage
16.7 India Market Value Share Analysis, by Capacity
16.8 India Market Forecast, by Capacity
16.8.1 Less Than 100K Samples
16.8.2 100K - 500K Samples
16.8.3 500K - 2M Samples
16.8.4 More Than 2M Samples
16.8 India Market Value Share Analysis, by End User
16.9 India Market Forecast, by End User
16.9.1 Pharma & Biotech Companies
16.9.2 Academic Research Labs
16.9.3 Private Biobanks
16.9.4 Others
16.10 Market Analysis, by Country
16.11 Market Value Share Analysis, by Country
16.12 Market Attractiveness Analysis
16.12.1 By Product Type
16.12.2 By Application
16.12.3 By Capacity
16.12.4 By End User
16.13 Market Trends
Section 17 Australia & New Zealand Automated Sample Storage Systems Market Analysis
17.1 Key Findings
17.2 Australia & New Zealand Automated Sample Storage Systems Market Overview
17.3 Australia & New Zealand Market Value Share Analysis, by Product Type
17.4 Australia & New Zealand Market Forecast, by Product Type
17.4.1 System Units
17.4.2 Reagents & Consumables
17.5 Australia & New Zealand Market Value Share Analysis, by Application
17.6 Australia & New Zealand Market Forecast, by Application
17.6.1 Biological Sample Storage
17.6.2 Compound Storage
17.7 Australia & New Zealand Market Value Share Analysis, by Capacity
17.8 Australia & New Zealand Market Forecast, by Capacity
17.8.1 Less Than 100K Samples
17.8.2 100K - 500K Samples
17.8.3 500K - 2M Samples
17.8.4 More Than 2M Samples
17.8 Australia & New Zealand Market Value Share Analysis, by End User
17.9 Australia & New Zealand Market Forecast, by End User
17.9.1 Pharma & Biotech Companies
17.9.2 Academic Research Labs
17.9.3 Private Biobanks
17.9.4 Others
17.10 Market Analysis, by Country
17.11 Market Value Share Analysis, by Country
17.12 Market Attractiveness Analysis
17.12.1 By Product Type
17.12.2 By Application
17.12.3 By Capacity
17.12.4 By End User
17.13 Market Trends
Section 18 Rest of Asia Pacific Automated Sample Storage Systems Market Analysis
18.1 Key Findings
18.2 Rest of Asia Pacific Automated Sample Storage Systems Market Overview
18.3 Rest of Asia Pacific Market Value Share Analysis, by Product Type
18.4 Rest of Asia Pacific Market Forecast, by Product Type
18.4.1 System Units
18.4.2 Reagents & Consumables
18.5 Rest of Asia Pacific Market Value Share Analysis, by Application
18.6 Rest of Asia Pacific Market Forecast, by Application
18.6.1 Biological Sample Storage
18.6.2 Compound Storage
18.7 Rest of Asia Pacific Market Value Share Analysis, by Capacity
18.8 Rest of Asia Pacific Market Forecast, by Capacity
18.8.1 Less Than 100K Samples
18.8.2 100K - 500K Samples
18.8.3 500K - 2M Samples
18.8.4 More Than 2M Samples
18.8 Rest of Asia Pacific Market Value Share Analysis, by End User
18.9 Rest of Asia Pacific Market Forecast, by End User
18.9.1 Pharma & Biotech Companies
18.9.2 Academic Research Labs
18.9.3 Private Biobanks
18.9.4 Others
18.10 Market Analysis, by Country
18.11 Market Value Share Analysis, by Country
18.12 Market Attractiveness Analysis
18.12.1 By Product Type
18.12.2 By Application
18.12.3 By Capacity
18.12.4 By End User
18.13 Market Trends
Section 19 Latin America Automated Sample Storage Systems Market Analysis
19.1 Key Findings
19.2 Latin America Automated Sample Storage Systems Market Overview
19.3 Latin America Market Value Share Analysis, by Product Type
19.4 Latin America Market Forecast, by Product Type
19.4.1 System Units
19.4.2 Reagents & Consumables
19.5 Latin America Market Value Share Analysis, by Application
19.6 Latin America Market Forecast, by Application
19.6.1 Biological Sample Storage
19.6.2 Compound Storage
19.7 Latin America Market Value Share Analysis, by Capacity
19.8 Latin America Market Forecast, by Capacity
19.8.1 Less Than 100K Samples
19.8.2 100K - 500K Samples
19.8.3 500K - 2M Samples
19.8.4 More Than 2M Samples
19.8 Latin America Market Value Share Analysis, by End User
19.9 Latin America Market Forecast, by End User
19.9.1 Pharma & Biotech Companies
19.9.2 Academic Research Labs
19.9.3 Private Biobanks
19.9.4 Others
19.10 Market Analysis, by Country
19.11 Market Value Share Analysis, by Country
19.12 Market Size (US$ Mn) Forecast, by Country, 2017–2025
19.12.1 Brazil
19.12.2 Mexico
19.12.3 Rest of Latin America
19.13 Market Attractiveness Analysis
19.13.1 By Product Type
19.13.2 By Application
19.13.3 By Capacity
19.13.4 By End User
19.13.5 By Country
19.14 Market Trends
Section 20 Middle East & Africa Automated Sample Storage Systems Market Analysis
20.1 Key Findings
20.2 Middle East & Africa Automated Sample Storage Systems Market Overview
20.3 Middle East & Africa Market Value Share Analysis, by Product Type
20.4 Middle East & Africa Market Forecast, by Product Type
20.4.1 System Units
20.4.2 Reagents & Consumables
20.5 Middle East & Africa Market Value Share Analysis, by Application
20.6 Middle East & Africa Market Forecast, by Application
20.6.1 Biological Sample Storage
20.6.2 Compound Storage
20.7 Middle East & Africa Market Value Share Analysis, by Capacity
20.8 Middle East & Africa Market Forecast, by Capacity
20.8.1 Less Than 100K Samples
20.8.2 100K - 500K Samples
20.8.3 500K - 2M Samples
20.8.4 More Than 2M Samples
20.8 Middle East & Africa Market Value Share Analysis, by End User
20.9 Middle East & Africa Market Forecast, by End User
20.9.1 Pharma & Biotech Companies
20.9.2 Academic Research Labs
20.9.3 Private Biobanks
20.9.4 Others
20.10 Market Analysis, by Country
20.11 Market Value Share Analysis, by Country
20.12 Market Size (US$ Mn) Forecast, by Country, 2017–2025
20.12.1 Saudi Arabia
20.12.2 South Africa
20.12.3 Rest of Middle East & Africa
20.13 Market Attractiveness Analysis
20.13.1 By Product Type
20.13.2 By Application
20.13.3 By Capacity
20.13.4 By End User
20.13.5 By Country
20.14 Market Trends
Section 21 Competition Landscape
21.1 Global Automated Sample Storage Systems Market Share Analysis, by Company, 2016
21.2 Asia Pacific Automated Sample Storage Systems Market Share Ranking by Company, 2016
21.3 Competition Matrix
21.4 Company Profiles
21.4.1 Hamilton Company (Hamilton Storage Technologies, Inc.)
21.4.1.1. Company Overview (HQ, Business Segments, Employee Strength)
21.4.1.2. Financial Overview
21.4.1.3. Product Portfolio
21.4.1.4. SWOT Analysis
21.4.1.5. Strategic Overview
21.4.2 Brooks Automation, Inc.
21.4.2.1. Company Overview (HQ, Business Segments, Employee Strength)
21.4.2.2. Financial Overview
21.4.2.3. Product Portfolio
21.4.2.4. SWOT Analysis
21.4.2.5. Strategic Overview
21.4.3 TTP LabTech
21.4.3.1. Company Overview (HQ, Business Segments, Employee Strength)
21.4.3.2. Financial Overview
21.4.3.3. Product Portfolio
21.4.3.4. SWOT Analysis
21.4.3.5. Strategic Overview
21.4.4 Thermo Fisher Scientific, Inc.
21.4.4.1. Company Overview (HQ, Business Segments, Employee Strength)
21.4.4.2. Financial Overview
21.4.4.3. Product Portfolio
21.4.4.4. SWOT Analysis
21.4.4.5. Strategic Overview
21.4.5 Angelantoni Life Science
21.4.5.1. Company Overview (HQ, Business Segments, Employee Strength)
21.4.5.2. Financial Overview
21.4.5.3. Product Portfolio
21.4.5.4. SWOT Analysis
21.4.5.5. Strategic Overview
21.4.6 LiCONiC AG
21.4.6.1. Company Overview (HQ, Business Segments, Employee Strength)
21.4.6.2. Financial Overview
21.4.6.3. Product Portfolio
21.4.6.4. SWOT Analysis
21.4.6.5. Strategic Overview
21.4.7 Panasonic Healthcare Co., Ltd.
21.4.7.1. Company Overview (HQ, Business Segments, Employee Strength)
21.4.7.2. Financial Overview
21.4.7.3. Product Portfolio
21.4.7.4. SWOT Analysis
21.4.7.5. Strategic Overview
21.4.8 Biotron Healthcare
21.4.8.1. Company Overview (HQ, Business Segments, Employee Strength)
21.4.8.2. Financial Overview
21.4.8.3. Product Portfolio
21.4.8.4. SWOT Analysis
21.4.8.5. Strategic Overview
21.4.9 Haier BioMedical (Haier Group)
21.4.9.1. Company Overview (HQ, Business Segments, Employee Strength)
21.4.9.2. Financial Overview
21.4.9.3. Product Portfolio
21.4.9.4. SWOT Analysis
21.4.9.5. Strategic Overview
21.4.10 ASKION
21.4.10.1. Company Overview (HQ, Business Segments, Employee Strength)
21.4.10.2. Financial Overview
21.4.10.3. Product Portfolio
21.4.10.4. SWOT Analysis
21.4.10.5. Strategic Overview
21.4.11 Tsubakimoto Chain Co.
21.4.11.1. Company Overview (HQ, Business Segments, Employee Strength)
21.4.11.2. Financial Overview
21.4.11.3. Product Portfolio
21.4.11.4. SWOT Analysis
21.4.11.5. Strategic Overview
List of Tables
Table 01: Global Automated Sample Storage Systems Market Size (US$ Mn) Forecast, by Product Type, 2015–2025
Table 02: Global Automated Sample Storage Systems Market Size (US$ Mn) Forecast, by Application, 2015–2025
Table 03: Global Automated Sample Storage Systems Market Size (US$ Mn) Forecast, by Capacity, 2015–2025
Table 04: Global Automated Sample Storage Systems Market Size (US$ Mn) Forecast, by End User, 2015–2025
Table 05: Global Automated Sample Storage Systems Market Size (US$ Mn) Forecast, by Region, 2015–2025
Table 06: North America Automated Sample Storage Systems Market Size (US$ Mn) Forecast, by Country, 2015–2025
Table 07: North America Automated Sample Storage Systems Market Size (US$ Mn) Forecast, by Product Type, 2015–2025
Table 08: North America Automated Sample Storage Systems Market Size (US$ Mn) Forecast, by Application, 2015–2025
Table 09: North America Automated Sample Storage Systems Market Size (US$ Mn) Forecast, by Capacity, 2015–2025
Table 10: North America Automated Sample Storage Systems Market Size (US$ Mn) Forecast, by End-user, 2015–2025
Table 11: Europe Automated Sample Storage Systems Market Size (US$ Mn) Forecast, by Country, 2015–2025
Table 12: Europe Automated Sample Storage Systems Market Size (US$ Mn) Forecast, by Product Type, 2015–2025
Table 13: Europe Automated Sample Storage Systems Market Size (US$ Mn) Forecast, by Application, 2015–2025
Table 14: Europe Automated Sample Storage Systems Market Size (US$ Mn) Forecast, by Capacity, 2015–2025
Table 15: Europe Automated Sample Storage Systems Market Size (US$ Mn) Forecast, by End User, 2015–2025
Table 16: Asia Pacific Automated Sample Storage Systems Market Size (US$ Mn) Forecast, by Country, 2015–2025
Table 17: Asia Pacific Automated Sample Storage Systems Market Size (US$ Mn) Forecast, by Product Type, 2015–2025
Table 18: Asia Pacific Automated Sample Storage Systems Market Size (US$ Mn) Forecast, by Application, 2015–2025
Table 19: Asia Pacific Automated Sample Storage Systems Market Size (US$ Mn) Forecast, by Capacity, 2015–2025
Table 20: Asia Pacific Automated Sample Storage Systems Market Size (US$ Mn) Forecast, by End-user, 2015–2025
Table 21: China Automated Sample Storage Systems Market Size (US$ Mn) Forecast, by Product Type, 2015–2025
Table 22: China Automated Sample Storage Systems Market Size (US$ Mn) Forecast, by Application, 2015–2025
Table 23: China Automated Sample Storage Systems Market Size (US$ Mn) Forecast, by Capacity, 2015–2025
Table 24: China Automated Sample Storage Systems Market Size (US$ Mn) Forecast, by End-user, 2015–2025
Table 25: Japan Automated Sample Storage Systems Market Size (US$ Mn) Forecast, by Product Type, 2015–2025
Table 26: Japan Automated Sample Storage Systems Market Size (US$ Mn) Forecast, by Application, 2015–2025
Table 27: Japan Automated Sample Storage Systems Market Size (US$ Mn) Forecast, by Capacity, 2015–2025
Table 28: Japan Automated Sample Storage Systems Market Size (US$ Mn) Forecast, by End-user, 2015–2025
Table 29: India Automated Sample Storage Systems Market Size (US$ Mn) Forecast, by Product, 2015–2025
Table 30: India Automated Sample Storage Systems Market Size (US$ Mn) Forecast, by Application, 2015–2025
Table 31: India Automated Sample Storage Systems Market Size (US$ Mn) Forecast, by Capacity, 2015–2025
Table 32: India Automated Sample Storage Systems Market Size (US$ Mn) Forecast, by End-user, 2015–2025
Table 33: Australia & New Zealand Automated Sample Storage Systems Market Size (US$ Mn) Forecast, by Product, 2015–2025
Table 34: Australia & New Zealand Automated Sample Storage Systems Market Size (US$ Mn) Forecast, by Application,2015 2025
Table 35: Australia & New Zealand Automated Sample Storage Systems Market Size (US$ Mn) Forecast, by Capacity, 2015–2025
Table 36: Australia & New Zealand Automated Sample Storage Systems Market Size (US$ Mn) Forecast, by End-user, 2015–2025
Table 37: Rest of Asia Pacific Automated Sample Storage Systems Market Size (US$ Mn) Forecast, by Product,
Table 38: Rest of Asia Pacific Automated Sample Storage Systems Market Size (US$ Mn) Forecast, by Application,
Table 39: Rest of Asia Pacific Automated Sample Storage Systems Market Size (US$ Mn) Forecast, by Capacity,
Table 40: Rest of Asia Pacific Automated Sample Storage Systems Market Size (US$ Mn) Forecast, by End-user, 2015–2025
Table 41: Latin America Automated Sample Storage Systems Market Size (US$ Mn) Forecast, by Country, 2015–2025
Table 42: Latin America Automated Sample Storage Systems Market Size (US$ Mn) Forecast, by Product Type, 2015–2025
Table 43: Latin America Automated Sample Storage Systems Market Size (US$ Mn) Forecast, by Application, 2015–2025
Table 44: Latin America Automated Sample Storage Systems Market Size (US$ Mn) Forecast, by Capacity, 2015–2025
Table 45: Latin America Automated Sample Storage Systems Market Size (US$ Mn) Forecast, by End User, 2015–2025
Table 46: Middle East & Africa Automated Sample Storage Systems Market Size (US$ Mn) Forecast, by Country,
Table 47: Middle East & Africa Automated Sample Storage Systems Market Size (US$ Mn) Forecast, by Product Type, 2015–2025
Table 48: Middle East & Africa Automated Sample Storage Systems Market Size (US$ Mn) Forecast, by Application, 2015–2025
Table 49: Middle East & Africa Automated Sample Storage Systems Market Size (US$ Mn) Forecast, by Capacity, 2015–2025
Table 50: Middle East & Africa Automated Sample Storage Systems Market Size (US$ Mn) Forecast, by End-user, 2015–2025
List of Figures
Figure 01: Global Automated Sample Storage Systems Market Size (US$ Mn) and Y-o-Y Growth (%) Projection, 2015–2025
Figure 02: Global Automated Sample Storage Systems Market Value Share, by Product Type, 2017 and 2025
Figure 03: Global Automated Sample Storage Systems Market Attractiveness Analysis, by Product Type, 2017–2025
Figure 04: Global System Unit Market Revenue (US$ Mn) and Y-o-Y Growth (%) Projection, 2015–2025
Figure 05: Global Reagent & Consumables Market Revenue (US$ Mn) and Y-o-Y Growth (%) Projection, 2015–2025
Figure 06: Global Automated Sample Storage Systems Market Value Share, by Application, 2017 and 2025
Figure 07: Global Automated Sample Storage Systems Market Attractiveness Analysis, by Application, 2017–2025
Figure 08: Global Biological Sample Storage Market Revenue (US$ Mn) and Y-o-Y Growth (%), 2015–2025
Figure 09: Global Compound Storage Market Revenue (US$ Mn) and Y-o-Y Growth (%), 2015–2025
Figure 10: Global Automated Sample Storage Systems Market Value Share, by Capacity, 2017 and 2025
Figure 11: Global Automated Sample Storage Systems Market Attractiveness Analysis, by Capacity, 2017–2025
Figure 12: Global Automated Sample Storage Systems Market Revenue (US$ Mn) and Y-o-Y Growth (%), by Less Than 100K Samples, 2015–2025
Figure 13: Global Automated Sample Storage Systems Market Revenue (US$ Mn) and Y-o-Y Growth (%), by 100K - 500K Samples, 2015–2025
Figure 14: Global Automated Sample Storage Systems Market Revenue (US$ Mn) and Y-o-Y Growth (%), by 500K - 2M Samples, 2015–2025
Figure 42: Europe Automated Sample Storage Systems Market Value Share, by Capacity, 2017 and 2025
Figure 43: Europe Automated Sample Storage Systems Market Attractiveness Analysis, by Capacity, 2017–2025
Figure 44: Europe Automated Sample Storage Systems Market Value Share, by End User, 2017 and 2025
Figure 45: Europe Automated Sample Storage Systems Market Attractiveness Analysis, by End User, 2017–2025
Figure 46: Asia Pacific Automated Sample Storage Systems Market Size (US$ Mn) Forecast and Y-o-Y Growth (%) Projection, 2015–2025
Figure 47: Asia Pacific Automated Sample Storage Systems Market Value Share, by Country, 2017 and 2025
Figure 48: Asia Pacific Automated Sample Storage Systems Market Attractiveness, by Country, 2017–2025
Figure 49: Asia Pacific Automated Sample Storage Systems Market Value Share, by Product Type, 2017 and 2025
Figure 50: Asia Pacific Automated Sample Storage Systems Market Attractiveness, by Product Type, 2017–2025
Figure 51: Asia Pacific Automated Sample Storage Systems Market Value Share, by Application, 2017 and 2025
Figure 52: Asia Pacific Automated Sample Storage Systems Market Attractiveness Analysis, by Application, 2017–2025
Figure 53: Asia Pacific Automated Sample Storage Systems Market Value Share, by Capacity, 2017 and 2025
Figure 54: Asia Pacific Automated Sample Storage Systems Market Attractiveness Analysis, by Capacity, 2017–2025
Figure 55: Asia Pacific Automated Sample Storage Systems Market Value Share, by End-user, 2017 and 2025
Figure 56: Asia Pacific Automated Sample Storage Systems Market Attractiveness Analysis, by End-user, 2017–2025
Figure 57: China Automated Sample Storage Systems Market Size (US$ Mn) Forecast and Y-o-Y Growth (%) Projection, 2015–2025
Figure 58: China Automated Sample Storage Systems Market Value Share, by Product Type, 2017 and 2025
Figure 59: China Automated Sample Storage Systems Market Value Share, by Capacity, 2017 and 2025
Figure 60: China Automated Sample Storage Systems Market Value Share, by Application, 2017 and 2025
Figure 61: China Automated Sample Storage Systems Market Value Share, by End-user, 2017 and 2025
Figure 62: China Automated Sample Storage Systems Market Attractiveness Analysis, by Product Type, 2017–2025
Figure 63: China Automated Sample Storage Systems Market Attractiveness Analysis, by Capacity, 2017–2025
Figure 64: China Automated Sample Storage Systems Market Attractiveness Analysis, by Application, 2017–2025
Figure 65: China Automated Sample Storage Systems Market Attractiveness Analysis, by End-user, 2017–2025
Figure 66: Japan Automated Sample Storage Systems Market Size (US$ Mn) Forecast and Y-o-Y Growth (%) Projection, 2015–2025
Figure 67: Japan Automated Sample Storage Systems Market Value Share, by Product Type, 2017 and 2025
Figure 68: Japan Automated Sample Storage Systems Market Value Share, by Capacity, 2017 and 2025
Figure 69: Japan Automated Sample Storage Systems Market Value Share, by Application, 2017 and 2025
Figure 70: Japan Automated Sample Storage Systems Market Value Share, by End-user, 2017 and 2025
Figure 71: Japan Automated Sample Storage Systems Market Attractiveness Analysis, by Product Type, 2017–2025
Figure 72: Japan Automated Sample Storage Systems Market Attractiveness Analysis, by Capacity, 2017–2025
Figure 73: Japan Automated Sample Storage Systems Market Attractiveness Analysis, by Application, 2017–2025
Figure 74: Japan Automated Sample Storage Systems Market Attractiveness Analysis, by End-user, 2017–2025
Figure 75: India Automated Sample Storage Systems Market Size (US$ Mn) Forecast and Y-o-Y Growth Projection (%), 2015–2025
Figure 76: India Automated Sample Storage Systems Market Value Share, by Product, 2017 and 2025
Figure 77: India Automated Sample Storage Systems Market Value Share, by Capacity, 2017 and 2025
Figure 78: India Automated Sample Storage Systems Market Value Share, by Application, 2017 and 2025
Figure 79: India Automated Sample Storage Systems Market Value Share, by End-user, 2017 and 2025
Figure 80: India Automated Sample Storage Systems Market Attractiveness Analysis, by Product, 2017–2025
Figure 81: India Automated Sample Storage Systems Market Attractiveness Analysis, by Capacity, 2017–2025
Figure 82: India Automated Sample Storage Systems Market Attractiveness Analysis, by Application, 2017–2025
Figure 83: India Automated Sample Storage Systems Market Attractiveness Analysis, by End-user, 2017–2025
Figure 84: Australia & New Zealand Automated Sample Storage Systems Market Size (US$ Mn) Forecast and Y-o-Y Growth Projection (%), 2015–2025
Figure 85: Australia & New Zealand Automated Sample Storage Systems Market Value Share, by Product, 2017 and 2025
Figure 86: Australia & New Zealand Automated Sample Storage Systems Market Value Share, by Capacity, 2017 and 2025
Figure 87: Australia & New Zealand Automated Sample Storage Systems Market Value Share, by Application, 2017 and 2025
Figure 88: Australia & New Zealand Automated Sample Storage Systems Market Value Share, by End-user, 2017 and 2025
Figure 89: Australia & New Zealand Automated Sample Storage Systems Market Attractiveness Analysis, by Product, 2017–2025
Figure 90: Australia & New Zealand Automated Sample Storage Systems Market Attractiveness Analysis, by Capacity, 2017–2025
Figure 91: Australia & New Zealand Automated Sample Storage Systems Market Attractiveness Analysis, by Application, 2017–2025
Figure 92: Australia & New Zealand Automated Sample Storage Systems Market Attractiveness Analysis, by End-user, 2017–2025
Figure 93: Rest of Asia Pacific Automated Sample Storage Systems Market Size (US$ Mn) Forecast and Y-o-Y Growth Projection (%), 2015–2025
Figure 94: Rest of Asia Pacific Automated Sample Storage Systems Market Value Share, by Product, 2017 and 2025
Figure 95: Rest of Asia Pacific Automated Sample Storage Systems Market Value Share, by Capacity, 2017 and 2025
Figure 96: Rest of Asia Pacific Automated Sample Storage Systems Market Value Share, by Application, 2017 and 2025
Figure 97: Rest of Asia Pacific Automated Sample Storage Systems Market Value Share, by End-user, 2017 and 2025
Figure 98: Rest of Asia Pacific Automated Sample Storage Systems Market Attractiveness Analysis, by Product, 2017–2025
Figure 99: Rest of Asia Pacific Automated Sample Storage Systems Market Attractiveness Analysis, by Capacity, 2017–2025
Figure 100: Rest of Asia Pacific Automated Sample Storage Systems Market Attractiveness Analysis, by Application, 2017–2025
Figure 101: Rest of Asia Pacific Automated Sample Storage Systems Market Attractiveness Analysis, by End-user, 2017–2025
Figure 102: Latin America Automated Sample Storage Systems Market Size (US$ Mn) Forecast and Y-o-Y Growth Projection (%), 2015–2025
Figure 103: Latin America Automated Sample Storage Systems Market Value Share, by Country, 2017 and 2025
Figure 104: Latin America Automated Sample Storage Systems Market Attractiveness, by Country, 2017–2025
Figure 105: Latin America Automated Sample Storage Systems Market Value Share, by Product Type, 2017 and 2025
Figure 106: Latin America Automated Sample Storage Systems Market Attractiveness, by Product Type, 2017–2025
Figure 107: Latin America Automated Sample Storage Systems Market Value Share, by Application Type, 2017 and 2025
Figure 108: Latin America Automated Sample Storage Systems Market Attractiveness Analysis, by Application Type, 2017–2025
Figure 109: Latin America Automated Sample Storage Systems Market Value Share, by Capacity, 2017 and 2025
Figure 110: Latin America Automated Sample Storage Systems Market Attractiveness Analysis, by Capacity, 2017–2025
Figure 111: Latin America Automated Sample Storage Systems Market Value Share, by End User, 2017 and 2025
Figure 112: Latin America Automated Sample Storage Systems Market Attractiveness Analysis, by End User, 2017–2025
Figure 113: Middle East & Africa Automated Sample Storage Systems Market Size (US$ Mn) Forecast and Y-o-Y Growth Projection (%), 2015–2025
Figure 114: Middle East & Africa Automated Sample Storage Systems Market Value Share, by Country, 2017 and 2025
Figure 115: Middle East & Africa Automated Sample Storage Systems Market Attractiveness, by Country, 2017–2025
Figure 116: Middle East & Africa Automated Sample Storage Systems Market Value Share, by Product Type, 2017 and 2025
Figure 117: Middle East & Africa Automated Sample Storage Systems Market Attractiveness, by Product Type, 2017–2025
Figure 118: Middle East & Africa Automated Sample Storage Systems Market Value Share, by Application, 2017 and 2025
Figure 119: Middle East & Africa Automated Sample Storage Systems Market Attractiveness Analysis, by Application, 2017–2025
Figure 120: Middle East & Africa Automated Sample Storage Systems Market Value Share, by Capacity, 2017 and 2025
Figure 121: Middle East & Africa Automated Sample Storage Systems Market Attractiveness Analysis, by Capacity, 2017–2025
Figure 122: Middle East & Africa Automated Sample Storage Systems Market Value Share, by End-user, 2017 and 2025
Figure 123: Middle East & Africa Automated Sample Storage Systems Market Attractiveness Analysis, by End-user, 2017–2025
Figure 124: Global Automated Sample Storage Systems Market Share Analysis, by Company, 2016
Copyright © Transparency Market Research, Inc. All Rights reserved
Trust Online

Automated Sample Storage Systems Market