
Reports
Reports
Asia Pacific Single-use Bioprocessing Systems Market: Snapshot
The market for single-use bioprocessing systems in Asia Pacific has witnessed an impressive rise since its inception and is expected to remain growing significantly, thanks to the rising adoption of single-use technology among small biotechnology startups and biopharmaceutical enterprises. As the biopharmaceutical industry is maturing, organizations across Asia Pacific are progressively focusing on finding innovative treatment solutions, which are not only different from their competitors, but also have a reduced pipeline for development that helps in bringing the product faster to the market.
Since single-use bioprocessing systems allow biopharmaceutical organizations to speed-up the research and development activities and scale up the process from pilot level to production level for the manufacturing of biopharmaceuticals, with the added advantage of reduced investment and production costs, their popularity has substantially increased, which is reflecting on their demand. The rising usage of single-use bioprocess systems at the manufacturing stage in the cGMP production of biologics is likely to boost this market over the forthcoming years.
The Asia Pacific market for single-use bioprocessing systems, which stood at US$495.0 mn in 2015, is expected to increase at a CAGR of 12.50% between 2016 and 2024 and touch a value of US$1,417.2 mn by the end of 2024.
Demand for Single-use Bags to Remain Strong
Single-use bioreactors, mixers, bags, tubing, bioprocess containers, filtration devices, sampling systems, connectors and clamps, and probes and sensors are the key products available in the Asia Pacific market for single-use bioprocessing systems. The demand for single-use bags is higher than other products in this market. Due to the higher rate of product adoption in research labs and pilot scale bioprocessing plants, supported by their cost effectiveness, this segment is likely to remain witnessing strong growth over the next few years. Single-use bioreactors are also expected to witness healthy growth in their demand in the near future.
Vaccine production, biosimilar, blood plasma products, cell therapy, and several other bio pharma products have emerged as the key application areas of single-use bioprocessing systems. Vaccine production segment has been reporting the most prominent demand for these systems. Researchers expect this scenario to continue like this in the near future, thanks to the acceleration in the fields of drug discovery and the increasing prevalence of chronic diseases in Asia Pacific.
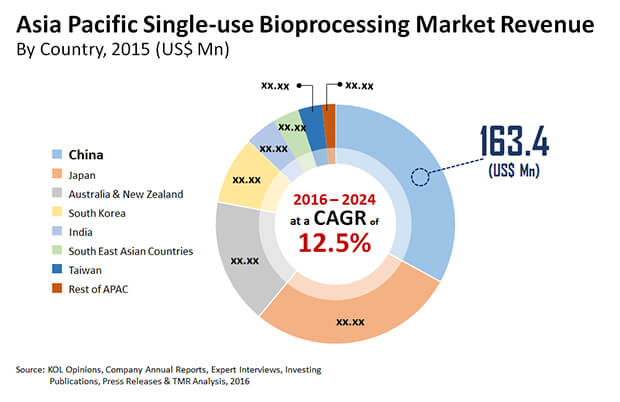
China to Continue Leading Asia Pacific Single-use Bioprocessing Systems Market
Geographically, the Asia Pacific market for single-use bioprocessing systems has spread across China, Japan, India, South Korea, Taiwan, Australia and New Zealand, South East Asian countries and the Rest of Asia Pacific. In 2015, China led the overall market with a share of 33.0% on the grounds of new product launches. Over the forthcoming years, the domestic market is likely to remain on the top, thanks to the presence of a large pool of players.
Japan stood second in the Asia Pacific market for single-use bioprocessing systems in 2015. Expanding at an exponential growth rate compared to other domestic markets, it is likely to witness a high rise in its market share. The increasing demand for cost effective and prefabricated modular bioprocessing facilities, introduction of new products, and the expansion in the pharmaceutical and biotechnology industry are expected to boost the Japan single-use bioprocessing systems market in the years to come.
At the forefront of the Asia Pacific market for single-use bioprocessing systems are Danaher Corp., Eppendorf AG, Finesse Solutions, GE Healthcare, Colder Products Co., Merck KgaA, Parker Hannifin Corp., CESCO Bioengineering Co. Ltd., Saint-Gobain, Sartorius AG, Corning Inc., Thermo Fisher Scientific Inc., and Cole - Parmer Instrument Co. LLC.
Increasing Adoption by Biotechnological Startups to Augment Growth of Single-Use Bioprocessing Systems Market
Single-use bioprocessing gear has gotten all around acknowledged innovation in a generally brief timeframe. Expendable gadgets and segments have made market specialties and new sections that keep on developing. The market for single-use bioprocessing systems in Asia Pacific has seen an amazing ascent since its origin and is relied upon to stay developing essentially, because of the rising appropriation of single-use innovation among little biotechnology new companies and biopharmaceutical endeavors. As the biopharmaceutical business is developing, associations across Asia Pacific are dynamically zeroing in on finding creative treatment arrangements, which are unique in relation to their rivals, yet additionally have a diminished pipeline for improvement that helps in bringing the item quicker to the market.
The rising number of uses of single-use bioprocessing systems and the decreased time devoured by sanitize set up and clean set up are a portion of the central point that are relied upon to support the development of the general market all through the estimate period. Then again, the absence of mindfulness in regards to inventive dispensable items and specialized challenges are projected to confine the development of the market sooner rather than later. Regardless, the prerequisite of low capital speculation and cost adequacy are probably going to offer promising development openings in the coming years.
One of the key boundaries that have brought about the quick appropriation of SUT-based cycle lines is adaptability and speed offered by single-use items while downplaying complete working use. Likewise, the presentation of robotization and insightful bio manufacturing has supported the effectiveness of SUTs dramatically. With the rising headways, the entrance of the single-use bioprocessing model is required to increment significantly.
The market for single-use bioprocessing is expected to join huge information based AI in the coming years. This would bring about the presentation of insightful models that would empower forecast and improvement in measure boundaries to help item yields. The developing revenue of financial backers to subsidize the joining of inventive advances, like mechanization and huge information, with SUS is expected to drive advancements in the space.
Chapter 1 Preface
1.1 Market Definition and Scope
1.2 Market Segmentation
1.3 Key Research Objectives
1.4 Research Highlights
Chapter 2 Assumptions and Research Methodology
Chapter 3 Executive Summary: Asia Pacific Single-use Bioprocessing Systems Market
Chapter 4 Market Overview
4.1 Introduction & Overview of Processes
4.2 Regulatory Scenario
4.3 Key Industry Developments
4.4 Average Pricing Analysis
4.5 Market Dynamics
4.6.1 Drivers
4.6.2 Restraints
4.6.3 Opportunities
4.7 Value Chain Analysis
4.8 Porter's Five Forces Analysis
4.9 Market Outlook
Chapter 5 Asia Pacific Single-use Bioprocessing Systems Market Analysis and Forecast by Product
5.1 Key Findings
5.2 Introduction
5.3 Market Size (US$ Mn) Forecast, By Product
5.3.1 Bioreactors
5.3.2 Mixers
5.3.3 Bags
5.3.4 Tubing
5.3.5 Filtration Devices
5.3.6 Bioprocess Containers
5.3.7 Sampling Systems
5.3.8 Connectors & Clamps
5.4 Market Attractiveness Analysis, By Product, 2015
5.5 Key Trends
Chapter 6 Asia Pacific Single-use Bioprocessing Systems Market Analysis and Forecast by Application
6.1 Key Findings
6.2 Introduction
6.3 Market Size (US$ Mn) Forecast, By Application
6.3.1 Vaccine Production
6.3.2 Biosimilar Production
6.3.3 Blood Plasma Product
6.3.4 Cell Therapy
6.3.5 Others (Biopharma products)
6.4 Market Attractiveness Analysis, By Application, 2015
6.5 Key Trends
Chapter 7 Asia Pacific Single-use Bioprocessing Systems Market Analysis and Forecast by End-user
7.1 Key Findings
7.2 Introduction
7.3 Market Size (US$ Mn) Forecast, By End-user
7.3.1 Pharmaceutical
7.3.2 Biotechnology
7.3.3 CRO & CMO
7.3.4 Academic & Research Institutes
7.4 Market Attractiveness Analysis, By End-user, 2015
7.5 Key Trends
Chapter 8 Asia Pacific Single-use Bioprocessing Systems Market Analysis and Forecast by Country
8.1 Key Findings
8.2 Introduction
8.3 Market Size (US$ Mn) Forecast, By Region
8.3.1 China
8.3.2 Japan
8.3.3 Australia & New Zealand
8.3.4 India
8.3.5 South Korea
8.3.6 Taiwan
8.4.7 South East Asian countries
8.4.8 Rest of APAC
8.4 Market Attractiveness Analysis, By Region, 2015
8.5 Key Trends
Chapter 9 China Single-use Bioprocessing Systems Market Analysis and Forecast
9.1 Key Findings
9.2 Introduction
9.3 Market Size (US$ Mn) Forecast, By Product
9.4 Market Size (US$ Mn) Forecast, By Application
9.5 Market Size (US$ Mn) Forecast, By End-user
9.6 Market Attractiveness Analysis, 2015
9.6.1 By Product
9.6.2 By Application
9.6.3 By End-user
Chapter 10 Japan Single-use Bioprocessing Systems Market Analysis and Forecast
10.1 Key Findings
10.2 Introduction
10.3 Market Size (US$ Mn) Forecast, By Product
10.4 Market Size (US$ Mn) Forecast, By Application
10.5 Market Size (US$ Mn) Forecast, By End-user
10.6 Market Attractiveness Analysis, 2015
10.6.1 By Product
10.6.2 By Application
10.6.3 By End-user
Chapter 11 Australia & New Zealand Single-use Bioprocessing Systems Market Analysis and Forecast
11.1 Key Findings
11.2 Introduction
11.3 Market Size (US$ Mn) Forecast, By Product
11.4 Market Size (US$ Mn) Forecast, By Application
11.5 Market Size (US$ Mn) Forecast, By End-user
11.6 Market Attractiveness Analysis, 2015
11.6.1 By Product
11.6.2 By Application
11.6.3 By End-user
Chapter 12 India Single-use Bioprocessing Systems Market Analysis and Forecast
12.1 Key Findings
12.2 Introduction
12.3 Market Size (US$ Mn) Forecast, By Product
12.4 Market Size (US$ Mn) Forecast, By Application
12.5 Market Size (US$ Mn) Forecast, By End-user
12.6 Market Attractiveness Analysis, 2015
12.6.1 By Product
12.6.2 By Application
12.6.3 By End-user
Chapter 13 South Korea Single-use Bioprocessing Systems Market Analysis and Forecast
13.1 Key Findings
13.2 Introduction
13.3 Market Size (US$ Mn) Forecast, By Product
13.4 Market Size (US$ Mn) Forecast, By Application
13.5 Market Size (US$ Mn) Forecast, By End-user
13.6 Market Attractiveness Analysis, 2015
13.6.1 By Product
13.6.2 By Application
13.6.3 By End-User
Chapter 14 Taiwan Single-use Bioprocessing Systems Market Analysis and Forecast
14.1 Key Findings
14.2 Introduction
14.3 Market Size (US$ Mn) Forecast, By Product
14.4 Market Size (US$ Mn) Forecast, By Application
14.5 Market Size (US$ Mn) Forecast, By End-user
14.6 Market Attractiveness Analysis, 2015
14.6.1 By Product
14.6.2 By Application
14.6.3 By End-user
Chapter 15 South East Asian countries Single-use Bioprocessing Systems Market Analysis and Forecast
15.1 Key Findings
15.2 Introduction
15.3 Market Size (US$ Mn) Forecast, By Product
15.4 Market Size (US$ Mn) Forecast, By Application
15.5 Market Size (US$ Mn) Forecast, By End-user
15.6 Market Attractiveness Analysis, 2015
15.6.1 By Product
15.6.2 By Application
15.6.3 By End-user
Chapter 16 Rest of APAC Single-use Bioprocessing Systems Market Analysis and Forecast
16.1 Key Findings
16.2 Introduction
16.3 Market Size (US$ Mn) Forecast, By Product
16.4 Market Size (US$ Mn) Forecast, By Application
16.5 Market Size (US$ Mn) Forecast, By End-user
16.6 Market Attractiveness Analysis, 2015
16.6.1 By Product
16.6.2 By Application
16.6.3 By End-user
Chapter 17 Competition Landscape
17.1 Single-use Bioprocessing Systems Market Share Analysis, Key Players, 2015
17.2 Competition Matrix
17.3 Company Profiles
17.3.1 Danaher Corporation (Pall Corporation)
17.3.1.1. Company Overview
17.3.1.2. Company Description
17.3.1.3. SWOT Analysis
17.3.1.4. Key Developments
17.3.1.5. Strategic Overview
17.3.2 Eppendorf AG
17.3.2.1. Company Overview
17.3.2.2. Company Description
17.3.2.3. SWOT Analysis
17.3.2.4. Key Developments
17.3.2.5. Strategic Overview
17.3.3 Finesse Solutions
17.3.3.1. Company Overview
17.3.3.2. Company Description
17.3.3.3. SWOT Analysis
17.3.3.4. Key Developments
17.3.3.5. Strategic Overview
17.3.4 GE Healthcare
17.4.1.1. Company Overview
17.4.1.2. Company Description
17.4.1.3. SWOT Analysis
17.4.1.4. Key Developments
17.4.1.5. Strategic Overview
17.3.5 Colder Products Company (CPC)
17.3.5.1. Company Overview
17.3.5.2. Company Description
17.3.5.3. SWOT Analysis
17.3.5.4. Key Developments
17.3.5.5. Strategic Overview
17.3.6 Merck KGaA (Merck Millipore)
17.3.6.1. Company Overview
17.3.6.2. Company Description
17.3.6.3. SWOT Analysis
17.3.6.4. Key Developments
17.3.6.5. Strategic Overview
17.3.7 Parker Hannifin Corporation
17.3.7.1. Company Overview
17.3.7.2. Company Description
17.3.7.3. SWOT Analysis
17.3.7.4. Key Developments
17.3.7.5. Strategic Overview
17.3.8 CESCO Bioengineering Co., Ltd.
17.3.8.1. Company Overview
17.3.8.2. Company Description
17.3.8.3. SWOT Analysis
17.3.8.4. Key Developments
17.3.8.5. Strategic Overview
17.3.9 Saint-Gobain
17.3.9.1. Company Overview
17.3.9.2. Company Description
17.3.9.3. SWOT Analysis
17.3.9.4. Key Developments
17.3.9.5. Strategic Overview
17.3.10 Sartorius AG
17.3.10.1. Company Overview
17.3.10.2. Company Description
17.3.10.3. SWOT Analysis
17.3.10.4. Key Developments
17.3.10.5. Strategic Overview
17.3.11 Corning Incorporated
17.3.11.1. Company Overview
17.3.11.2. Company Description
17.3.11.3. SWOT Analysis
17.3.11.4. Key Developments
17.3.11.5. Strategic Overview
17.3.12 Thermo Fisher Scientific, Inc.
17.3.12.1. Company Overview
17.3.12.2. Company Description
17.3.12.3. SWOT Analysis
17.3.12.4. Key Developments
17.3.12.5. Strategic Overview
17.3.13 Cole - Parmer Instrument Company, LLC
17.3.13.1. Company Overview
17.3.13.2. Company Description
17.3.13.3. SWOT Analysis
17.3.13.4. Key Developments
17.3.13.5. Strategic Overview
List of Tables
Table 1: Asia Pacific Single-use Bioprocessing Systems Market Size (US$ Mn) Forecast, by Product Type, 2016–2024
Table 2: Asia Pacific Single-use Bioprocessing Systems Market Size (US$ Mn) Forecast, by Application, 2016–2024
Table 3: Asia Pacific Single-use Bioprocessing Systems Market Size (US$ Mn) Forecast, by End-user, 2016–2024
Table 4: Asia Pacific Single-use Bioprocessing Systems Market Size (US$ Mn) Forecast, by Country, 2016–2024
Table 5: China Single-use Bioprocessing Systems Market Size (US$ Mn) Forecast, by Product Type, 2016–2024
Table 6: China Single-use Bioprocessing Systems Market Size (US$ Mn) Forecast, by End-user, 2016–2024
Table 7: China Single-use Bioprocessing Systems Market Size (US$ Mn) Forecast, by Application, 2016–2024
Table 8: Japan Single-use Bioprocessing Systems Market Size (US$ Mn) Forecast, by Product Type, 2016–2024
Table 9: Japan Single-use Bioprocessing Systems Market Size (US$ Mn) Forecast, by End-user, 2016–2024
Table 10: Japan Single-use Bioprocessing Systems Market Size (US$ Mn) Forecast, by Application, 2016–2024
Table 11: Australia & New Zealand Single-use Bioprocessing Systems Market Size (US$ Mn) Forecast, by Product Type,
Table 12: Australia & New Zealand Single-use Bioprocessing Systems Market Size (US$ Mn) Forecast, by End-user, 2016–2024
Table 13: Australia & New Zealand Single-use Bioprocessing Systems Market Size (US$ Mn) Forecast, by Application,
Table 14: India Single-use Bioprocessing Systems Market Size (US$ Mn) Forecast, by Product, 2016–2024
Table 15: India Single-use Bioprocessing Systems Market Size (US$ Mn) Forecast, by End-user, 2016–2024
Table 16: India Single-use Bioprocessing Systems Market Size (US$ Mn) Forecast, by Application, 2016–2024
Table 17: South Korea Single-use Bioprocessing Systems Market Size (US$ Mn) Forecast, by Product Type,
Table 18: South Korea Single-use Bioprocessing Systems Market Size (US$ Mn) Forecast, by End-user, 2016–2024
Table 19: South Korea Single-use Bioprocessing Systems Market Size (US$ Mn) Forecast, by Application, 2016–2024
Table 20: Taiwan Single-use Bioprocessing Systems Market Size (US$ Mn) Forecast, by Product Type,
Table 21: Taiwan Single-use Bioprocessing Systems Market Size (US$ Mn) Forecast, by End-user, 2016–2024
Table 22: Taiwan Single-use Bioprocessing Systems Market Size (US$ Mn) Forecast, by Application, 2016–2024
Table 23: S.E. Asian Countries Single-use Bioprocessing Systems Market Size (US$ Mn) Forecast, by Product Type,
Table 24: S.E. Asian Countries Single-use Bioprocessing Systems Market Size (US$ Mn) Forecast, by End-user, 2016–2024
Table 25: S.E. Asian Countries Single-use Bioprocessing Systems Market Size (US$ Mn) Forecast, by Application, 2016–2024
Table 26: Rest of APAC Single-use Bioprocessing Systems Market Size (US$ Mn) Forecast, by Product Type,
Table 27: Rest of APAC Single-use Bioprocessing Systems Market Size (US$ Mn) Forecast, by End-user, 2016–2024
Table 28: Rest of APAC Single-use Bioprocessing Systems Market Size (US$ Mn) Forecast, by Application, 2016–2024
Table 29: List of Top 5 customers for Single-use Bioprocessing Systems in China
Table 30: List of Top 5 customers for Single-use Bioprocessing Systems in Japan
Table 31: List of Top 5 customers for Single-use Bioprocessing Systems in Australia & New Zealand
Table 32: List of Top 5 customers for Single-use Bioprocessing Systems in India
Table 33: List of Top 5 customers for Single-use Bioprocessing Systems in Korea
Table 34: List of Top 5 customers for Single-use Bioprocessing Systems in Taiwan
Table 35: List of Top 5 customers for Single-use Bioprocessing Systems in South East Asian Countries
List of Figures
Figure 1: Overview of Processes carried out using single-use bioprocessing systems
Figure 2: Standard Single-use Products Value Chain
Figure 3: Custom Single-use Products Value Chain
Figure 5: Asia Pacific Market Value Share, by Application (2016)
Figure 7: Asia Pacific Market Value Share, by End-user (2016)
Figure 4: Asia Pacific Market Value Share, by Product (2016)
Figure 6: Asia Pacific Market Value Share, by Region (2016)
Figure 8: Asia Pacific Single-use Bioprocessing Systems Market Value Share Analysis, by Product Type, 2016 and 2024
Figure 9: Asia Pacific Bioreactors Market Revenue (US$ Mn) Forecast and Y-o-Y Growth (%) Projection, 2014–2024
Figure 10: Asia Pacific Mixers Market Revenue (US$ Mn) Forecast and Y-o-Y Growth (%) Projection, 2014–2024
Figure 11: Asia Pacific Bioprocessing Bags Market Revenue (US$ Mn) Forecast and Y-o-Y Growth (%) Projection, 2014–2024
Figure 12: Asia Pacific Tubing Market Revenue (US$ Mn) Forecast and Y-o-Y Growth (%) Projection, 2014–2024
Figure 13: Asia Pacific Filtration Devices Market Revenue (US$ Mn) Forecast and Y-o-Y Growth (%) Projection, 2014–2024
Figure 14: Asia Pacific Bioprocess Containers Market Revenue (US$ Mn) Forecast and Y-o-Y Growth (%) Projection, 2014–2024
Figure 15: Asia Pacific Sampling Systems Market Revenue (US$ Mn) Forecast and Y-o-Y Growth (%) Projection, 2014–2024
Figure 16: Asia Pacific Connectors & Clamps Market Revenue (US$ Mn) Forecast and Y-o-Y Growth (%) Projection, 2014–2024
Figure 17: Asia Pacific Probes & Sensors Market Revenue (US$ Mn) Forecast and Y-o-Y Growth (%) Projection, 2014–2024
Figure 18: Asia Pacific Single-use Bioprocessing Systems Market Attractiveness Analysis, by Product Type, 2015
Figure 19: Asia Pacific Single-use Bioprocessing Systems Market Value Share Analysis, by Application, 2016 and 2024
Figure 20: Asia Pacific Vaccine Production Market Revenue (US$ Mn) Forecast and Y-o-Y Growth (%) Projection, 2014–2024
Figure 21: Asia Pacific Biosimilars Market Revenue (US$ Mn) Forecast and Y-o-Y Growth (%) Projection, 2014–2024
Figure 22: Asia Pacific Blood Plasma Products Market Revenue (US$ Mn) Forecast and Y-o-Y Growth (%) Projection, 2014–2024
Figure 23: Asia Pacific Cell Therapy Market Revenue (US$ Mn) Forecast and Y-o-Y Growth (%) Projection, 2014–2024
Figure 24: Asia Pacific Others Market Revenue (US$ Mn) Forecast and Y-o-Y Growth (%) Projection, 2014–2024
Figure 25: Asia Pacific Single-use Bioprocessing Systems Market Attractiveness Analysis, by Application, 2015
Figure 26: Asia Pacific Single-use Bioprocessing Systems Market Value Share Analysis, by End- user, 2016 and 2024
Figure 27: Asia Pacific Pharmaceutical Market Revenue (US$ Mn) and Y-o-Y Growth (%), 2014– 2024
Figure 28: Asia Pacific Biotechnology Market Revenue (US$ Mn) and Y-o-Y Growth (%), 2014– 2024
Figure 29: Asia Pacific CRO/CMO Market Revenue (US$ Mn) and Y-o-Y Growth (%), 2014–2024
Figure 30: Asia Pacific Academic & Research Institutes Market Revenue (US$ Mn) and Y-o-Y Growth (%), 2014–2024
Figure 31: Single-use Bioprocessing Systems Market Attractiveness Analysis, by End-user, 2015
Figure 32: Asia Pacific Single-use Bioprocessing Systems Market Revenue (US$ Mn) Forecast, 2014–2024
Figure 33: Asia Pacific Single-use Bioprocessing Systems Market Value Share Analysis, by Region, 2016 and 2024
Figure 34: Asia Pacific Single-use Bioprocessing Systems Market Attractiveness Analysis, by Country, 2015
Figure 35: China Single-use Bioprocessing Systems Market Size (US$ Mn) Forecast, 2014–2024
Figure 36: China Single-use Bioprocessing Systems Market Y-o-Y Growth (%) Projection, 2015– 2024
Figure 37: China Single-use Bioprocessing Systems Market Value Share Analysis, by Product Type, 2016 and 2024
Figure 38: China Single-use Bioprocessing Systems Market Value Share Analysis, by End-user, 2016 and 2024
Figure 39: China Single-use Bioprocessing Systems Market Value Share Analysis, by Application, 2016 and 2024
Figure 40: China Single-use Bioprocessing Systems Market Attractiveness Analysis, by Product Type, 2015
Figure 41: China Single-use Bioprocessing Systems Market Attractiveness Analysis, by Application, 2015
Figure 42: China Single-use Bioprocessing Systems Market Attractiveness Analysis, by End-user, 2015
Figure 43: Japan Single-use Bioprocessing Systems Market Size (US$ Mn) Forecast, 2014–2024
Figure 44: Japan Single-use Bioprocessing Systems Market Y-o-Y Growth (%) Projection, 2015– 2024
Figure 45: Japan Single-use Bioprocessing Systems Market Value Share Analysis, by Product Type, 2016 and 2024
Figure 46: Japan Single-use Bioprocessing Systems Market Value Share Analysis, by End-user, 2016 and 2024
Figure 47: Japan Single-use Bioprocessing Systems Market Value Share Analysis, by Application, 2016 and 2024
Figure 48: Japan Single-use Bioprocessing Systems Market Attractiveness Analysis, by Product Type, 2015
Figure 49: Japan Single-use Bioprocessing Systems Market Attractiveness Analysis, by Application, 2015
Figure 50: Japan Single-use Bioprocessing Systems Market Attractiveness Analysis, by
Figure 51: Australia & New Zealand Single-use Bioprocessing Systems Market Size (US$ Mn) Forecast, 2014–2024
Figure 52: Australia & New Zealand Single-use Bioprocessing Systems Market Y-o-Y Growth (%) Projection, 2015–2024
Figure 53: Australia & New Zealand Single-use Bioprocessing Systems Market Value Share Analysis, by Product Type, 2016 and 2024
Figure 54: Australia & New Zealand Single-use Bioprocessing Systems Market Value Share Analysis, by End-user, 2016 and 2024
Figure 55: Australia & New Zealand Single-use Bioprocessing Systems Market Value Share Analysis, by Application, 2016 and 2024
Figure 56: Australia & New Zealand Single-use Bioprocessing Systems Market Attractiveness Analysis, by Product Type, 2015
Figure 57: Australia & New Zealand Single-use Bioprocessing Systems Market Attractiveness Analysis, by Application, 2015
Figure 58: Australia & New Zealand Single-use Bioprocessing Systems Market Attractiveness Analysis, by End-user, 2015
Figure 59: India Single-use Bioprocessing Systems Market Size (US$ Mn) Forecast, 2014–2024
Figure 60: India Single-use Bioprocessing Systems Market, Y-o-Y Growth (%) Projection, 2015– 2024
Figure 61: India Single-use Bioprocessing Systems Market Value Share Analysis, by Product, 2016 and 2024
Figure 62: India Single-use Bioprocessing Systems Market Value Share Analysis, by End-user, 2016 and 2024
Figure 63: India Single-use Bioprocessing Systems Market Value Share Analysis, by Application, 2016 and 2024
Figure 64: India Single-use Bioprocessing Systems Market Attractiveness Analysis, by Product, 2015
Figure 65: India Single-use Bioprocessing Systems Market Attractiveness Analysis, by Application, 2015
Figure 66: India Single-use Bioprocessing Systems Market Attractiveness Analysis, by End-user, 2015
Figure 67: South Korea Single-use Bioprocessing Systems Market Size (US$ Mn) Forecast, 2014–2024
Figure 68: South Korea Single-use Bioprocessing Systems Market Y-o-Y Growth (%) Projections, 2015–2024
Figure 69: South Korea Market Value Share Analysis, by Product Type, 2016 and 2024
Figure 70: South Korea Market Value Share Analysis, by End-user, 2015 and 2024
Figure 71: South Korea Market Value Share Analysis, by Application, 2015 and 2024
Figure 72: South Korea Single-use Bioprocessing Systems Market Attractiveness Analysis, by Product Type, 2015
Figure 73: South Korea Single-use Bioprocessing Systems Market Attractiveness Analysis, by Application, 2015
Figure 74: South Korea Single-use Bioprocessing Systems Market Attractiveness Analysis, by End-user, 2015
Figure 75: Taiwan Single-use Bioprocessing Systems Market Size (US$ Mn) Forecast, 2014– 2024
Figure 76: Taiwan Single-use Bioprocessing Systems Market Y-o-Y Growth (%) Projections, 2015–2024
Figure 77: Taiwan Market Value Share Analysis, by Product Type, 2016 and 2024
Figure 78: Taiwan Market Value Share Analysis, by End-user, 2016 and 2024
Figure 79: Taiwan Market Value Share Analysis, by Application, 2016 and 2024
Figure 80: Taiwan Single-use Bioprocessing Systems Market Attractiveness Analysis, by Product Type, 2015
Figure 81: Taiwan Single-use Bioprocessing Systems Market Attractiveness Analysis, by Application, 2015
Figure 82: Taiwan Single-use Bioprocessing Systems Market Attractiveness Analysis, by End- user, 2015
Figure 83: S.E. Asian Countries Single-use Bioprocessing Systems Market Size (US$ Mn) Forecast, 2014–2024
Figure 84: S.E. Asian Countries Single-use Bioprocessing Systems Market Y-o-Y Growth (%) Projections, 2015–2024
Figure 85: S.E. Asian Countries Market Value Share Analysis, by Product Type, 2016 and 2024
Figure 86: S.E. Asian Countries Market Value Share Analysis, by End-user, 2016 and 2024
Figure 87: S.E. Asian Countries Market Value Share Analysis, by Application, 2016 and 2024
Figure 88: S.E. Asian Countries Single-use Bioprocessing Systems Market Attractiveness Analysis, by Product Type, 2015
Figure 89: S.E. Asian Countries Single-use Bioprocessing Systems Market Attractiveness Analysis, by Application, 2015
Figure 90: S.E. Asian Countries Single-use Bioprocessing Systems Market Attractiveness Analysis, by End-user, 2015
Figure 91: Rest of APAC Single-use Bioprocessing Systems Market Size (US$ Mn) Forecast, 2014–2024
Figure 92: Rest of APAC Single-use Bioprocessing Systems Market Y-o-Y Growth (%) Projections, 2015–2024
Figure 93: Rest of APAC Market Value Share Analysis, by Product Type, 2016 and 2024
Figure 94: Rest of APAC Market Value Share Analysis, by End-user, 2016 and 2024
Figure 95: Rest of APAC Market Value Share Analysis, by Application, 2016 and 2024
Figure 96: Rest of APAC Single-use Bioprocessing Systems Market Attractiveness Analysis, by Product Type, 2015
Figure 97: Rest of APAC Single-use Bioprocessing Systems Market Attractiveness Analysis, by Application, 2015
Figure 98: Rest of APAC Single-use Bioprocessing Systems Market Attractiveness Analysis, by End-user, 2015
Figure 99: Asia Pacific Single-use Bioprocessing Systems Market Share Analysis, by Company (2015)
Copyright © Transparency Market Research, Inc. All Rights reserved
Trust Online

Asia Pacific Single-use Bioprocessing Systems Market Analysis, 2016-2024