Reports
Reports
The modern foundry industry in India is facing a huge problem of finding new sand sources due to growing mining restrictions. Hence, stakeholders in the Asia Pacific reclamation sand market are turning toward sand reclamation to overcome this issue. As such, the revenue of India is projected for exponential growth in the market landscape and the market is estimated to reach a revenue of ~US$ 2.8 Bn by the end of 2027. Moreover, companies are boosting their credibility credentials on a global level by contributing actively toward environmental protection in cases of scarcity of landfill capacities.
Companies in the market landscape are investing in project-specific systems to cool and de-dust sand. For instance, Giesserei Umwelt Technik GmbH— a specialist for foundry plants, is extensively using project-specific systems that are used as sand coolers and are integrated with a cascade classifier. Thus, companies in the Asia Pacific reclamation sand market should streamline their production practices in a similar way.

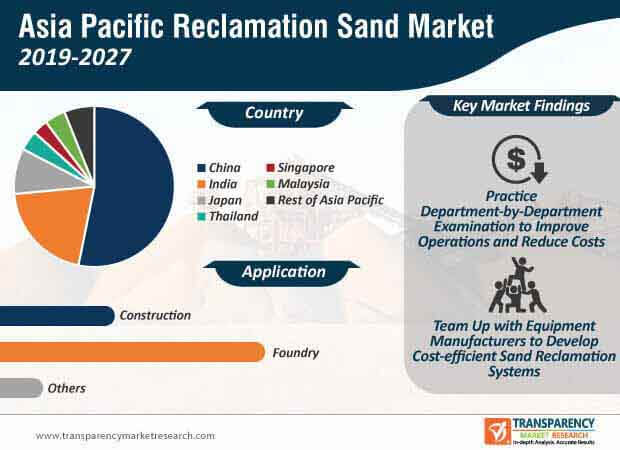
Collaboration has become the key to generate incremental opportunities in the Asia Pacific reclamation sand market. Companies are joining forces to supply sand processing and reclamation systems for projects that are being launched with new foundries. For instance, DIDION-a manufacturer of machinery, including shakeouts and reclamation systems, and Sinto, a trusted manufacturer of foundry equipment, has collaborated with Scania AB, a Swedish manufacturer of commercial vehicles, to supply reclamation systems for Scania’s new foundry in Sweden. Thus, companies in the Asia Pacific reclamation sand market should set their collaboration wheels in motion to capitalize on value-grab opportunities.
The market is projected to grow at a favorable CAGR of ~7% during the forecast period. Equipment companies are increasing their production capabilities to develop novel reclamation systems that crush, scrub, and classify chemically bonded lumps down to grain size. They are also manufacturing systems that can be easily installed and deploy low maintenance costs.
The Asia Pacific reclamation sand market is estimated to reach an output of ~8,300 kilo tons by the end of 2027. However, high costs involved with the sand reclamation procedure are hindering market growth. Hence, companies are increasing their focus on thermal reclamation processes. As such, the revenue of thermal reclamation is projected for aggressive growth in the market landscape. Thus, stakeholders in the Asia Pacific reclamation sand market are benefitting with the advantages of thermal reclamation such as accurate removal of binding agents and the possibility of using complete sand for the production of fresh molding. This indicates that thermal reclamation provides cost and time efficiency for stakeholders.
Thermal reclamation is being highly publicized for producing very less chemically harmful dust in the atmosphere. Companies are streamlining their production practices by conducting the process of thermal reclamation in fluidized beds. This process helps in maintaining the proper shape of sand grains and is clean for further usage by facilitating sand, which is as good as new sand. Such production practices are boosting the credibility of companies in the Asia Pacific reclamation sand market.
Price Rise of Silica Sand Creating Demand for Mechanical Sand Systems
The process of department-by-department examination is casting a spotlight on ways to improve operations and reduce costs. Thus, the Asia Pacific reclamation sand market is continuously growing with high presence of tier 3 players consisting of local and regional companies accounting for a market share of ~30%-40% in 2018. Companies are focusing on available floor space, core & metal removal, and sand mulling & sand delivery for the establishment of sand systems in casting facilities. In chemically bonded molding systems, companies are separating the metal from the sand, prior to reclamation in order to improve the quality of sand.
The recent price increase of silica sand is bolstering the demand for both mechanical and thermal systems in the Asia Pacific reclamation sand market. These trends are encouraging equipment companies to make sand systems financially viable for medium and small-sized casting operations.

Analysts’ Viewpoint
Strategic collaborations between equipment manufacturing companies and metal casting companies can help improve the material flow and handling of add-on projects in the Asia Pacific reclamation sand market. Appropriate screening techniques and magnetic separators are extensively being adopted by companies to efficiently remove impurities in the sand circuit, thus providing a decisive qualitative advantage to companies.
Though rising prices of silica sand are creating a demand for sand reclamation, high costs involved with the sand reclamation procedure and increased generation of chemically harmful dust are slowing down market growth. Hence, companies should collaborate with equipment manufacturing companies who can develop cutting-edge sand reclamation systems that are less capital-intensive and are environment-friendly.
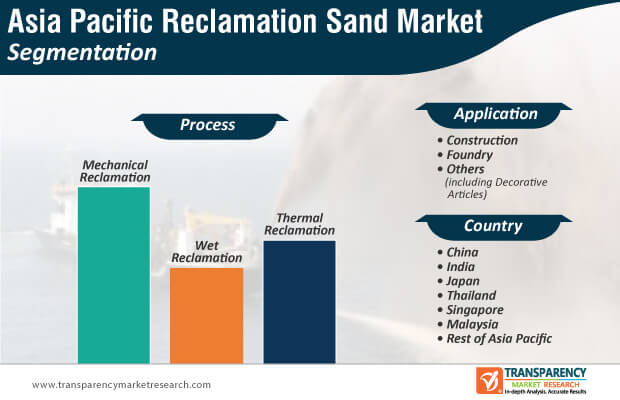
Asia Pacific Reclamation Sand Market: Key Process Segment
Asia Pacific Reclamation Sand Market: Key Application
China to be Highly Lucrative Country of Asia Pacific Reclamation Sand Market
Asia Pacific Reclamation Sand Market: Competition Landscape
1. Executive Summary
1.1. Asia Pacific Reclamation Sand Market Snapshot
1.2. Key Market Trends
1.3. Current Market & Future Potential
1.4. TMR’s Growth Opportunity Wheel
2. Market Overview
2.1. Market Segmentation
2.2. Market Indicators
2.3. Market Definitions
2.4. Market Trends
2.5. Market Dynamics
2.5.1. Drivers
2.5.2. Restraints
2.5.3. Opportunities
2.6. Market Outlook
2.7. Porter’s Five Forces Analysis
2.8. Value Chain Analysis
2.8.1. List of Potential Customers
3. Reclamation Sand Price Trend Analysis, 2018–2027
3.1. By Process
3.2. By Country and Sub-region
4. Asia Pacific Reclamation Sand Market Analysis and Forecast, by Process
4.1. Key Findings, by Process
4.2. Asia Pacific Reclamation Sand Market Volume (Kilo Tons) and Value (US$ Mn) Forecast, by Process, 2018–2027
4.2.1. Mechanical Reclamation
4.2.2. Wet Reclamation
4.2.3. Thermal Reclamation
4.3. Asia Pacific Reclamation Sand Market Attractiveness Analysis, by Process
5. Asia Pacific Reclamation Sand Market Analysis and Forecast, by Application
5.1. Key Findings, by Application
5.2. Asia Pacific Reclamation Sand Market Volume (Kilo Tons) and Value (US$ Mn) Forecast, by Application, 2018–2027
5.2.1. Construction
5.2.2. Foundry
5.2.3. Others
5.3. Asia Pacific Reclamation Sand Market Attractiveness Analysis, by Application
6. Asia Pacific Reclamation Sand Market Analysis and Forecast, by Country and Sub-region
6.1. Asia Pacific Reclamation Sand Market Volume (Kilo Tons) and Value (US$ Mn), by Country and Sub-region, 2018–2027
6.1.1. China
6.1.2. India
6.1.3. Japan
6.1.4. Thailand
6.1.5. Singapore
6.1.6. Malaysia
6.1.7. Rest of Asia Pacific
6.2. Asia Pacific Reclamation Sand Market Attractiveness Analysis, by Country and Sub-region
7. Competition Landscape
7.1. Asia Pacific Reclamation Sand Market Share Analysis, by Company (2018)
7.2. Asia Pacific Reclamation Sand Market Footprint Analysis
7.3. Company Profiles
7.3.1. ASAHI YUKIZAI CORPORATION
7.3.1.1. Company Description
7.3.1.2. Business Overview
7.3.1.3. Financial Overview
7.3.1.4. Strategic Overview
7.3.2. Mangalore Minerals Pvt. Ltd. (MMPL)
7.3.2.1. Company Description
7.3.2.2. Business Overview
7.3.3. Asahi Modi Materials Private Limited
7.3.3.1. Company Description
7.3.3.2. Business Overview
7.3.4. Mangal Minerals
7.3.4.1. Company Description
7.3.4.2. Business Overview
8. Key Primary Insights
List of Tables
Table 01: Asia Pacific Reclamation Sand Market Volume (Kilo Tons) Forecast, by Process, 2018–2027
Table 02: Asia Pacific Reclamation Sand Market Value (US$ Mn) Forecast, by Process, 2018–2027
Table 03: Asia Pacific Reclamation Sand Market Volume (Kilo Tons) Forecast, by Application, 2018–2027
Table 04: Asia Pacific Reclamation Sand Market Value (US$ Mn) Forecast, by Application, 2018–2027
Table 05: Asia Pacific Reclamation Sand Market Volume (Kilo Tons) Forecast, by Country and Sub-region, 2018–2027
Table 06: Asia Pacific Reclamation Sand Market Value (US$ Mn) Forecast, by Country and Sub-region, 2018–2027
Table 07: China Reclamation Sand Market Volume (Kilo Tons) Forecast, by Process, 2018–2027
Table 08: China Reclamation Sand Market Value (US$ Mn) Forecast, by Process, 2018–2027
Table 09: China Reclamation Sand Market Volume (Kilo Tons) Forecast, by Application, 2018–2027
Table 10: China Reclamation Sand Market Value (US$ Mn) Forecast, by Application, 2018–2027
Table 11: India Reclamation Sand Market Volume (Kilo Tons) Forecast, by Process, 2018–2027
Table 12: India Reclamation Sand Market Value (US$ Mn) Forecast, by Process, 2018–2027
Table 13: India Reclamation Sand Market Volume (Kilo Tons) Forecast, by Application, 2018–2027
Table 14: India Reclamation Sand Market Value (US$ Mn) Forecast, by Application, 2018–2027
Table 15: Japan Reclamation Sand Market Volume (Kilo Tons) Forecast, by Process, 2018–2027
Table 16: Japan Reclamation Sand Market Value (US$ Mn) Forecast, by Process, 2018–2027
Table 17: Japan Reclamation Sand Market Volume (Kilo Tons) Forecast, by Application, 2018–2027
Table 18: Japan Reclamation Sand Market Value (US$ Mn) Forecast, by Application, 2018–2027
Table 19: Thailand Reclamation Sand Market Volume (Kilo Tons) Forecast, by Process, 2018–2027
Table 20: Thailand Reclamation Sand Market Value (US$ Mn) Forecast, by Process, 2018–2027
Table 21: Thailand Reclamation Sand Market Volume (Kilo Tons) Forecast, by Application, 2018–2027
Table 22: Thailand Reclamation Sand Market Value (US$ Mn) Forecast, by Application, 2018–2027
Table 23: Singapore Reclamation Sand Market Volume (Kilo Tons) Forecast, by Process, 2018–2027
Table 24: Singapore Reclamation Sand Market Value (US$ Mn) Forecast, by Process, 2018–2027
Table 25: Singapore Reclamation Sand Market Volume (Kilo Tons) Forecast, by Application, 2018–2027
Table 26: Singapore Reclamation Sand Market Value (US$ Mn) Forecast, by Application, 2018–2027
Table 27: Malaysia Reclamation Sand Market Volume (Kilo Tons) Forecast, by Process, 2018–2027
Table 28: Malaysia Reclamation Sand Market Value (US$ Mn) Forecast, by Process, 2018–2027
Table 29: Malaysia Reclamation Sand Market Volume (Kilo Tons) Forecast, by Application, 2018–2027
Table 30: Malaysia Reclamation Sand Market Value (US$ Mn) Forecast, by Application, 2018–2027
Table 31: Rest of Asia Pacific Reclamation Sand Market Volume (Kilo Tons) Forecast, by Process, 2018–2027
Table 32: Rest of Asia Pacific Reclamation Sand Market Value (US$ Mn) Forecast, by Process, 2018–2027
Table 33: Rest of Asia Pacific Reclamation Sand Market Volume (Kilo Tons) Forecast, by Application, 2018–2027
Table 34: Rest of Asia Pacific Reclamation Sand Market Value (US$ Mn) Forecast, by Application, 2018–2027
List of Figures
Figure 01: Asia Pacific Reclamation Sand Market Volume (Kilo Tons) and Value (US$ Mn), 2018–2027
Figure 02: Asia Pacific Reclamation Sand Market Absolute $ Opportunity (US$ Mn), 2018–2027
Figure 03: Price Trend Analysis (US$/Ton), by Process, 2018–2027
Figure 04: Asia Pacific Reclamation Sand Market Volume Share Analysis, by Process
Figure 05: Asia Pacific Reclamation Sand Market Attractiveness Analysis, by Process
Figure 06: Asia Pacific Reclamation Sand Market Volume Share Analysis, by Application
Figure 07: Asia Pacific Reclamation Sand Market Attractiveness Analysis, by Application
Figure 08: Asia Pacific Reclamation Sand Market Volume Share Analysis, by Country and Sub-region
Figure 09: Asia Pacific Reclamation Sand Market Attractiveness Analysis, by Country and Sub-region
Figure 10: Asia Pacific Reclamation Sand Market Share Analysis, by Company, 2018