
Reports
Reports
Antimony, a chemical element, generally exists in non-metallic and metallic forms. The metallic form is made of brittle material and is bright silver. The non-metallic form is grey powder. Static to alkalis and acids, antimony is considered to be a stable element when placed in dry air. Antimony has been witnessed to be bad conductor of heat and electricity, and it swells on cooling. Owing to its high reactivity with chemicals such as copper, silver, lead and sulfur, elemental antimony is present in small proportion.
Surging Demand for Electric Vehicles to Drive Adoption of Antimony
Demand for electric vehicles has surged tremendously over the recent past, owing to increasing environmental concerns and focus on reducing fuel consumption. Lead acid batteries form an integral part of electric vehicles, and antimony is widely used in these batteries. Demand for antimony is also being driven by its use in flame retardant products, and PET production. Over the past few years, there has been an increasing emphasis on development and evaluation of new antimony projects across developed economies. Manufacturers in Europe and North America are making huge investments in procuring and refurbishing old shut down antimony mines.
Antimony is utilized extensively with lead, particularly to increase lead’s strength level in application such as ammunitions. Antimony trioxide is commonly used for various commercial applications including production of glass, textile, rubber, and plastic. However, exposure to antimony results into serious health hazards including skin irritation, lung cancer and breathing disorders. A number of environmental hazards have also been associated with antimony, which in turn has led towards numerous regulations on its adoption.
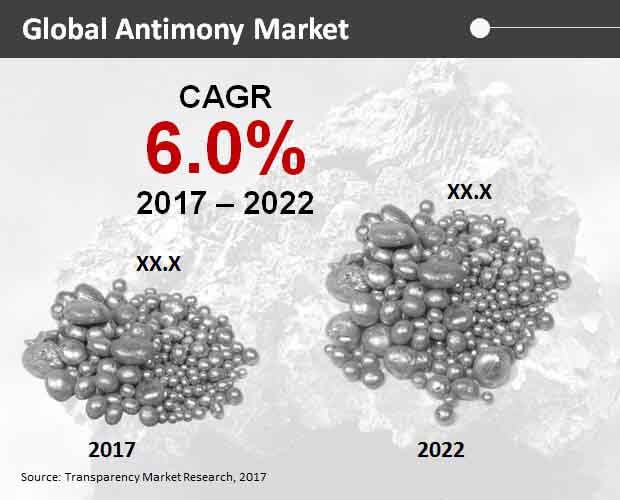
According to a recently delivered report by Transparency Market Research (TMR), the global market for antimony is projected to exhibit an impressive CAGR throughout the forecast period (2017-2022). Global sales of antimony is estimated to surpass US$ 2,000 Mn by 2022-end.
Flame Retardants and Lead Acid Batteries among End Uses to Retain their Dominance in Global Antimony Market
On the basis of end use, flame retardants and lead-acid batteries are anticipated to retain their dominance in the market over 2017 to 2022, in terms of revenues. However, sales of antimony for end use in lead acid batteries will register a comparatively higher CAGR than in flame retardants through 2022. Revenues from end use of antimony in flame retardants are projected to account for over half share of the market in 2017. Demand for antimony in flame retardants will discern a significant decline during the forecast period. Heat stabilizers & plastics, and pigments are expected to remain the least lucrative end uses of antimony, collectively estimated to account for nearly US$ 270 Mn revenues by 2022-end.
APEJ to Dominate Global Antimony Market during 2017 to 2022
Asia-Pacific excluding Japan (APEJ) will dominate the global market for antimony in 2017, and will further retain its dominance in the market until 2022-end. Sales of antimony in APEJ will hold over half revenue share of the global market in 2017. Demand for antimony in this region will witness an upsurge throughout the forecast period. North America and Europe will also remain lucrative markets for antimony. Sales of antimony in North America will register a comparatively faster expansion than in Europe through 2022. Middle East and Africa (MEA) and Japan will remain relatively less lucrative regions for growth of the antimony market.
Company Profiles
TMR’s report has identified key participants actively contributing to expansion of the global antimony market, which include United States Antimony Corp., Atomized Products Group Inc., Nihon Seiko Co., Ltd., Tri-Star Resources plc, American Elements, Mandalay Resources Corp., AMG Advanced Metallurgical Group NV, Hsikwangshan Twinkling Star Antimony Industry Co. Ltd., Belmont Metals Inc., and Shenyang Huachang Antimony Chemical Co. Ltd.
Players in Antimony Market Aim at Improving Toxicity Profile to Spur Demand
Antimony, a semimetallic chemical element, obtained majorly from the ores stibnite (Sb2S3) and valentinite (Sb2O3), also occurs in nature but in traces. Thus, the element exhibits properties of both metals and non-metals. Since ages, the traditional use has been in making beauty products, and healing formulations. In contemporary and modern times, advances in techniques in extracting and purifying have led to the production of the element is sufficient purity. A key driver for the antimony market stems from this. Thus, the utilization of antimony in manufacturing range of semiconductor devices such as diodes and infrared detectors has propelled the opportunity in the market. Alloys of this with the lead also finds some commercial demand. Expanding applications of antimony notably in medical sciences are propelling revenue prospects of the antimony market. A growing body of recent studies have established that antimony belong to the group of leishmanials. Over the past few years, the safety profile of antimony has come under immense scanner, the reason having to do with the interaction of the antimony compounds with amino acids, nucleotides, peptides, enzymes, and proteins. Thus, efforts are ongoing to develop guidelines that reduce the exposure of antibody to prevent serious health impacts on humans. Also, high exposure may also pollute environment with devastating consequences, to plants, domesticated animals, and water bodies.
The COVID-19 outbreaks in 2020 in several countries caused severe repercussions of people’s earning and economic activities in general. In many countries, the pandemic-led lockdowns to stop the surge in caseloads led to vast disruptions in the availability of labor. These led to some of the worst decline in production levels especially of nonessential consumer products. This also altered the course of the growth of the antimony market in large part of 2020. Come 2021, there was a gradual rise in demand in end-use industries, thereby boosting the revenue potential for players in the market.
1. Global Antimony Market
2. Global Antimony Market Overview
2.1. Introduction
2.1.1. Global Antimony Market Taxonomy
2.1.2. Global Antimony Market Definition
2.2. Global Antimony Market Size (US$ Mn) and Forecast, 2012-2022
2.2.1. Global Antimony Market Y-o-Y Growth
2.3. Global Antimony Market Dynamics
2.4. Supply Chain
2.5. Product Life Cycle
2.6. Supplier List
2.7. Average Pricing Analysis
2.8. Regulations
2.9. Key Participants Market Presence (Intensity Map) By Region
3. Global Antimony Market Analysis and Forecast By End Use
3.1. Global Antimony Market Size and Forecast By End Use, 2012-2022
3.1.1. Flame Retardants Market Size and Forecast, 2012-2022
3.1.1.1. Revenue (US$ Mn) Comparison, By Region
3.1.1.2. Market Share Comparison, By Region
3.1.1.3. Y-o-Y growth Comparison, By Region
3.1.2. Lead-acid Batteries Market Size and Forecast, 2012-2022
3.1.2.1. Revenue (US$ Mn) Comparison, By Region
3.1.2.2. Market Share Comparison, By Region
3.1.2.3. Y-o-Y growth Comparison, By Region
3.1.3. Heat Stabilizers and Plastics Market Size and Forecast, 2012-2022
3.1.3.1. Revenue (US$ Mn) Comparison, By Region
3.1.3.2. Market Share Comparison, By Region
3.1.3.3. Y-o-Y growth Comparison, By Region
3.1.4. Pigments Market Size and Forecast, 2012-2022
3.1.4.1. Revenue (US$ Mn) Comparison, By Region
3.1.4.2. Market Share Comparison, By Region
3.1.4.3. Y-o-Y growth Comparison, By Region
4. Global Antimony Market Analysis and Forecast By Region
4.1. Global Antimony Market Size and Forecast, 2012-2022
4.1.1. North America Antimony Market Size and Forecast, 2012-2022
4.1.1.1. Revenue (US$ Mn) Comparison, By End Use
4.1.2. Latin America Antimony Market Size and Forecast, 2012-2022
4.1.2.1. Revenue (US$ Mn) Comparison, By End Use
4.1.3. Europe Antimony Market Size and Forecast, 2012-2022
4.1.3.1. Revenue (US$ Mn) Comparison, By End Use
4.1.4. Japan Antimony Market Size and Forecast, 2012-2022
4.1.4.1. Revenue (US$ Mn) Comparison, By End Use
4.1.5. Japan Antimony Market Size and Forecast, 2012-2022
4.1.5.1. Revenue (US$ Mn) Comparison, By End Use
4.1.6. MEA Antimony Market Size and Forecast, 2012-2022
4.1.6.1. Revenue (US$ Mn) Comparison, By End Use
5. North America Antimony Market Analysis and Forecast, By Country, 2012-2022
5.1. US Antimony Market Size and Forecast, 2012-2022
5.1.1. Revenue (US$ Mn) Comparison, By End Use
5.2. Canada Antimony Market Size and Forecast, 2012-2022
5.2.1. Revenue (US$ Mn) Comparison, By End Use
6. Latin America Antimony Market Analysis and Forecast, By Country, 2012-2022
6.1. Antimony Market Size and Forecast, 2012-2022
6.1.1. Revenue (US$ Mn) Comparison, By End Use
6.2. Mexico Antimony Market Size and Forecast, 2012-2022
6.2.1. Revenue (US$ Mn) Comparison, By End Use
6.3. Argentina Antimony Market Size and Forecast, 2012-2022
6.3.1. Revenue (US$ Mn) Comparison, By End Use
7. Europe Antimony Market Analysis and Forecast, By Country, 2012-2022
7.1. Germany Antimony Market Size and Forecast, 2012-2022
7.1.1. Revenue (US$ Mn) Comparison, By End Use
7.2. France Antimony Market Size and Forecast, 2012-2022
7.2.1. Revenue (US$ Mn) Comparison, By End Use
7.3. U.K. Antimony Market Size and Forecast, 2012-2022
7.3.1. Revenue (US$ Mn) Comparison, By End Use
7.4. Italy Antimony Market Size and Forecast, 2012-2022
7.4.1. Revenue (US$ Mn) Comparison, By End Use
7.5. Spain Antimony Market Size and Forecast, 2012-2022
7.5.1. Revenue (US$ Mn) Comparison, By End Use
7.6. Spain Antimony Market Size and Forecast, 2012-2022
7.6.1. Revenue (US$ Mn) Comparison, By End Use
8. Japan Antimony Market Analysis and Forecast, By Country, 2012-2022
8.1. Russia Antimony Market Size and Forecast, 2012-2022
8.1.1. Revenue (US$ Mn) Comparison, By End Use
9. APEJ Antimony Market Analysis and Forecast, By Country, 2012-2022
9.1. China Antimony Market Size and Forecast, 2012-2022
9.1.1. Revenue (US$ Mn) Comparison, By End Use
9.2. India Antimony Market Size and Forecast, 2012-2022
9.2.1. Revenue (US$ Mn) Comparison, By End Use
9.3. Malaysia Antimony Market Size and Forecast, 2012-2022
9.3.1. Revenue (US$ Mn) Comparison, By End Use
9.4. Thailand Antimony Market Size and Forecast, 2012-2022
9.4.1. Revenue (US$ Mn) Comparison, By End Use
9.5. Singapore Antimony Market Size and Forecast, 2012-2022
9.5.1. Revenue (US$ Mn) Comparison, By End Use
9.6. Australia Antimony Market Size and Forecast, 2012-2022
9.6.1. Revenue (US$ Mn) Comparison, By End Use
10. MEA Antimony Market Analysis and Forecast, By Country, 2012-2022
10.1. GCC Countries Antimony Market Size and Forecast, 2012-2022
10.1.1. Revenue (US$ Mn) Comparison, By End Use
10.2. South Africa Antimony Market Size and Forecast, 2012-2022
10.2.1. Revenue (US$ Mn) Comparison, By End Use
10.3. Northern Africa Antimony Market Size and Forecast, 2012-2022
10.3.1. Revenue (US$ Mn) Comparison, By End Use
11. Global Antimony Market Company Share, Competition Landscape and Company Profiles
11.1. Company Share Analysis
11.2. Competition Landscape
11.3. Company Profiles
11.3.1. United States Antimony Corporation
11.3.2. Atomized Products Group, Inc.
11.3.3. Nihon Seiko Co., Ltd.
11.3.4. Tri-Star Resources Plc
11.3.5. American Elements
11.3.6. Mandalay Resources Corp.
11.3.7. AMG Advanced Metallurgical Group
11.3.8. Hsikwangshan Twinkling Star Co., Ltd.
11.3.9. Belmont Metals, Inc
11.3.10.Shenyang Huachang Antimony Chemical Co. Ltd.
12. Research Methodology
13. Secondary and Primary Sources
14. Assumptions and Acronyms
15. Disclaimer
List of Tables
TABLE 1 Global Antimony Market Value (US$ Mn), 2012-2016
TABLE 2 Global Antimony Market Value (US$ Mn), 2017-2022
TABLE 3 Global Antimony Market Value (US$ Mn) and Y-o-Y, 2015-2022
TABLE 4 Global Flame Retardants Segment Value (US$ Mn), By Region 2012-2016
TABLE 5 Global Flame Retardants Segment Value (US$ Mn), By Region 2017-2022
TABLE 6 Global Flame Retardants Segment Market Share, By Region 2012-2016
TABLE 7 Global Flame Retardants Segment Market Share, By Region 2017-2022
TABLE 8 Global Flame Retardants Segment Y-o-Y, By Region 2015-2022
TABLE 9 Global Lead-acid Batteries Segment Value (US$ Mn), By Region 2012-2016
TABLE 10 Global Lead-acid Batteries Segment Value (US$ Mn), By Region 2017-2022
TABLE 11 Global Lead-acid Batteries Segment Market Share, By Region 2012-2016
TABLE 12 Global Lead-acid Batteries Segment Market Share, By Region 2017-2022
TABLE 13 Global Lead-acid Batteries Segment Y-o-Y, By Region 2015-2022
TABLE 14 Global Heat Stabilizers and Plastics Segment Value (US$ Mn), By Region 2012-2016
TABLE 15 Global Heat Stabilizers and Plastics Segment Value (US$ Mn), By Region 2017-2022
TABLE 16 Global Heat Stabilizers and Plastics Segment Market Share, By Region 2012-2016
TABLE 17 Global Heat Stabilizers and Plastics Segment Market Share, By Region 2017-2022
TABLE 18 Global Heat Stabilizers and Plastics Segment Y-o-Y, By Region 2015-2022
TABLE 19 Global Pigments Segment Value (US$ Mn), By Region 2012-2016
TABLE 20 Global Pigments Segment Value (US$ Mn), By Region 2017-2022
TABLE 21 Global Pigments Segment Market Share, By Region 2012-2016
TABLE 22 Global Pigments Segment Market Share, By Region 2017-2022
TABLE 23 Global Pigments Segment Y-o-Y, By Region 2015-2022
TABLE 24 North America Antimony Market Value (US$ Mn), By End Use 2012-2016
TABLE 25 North America Antimony Market Value (US$ Mn), By End Use 2017-2022
TABLE 26 Latin America Antimony Market Value (US$ Mn), By End Use 2012-2016
TABLE 27 Latin America Antimony Market Value (US$ Mn), By End Use 2017-2022
TABLE 28 Europe Antimony Market Value (US$ Mn), By End Use 2012-2016
TABLE 29 Europe Antimony Market Value (US$ Mn), By End Use 2017-2022
TABLE 30 Japan Antimony Market Value (US$ Mn), By End Use 2012-2016
TABLE 31 Japan Antimony Market Value (US$ Mn), By End Use 2017-2022
TABLE 32 APEJ Antimony Market Value (US$ Mn), By End Use 2012-2016
TABLE 33 APEJ Antimony Market Value (US$ Mn), By End Use 2017-2022
TABLE 34 MEA Antimony Market Value (US$ Mn), By End Use 2012-2016
TABLE 35 MEA Antimony Market Value (US$ Mn), By End Use 2017-2022
TABLE 36 US Antimony Market Value (US$ Mn), By End Use 2012-2016
TABLE 37 US Antimony Market Value (US$ Mn), By End Use 2017-2022
TABLE 38 Canada Antimony Market Value (US$ Mn), By End Use 2012-2016
TABLE 39 Canada Antimony Market Value (US$ Mn), By End Use 2017-2022
TABLE 40 Brazil Antimony Market Value (US$ Mn), By End Use 2012-2016
TABLE 41 Brazil Antimony Market Value (US$ Mn), By End Use 2017-2022
TABLE 42 Mexico Antimony Market Value (US$ Mn), By End Use 2012-2016
TABLE 43 Mexico Antimony Market Value (US$ Mn), By End Use 2017-2022
TABLE 44 Argentina Antimony Market Value (US$ Mn), By End Use 2012-2016
TABLE 45 Argentina Antimony Market Value (US$ Mn), By End Use 2017-2022
TABLE 46 Germany Antimony Market Value (US$ Mn), By End Use 2012-2016
TABLE 47 Germany Antimony Market Value (US$ Mn), By End Use 2017-2022
TABLE 48 France Antimony Market Value (US$ Mn), By End Use 2012-2016
TABLE 49 France Antimony Market Value (US$ Mn), By End Use 2017-2022
TABLE 50 U.K. Antimony Market Value (US$ Mn), By End Use 2012-2016
TABLE 51 U.K. Antimony Market Value (US$ Mn), By End Use 2017-2022
TABLE 52 Italy Antimony Market Value (US$ Mn), By End Use 2012-2016
TABLE 53 Italy Antimony Market Value (US$ Mn), By End Use 2017-2022
TABLE 54 Spain Antimony Market Value (US$ Mn), By End Use 2012-2016
TABLE 55 Spain Antimony Market Value (US$ Mn), By End Use 2017-2022
TABLE 56 Russia Antimony Market Value (US$ Mn), By End Use 2012-2016
TABLE 57 Russia Antimony Market Value (US$ Mn), By End Use 2017-2022
TABLE 58 Japan Antimony Market Value (US$ Mn), By End Use 2012-2016
TABLE 59 Japan Antimony Market Value (US$ Mn), By End Use 2017-2022
TABLE 60 China Antimony Market Value (US$ Mn), By End Use 2012-2016
TABLE 61 China Antimony Market Value (US$ Mn), By End Use 2017-2022
TABLE 62 India Antimony Market Value (US$ Mn), By End Use 2012-2016
TABLE 63 India Antimony Market Value (US$ Mn), By End Use 2017-2022
TABLE 64 Malaysia Antimony Market Value (US$ Mn), By End Use 2012-2016
TABLE 65 Malaysia Antimony Market Value (US$ Mn), By End Use 2017-2022
TABLE 66 Thailand Antimony Market Value (US$ Mn), By End Use 2012-2016
TABLE 67 Thailand Antimony Market Value (US$ Mn), By End Use 2017-2022
TABLE 68 Singapore Antimony Market Value (US$ Mn), By End Use 2012-2016
TABLE 69 Singapore Antimony Market Value (US$ Mn), By End Use 2017-2022
TABLE 70 Australia Antimony Market Value (US$ Mn), By End Use 2012-2016
TABLE 71 Australia Antimony Market Value (US$ Mn), By End Use 2017-2022
TABLE 72 GCC Countries Antimony Market Value (US$ Mn), By End Use 2012-2016
TABLE 73 GCC Countries Antimony Market Value (US$ Mn), By End Use 2017-2022
TABLE 74 South Africa Antimony Market Value (US$ Mn), By End Use 2012-2016
TABLE 75 South Africa Antimony Market Value (US$ Mn), By End Use 2017-2022
TABLE 76 Northern Africa Antimony Market Value (US$ Mn), By End Use 2012-2016
TABLE 77 Northern Africa Antimony Market Value (US$ Mn), By End Use 2017-2022
List of Figures
FIG. 1 Global Antimony Market Value (US$ Mn), 2012-2016
FIG. 2 Global Antimony Market Value (US$ Mn) Forecast, 2017-2022
FIG. 3 Global Antimony Market Value (US$ Mn) and Y-o-Y, 2015-2022
FIG. 4 Global Flame Retardants Segment Market Value (US$ Mn) By Region, 2012-2016
FIG. 5 Global Flame Retardants Segment Market Value (US$ Mn) By Region, 2017-2022
FIG. 6 Global Flame Retardants Segment Y-o-Y Growth Rate, By Region, 2015-2022
FIG. 7 Global Lead-acid Batteries Segment Market Value (US$ Mn) By Region, 2012-2016
FIG. 8 Global Lead-acid Batteries Segment Market Value (US$ Mn) By Region, 2017-2022
FIG. 9 Global Lead-acid Batteries Segment Y-o-Y Growth Rate, By Region, 2015-2022
FIG. 10 Global Heat Stabilizers and Plastics Segment Market Value (US$ Mn) By Region, 2012-2016
FIG. 11 Global Heat Stabilizers and Plastics Segment Market Value (US$ Mn) By Region, 2017-2022
FIG. 12 Global Heat Stabilizers and Plastics Segment Y-o-Y Growth Rate, By Region, 2015-2022
FIG. 13 Global Pigments Segment Market Value (US$ Mn) By Region, 2012-2016
FIG. 14 Global Pigments Segment Market Value (US$ Mn) By Region, 2017-2022
FIG. 15 Global Pigments Segment Y-o-Y Growth Rate, By Region, 2015-2022
FIG. 16 North America Antimony Market Value (US$ Mn), By End Use 2012-2016
FIG. 17 North America Antimony Market Value (US$ Mn), By End Use 2017-2022
FIG. 18 Latin America Antimony Market Value (US$ Mn), By End Use 2012-2016
FIG. 19 Latin America Antimony Market Value (US$ Mn), By End Use 2017-2022
FIG. 20 Europe Antimony Market Value (US$ Mn), By End Use 2012-2016
FIG. 21 Europe Antimony Market Value (US$ Mn), By End Use 2017-2022
FIG. 22 Japan Antimony Market Value (US$ Mn), By End Use 2012-2016
FIG. 23 Japan Antimony Market Value (US$ Mn), By End Use 2017-2022
FIG. 24 APEJ Antimony Market Value (US$ Mn), By End Use 2012-2016
FIG. 25 APEJ Antimony Market Value (US$ Mn), By End Use 2017-2022
FIG. 26 MEA Antimony Market Value (US$ Mn), By End Use 2012-2016
FIG. 27 MEA Antimony Market Value (US$ Mn), By End Use 2017-2022
Copyright © Transparency Market Research, Inc. All Rights reserved
Trust Online

Antimony Market