
Reports
Reports
Nationwide COVID-19 vaccination programs have put pressure on manufacturers in the ampoules market to work at break-neck speeds in order to fulfill the unprecedented demand for vaccines. It has been found that mobile vaccination service in port is an efficient way to save time for seafarers, when time in port is short. This requires all tools such as syringes, needles, ampoules, and PPE (Personal Protective Equipment). The importance of storage equipment has grown since vaccine manufacturers have to guarantee cold chain supplies.
Due to poor demand sentiments for spa, cosmetics, and beauty products, companies in the ampoules market are focusing on essential applications for pharmaceuticals, veterinary, and dental applications. Nevertheless, the burgeoning growth of eCommerce is creating revenue opportunities for manufacturers during the coronavirus crisis.
Glass ampoules are being extensively used for the packaging of injection drugs. However, the contamination of solutions with glass micro-particles on breaking open glass ampoules, the presence of metals and percutaneous injury are leading to risks. Hence, packaging companies should work closely with medical practitioners to increase awareness about team training and information on the use of ampoules, especially in the prophylaxis of accidents and contaminations. Manufacturers should increase their R&D capabilities to develop safer materials to replace glass.
Another strategy to avoid contamination is the use of IV (Intravenous) inline filters for ampoules containing injection drugs.
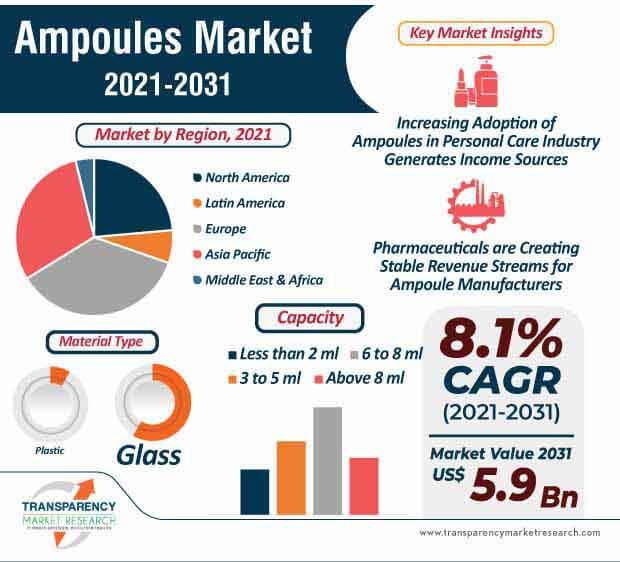
The global ampoules market is expected to surpass a volume of 74,315.8 million units by 2031. Ampoules are being publicized as skin capsules in the cosmetics and beauty industry. These ampoules are being preferred for their compact size and easy to carry convenience during travel. Ampoules contain very high concentrations of active ingredients as compared to an average serum or moisturizer.
Korean-beauty (K-Beauty) skincare routine is acting as a driver for growth in the ampoules market. Although skin capsules are supposed to be used only once or twice a week, growing momentum for K-beauty skincare has compelled manufacturers to design ampoules for daily use.
Apart from cosmetics and beauty, companies in the ampoules market are unlocking growth opportunities in veterinary applications. Packaging of morphine and veterinary etamsylate injection is fueling the demand for ampoules. Veterinary etamsylate injection is being used for the treatment of surgical bleeding, accidental obstetrics, and gynecological applications in animals. These injectables are recommended for dogs, goats, cattle, and the likes.
The ampoules market is projected to surpass the value of US$ 5.9 Bn by 2031. Manufacturers are expanding their supply chains via eCommerce. Veterinary etamsylate injection is gaining popularity as a bleeding prevention injection. The injection is prescribed for the management of blood loss in menorrhagia after surgery. This preventive measure helps to reduce bleeding from very small blood capillaries.
The ampoules market is expected to advance at a robust CAGR of 8.1% during the forecast period. Pharmaceuticals are creating stable revenue streams for ampoule manufacturers. Maddovit B12 oral ampoules have been gaining popularity for its normal energy-yielding metabolism and its role reduction of tiredness & fatigue. The growing demand for innovatively flavored and vegan products is triggering the demand for ampoules.
Secondary packaging and storage components such as ampoule holders are also contributing to the growth of the ampoules market. These holders allow medical practitioners to prepare several injections. Precision injection systems are preferred for line and terminal anesthesia with active suction device. Clamping devices are being developed to allow the cylindrical ampoule holder to be replaced so that several injections or local instillations can be prepared before treatment.
Analysts’ Viewpoint
Mobile vaccination teams are making use of equipment such as syringes, ampoules, and disinfection materials at ports to inoculate seafarers during the ongoing COVID-19 outbreak. Single-dose medicines are fueling the demand for ampoules. However, growing environmental waste due to glass and plastic ampoules is creating concerns for stakeholders in the ampoules market. Hence, stakeholders in the ampoules market should take cues from companies such as UtilVtorProm that are providing professional assistance in the disposal and recycling of ampoules for medical institutes, veterinary services, and warehouse managers, among others. Growing K-beauty skincare routines are creating revenue opportunities for manufacturers in the personal care sector. Oral ampoules containing essential vitamins such as B12 are contributing to market expansion.
|
Attribute |
Detail |
|
Market Size Value in 2020 (Base Year) |
US$ 2.6 Bn |
|
Market Forecast Value in 2031 |
US$ 5.9 Bn |
|
Growth Rate (CAGR) |
8.1% |
|
Forecast Period |
2021-2031 |
|
Quantitative Units |
US$ Mn for Value & Mn Units for Volume |
|
Market Analysis |
This report represent market dynamics of ampoules and lucrative hotspots of the market |
|
Competition Landscape |
Competition analysis section in the report represents 5 years performance of the key players and strategies implement by them along with market share of respective companies in the global market |
|
Format |
Electronic (PDF) + Excel |
|
Market Segmentation |
|
|
Regions Covered |
|
|
Countries Covered |
|
|
Companies Profiled |
|
|
Customization Scope |
Available upon Request |
|
Pricing |
Available upon Request |
1. Executive Summary
1.1. Global Market Overview
1.2. Market Analysis
1.3. TMR Analysis and Recommendations
2. Market Overview
2.1. Market Definition
2.2. Market Taxonomy
3. Key Market Trends
3.1. Key Trends Impacting the Market
3.2. Product Innovation Trends
4. Key Success Factors
4.1. Product Adoption Analysis
4.2. Product USPs / Features
5. Global Ampoules Market Demand Analysis 2014–2020 and Forecast, 2021–2031
5.1. Historical Market Volume (Mn Units) Analysis, 2014–2020
5.2. Current and Future Market Volume (Mn Units) Projections, 2021–2029
5.3. Y-o-Y Growth Trend Analysis
6. Global Ampoules Market - Pricing Analysis
6.1. Pricing Analysis
7. Global Ampoules Demand (Value in US$ Mn) Analysis 2014–2020 and Forecast, 2021–2031
7.1. Historical Market Value (US$ Mn) Analysis, 2014–2020
7.2. Current and Future Market Value (US$ Mn) Projections, 2021–2031
7.2.1.1. Y-o-Y Growth Trend Analysis
7.2.1.2. Absolute $ Opportunity Analysis
8. Market Background
8.1. Global Packaging Market Outlook
8.2. Macro-Economic Factors
8.2.1. Global GDP Growth Outlook
8.2.2. Rigid Packaging Industry Growth
8.2.3. Per Capita Consumption
8.2.4. Covid-19 Impact
8.3. Forecast Factors - Relevance & Impact
8.3.1. Packaging Market Growth
8.3.2. Glass Packaging Market Growth
8.3.3. Pharmaceutical Market Growth
8.3.4. Cosmetics and Beauty Aids Market Growth
8.3.5. Rigid Packaging Market Growth
8.3.6. Segmental Revenue Growth of Key Players
8.3.7. Manufacturing Value Added (M.V.A) Growth
8.3.8. Per Capita Consumption
8.4. Value Chain Analysis
8.4.1. Key Participants
8.4.1.1. Raw Material Suppliers
8.4.1.2. Ampoules Manufacturers
8.4.1.3. Distributors
8.4.1.4. End Users
8.4.2. Profitability Margin
8.5. Market Dynamics
8.5.1. Drivers
8.5.2. Restraints
8.5.3. Opportunity Analysis
9. Impact of COVID-19
9.1. Current Statistics and Probable Future Impact
9.2. Impact of COVID-19 on Ampoules Market
10. Global Ampoules Market Analysis 2014–2020 and Forecast 2021–2031, by Material Type
10.1. Introduction
10.2. Historical Market Size (US$ Mn) and Volume (Mn Units) Analysis, by Material Type, 2014–2020
10.3. Current and Future Market Size (US$ Mn) and Volume (Mn Units) Analysis and Forecast, by Material Type, 2021–2031
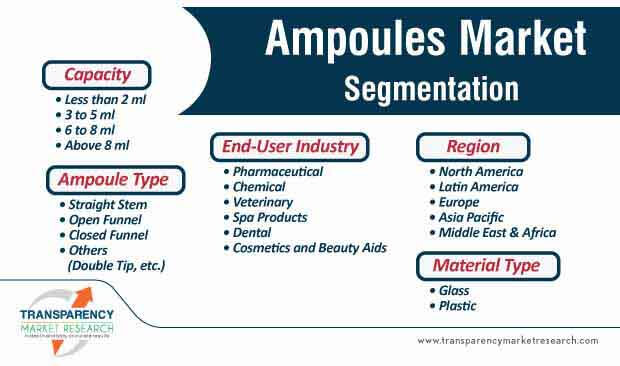
10.3.1. Glass
10.3.2. Plastic
10.4. Market Attractiveness Analysis, By Material Type
11. Global Ampoules Market Analysis 2014–2020 and Forecast 2021–2031, by Capacity
11.1. Introduction
11.2. Historical Market Size (US$ Mn) and Volume (Mn Units) Analysis, by Material Type, 2014–2020
11.3. Current and Future Market Size (US$ Mn) and Volume (Mn Units) Analysis and Forecast, by Material Type, 2021–2031
11.3.1. Less than 2 ml
11.3.2. 3 to 5 ml
11.3.3. 6 to 8 ml
11.3.4. Above 8 ml
11.4. Market Attractiveness Analysis, By Capacity
12. Global Ampoules Market Analysis 2014–2020 and Forecast 2021–2031, by Ampoule Type
12.1. Introduction
12.2. Historical Market Size (US$ Mn) and Volume (Mn Units) Analysis, by Ampoule Type, 2014–2020
12.3. Current and Future Market Size (US$ Mn) and Volume (Mn Units) Analysis and Forecast, by Ampoule Type, 2021–2031
12.3.1. Straight Stem
12.3.2. Open Funnel
12.3.3. Closed Funnel
12.3.4. Others (Double Tip, etc.)
12.4. Market Attractiveness Analysis, By Ampoule Type
13. Global Ampoules Market Analysis 2014–2020 and Forecast 2021–2031, by End-use Industry
13.1. Introduction
13.2. Historical Market Size (US$ Mn) and Volume (Mn Units) Analysis, by End-use Industry, 2014–2020
13.3. Current and Future Market Size (US$ Mn) and Volume (Mn Units) Analysis and Forecast, by End-use Industry, 2021–2031
13.3.1. Pharmaceutical
13.3.2. Chemical
13.3.3. Veterinary
13.3.4. Spa Products
13.3.5. Dental
13.3.6. Cosmetics and Beauty Aids
13.4. Market Attractiveness Analysis, By End-use Industry
14. Global Ampoules Market Analysis 2014–2020 and Forecast 2021–2031, by Region
14.1. Introduction
14.2. Historical Market Size (US$ Mn) and Volume (Mn Units) Analysis, by Region, 2014–2020
14.3. Current and Future Market Size (US$ Mn) and Volume (Mn Units) Analysis and Forecast, by Region, 2021–2031
14.3.1. North America
14.3.2. Latin America
14.3.3. Europe
14.3.4. Asia Pacific
14.3.5. Middle East & Africa
14.4. Market Attractiveness Analysis, By Region
15. North America Ampoules Market Analysis 2014–2020 and Forecast 2021–2031
15.1. Introduction
15.2. Historical Market Size (US$ Mn) and Volume (Mn Units) Trend Analysis by Market Taxonomy, 2014–2020
15.3. Market Size (US$ Mn) and Volume (Mn Units) Forecast by Market Taxonomy, 2021–2031
15.3.1. By Country
15.3.1.1. US
15.3.1.2. Canada
15.3.2. By Material Type
15.3.3. By Capacity
15.3.4. By Ampoule Type
15.3.5. By End-use Industry
15.4. Market Attractiveness Analysis
15.4.1. By Country
15.4.2. By Material Type
15.4.3. By Capacity
15.4.4. By Ampoule Type
15.4.5. By End-use Industry
16. Latin America Ampoules Market Analysis 2014–2020 and Forecast 2021–2031
16.1. Introduction
16.2. Historical Market Size (US$ Mn) and Volume (Mn Units) Trend Analysis by Market Taxonomy, 2014–2020
16.3. Market Size (US$ Mn) and Volume (Mn Units) Forecast By Market Taxonomy, 2021–2031
16.3.1. By Country
16.3.1.1. Mexico
16.3.1.2. Argentina
16.3.1.3. Brazil
16.3.1.4. Rest of Latin America
16.3.2. By Material Type
16.3.3. By Capacity
16.3.4. By Ampoule Type
16.3.5. By End-use Industry
16.4. Market Attractiveness Analysis
16.4.1. By Country
16.4.2. By Material Type
16.4.3. By Capacity
16.4.4. By Ampoule Type
16.4.5. By End-use Industry
17. Europe Ampoules Market Analysis 2014–2020 and Forecast 2021–2031
17.1. Introduction
17.2. Historical Market Size (US$ Mn) and Volume (Mn Units) Trend Analysis by Market Taxonomy, 2014–2020
17.3. Market Size (US$ Mn) and Volume (Mn Units) Forecast By Market Taxonomy, 2021–2031
17.3.1. By Country
17.3.1.1. Germany
17.3.1.2. Spain
17.3.1.3. Italy
17.3.1.4. France
17.3.1.5. U.K
17.3.1.6. BENELUX
17.3.1.7. Nordic
17.3.1.8. Russia
17.3.1.9. Poland
17.3.1.10. Rest of Europe
17.3.2. By Material Type
17.3.3. By Capacity
17.3.4. By Ampoule Type
17.3.5. By End-use Industry
17.4. Market Attractiveness Analysis
17.4.1. By Country
17.4.2. By Material Type
17.4.3. By Capacity
17.4.4. By Ampoule Type
17.4.5. By End-use Industry
18. Asia Pacific Ampoules Market Analysis 2014–2020 and Forecast 2021–2031
18.1. Introduction
18.2. Historical Market Size (US$ Mn) and Volume (Mn Units) Trend Analysis by Market Taxonomy, 2014–2020
18.3. Market Size (US$ Mn) and Volume (Mn Units) Forecast By Market Taxonomy, 2021–2031
18.3.1. By Country
18.3.1.1. China
18.3.1.2. India
18.3.1.3. Japan
18.3.1.4. ASEAN
18.3.1.5. Australia and New Zealand
18.3.1.6. Rest of APAC
18.3.2. By Material Type
18.3.3. By Capacity
18.3.4. By Ampoule Type
18.3.5. By End-use Industry
18.4. Market Attractiveness Analysis
18.4.1. By Country
18.4.2. By Material Type
18.4.3. By Capacity
18.4.4. By Ampoule Type
18.4.5. By End-use Industry
19. Middle East & Africa Ampoules Market Analysis 2014–2020 and Forecast 2021–2031
19.1. Introduction
19.2. Historical Market Size (US$ Mn) and Volume (Mn Units) Trend Analysis by Market Taxonomy, 2014–2020
19.3. Market Size (US$ Mn) and Volume (Mn Units) Forecast By Market Taxonomy, 2021–2031
19.3.1. By Country
19.3.1.1. GCC
19.3.1.2. North Africa
19.3.1.3. South Africa
19.3.1.4. Rest of Middle East & Africa
19.3.2. By Material Type
19.3.3. By Capacity
19.3.4. By Ampoule Type
19.3.5. By End-use Industry
19.4. Market Attractiveness Analysis
19.4.1. By Country
19.4.2. By Material Type
19.4.3. By Capacity
19.4.4. By Ampoule Type
19.4.5. By End-use Industry
20. Market Structure Analysis
20.1. Market Analysis, by Tier of Ampoules Companies
20.2. Market Share Analysis of Top Players
20.3. Market Presence Analysis
20.3.1. Product foot print by Players
20.3.2. Channel Foot Print by Players
21. Competition Analysis
21.1. Competition Dashboard
21.2. Competition Benchmarking
21.3. Competition Deep Dive
21.3.1. Gerresheimer AG
21.3.1.1. Product Portfolio
21.3.1.2. Profitability by Market Segments
21.3.1.3. Sales Footprint
21.3.1.4. Strategy Overview
21.3.1.4.1. Marketing Strategy
21.3.1.4.2. Product Strategy
21.3.1.4.3. Channel Strategy
21.3.2. Nipro Pharma Packaging International
21.3.2.1. Product Portfolio
21.3.2.2. Profitability by Market Segments
21.3.2.3. Sales Footprint
21.3.2.4. Strategy Overview
21.3.2.4.1. Marketing Strategy
21.3.2.4.2. Product Strategy
21.3.2.4.3. Channel Strategy
21.3.3. Birgi Mefar Group
21.3.3.1. Product Portfolio
21.3.3.2. Profitability by Market Segments
21.3.3.3. Sales Footprint
21.3.3.4. Strategy Overview
21.3.3.4.1. Marketing Strategy
21.3.3.4.2. Product Strategy
21.3.3.4.3. Channel Strategy
21.3.4. Adelphi Healthcare Packaging
21.3.4.1. Product Portfolio
21.3.4.2. Profitability by Market Segments
21.3.4.3. Sales Footprint
21.3.4.4. Strategy Overview
21.3.4.4.1. Marketing Strategy
21.3.4.4.2. Product Strategy
21.3.4.4.3. Channel Strategy
21.3.5. James Alexander Corporation
21.3.5.1. Product Portfolio
21.3.5.2. Profitability by Market Segments
21.3.5.3. Sales Footprint
21.3.5.4. Strategy Overview
21.3.5.4.1. Marketing Strategy
21.3.5.4.2. Product Strategy
21.3.5.4.3. Channel Strategy
21.3.6. SGD S.A.
21.3.6.1. Product Portfolio
21.3.6.2. Profitability by Market Segments
21.3.6.3. Sales Footprint
21.3.6.4. Strategy Overview
21.3.6.4.1. Marketing Strategy
21.3.6.4.2. Product Strategy
21.3.6.4.3. Channel Strategy
21.3.7. Pharma-Glas GmbH
21.3.7.1. Product Portfolio
21.3.7.2. Profitability by Market Segments
21.3.7.3. Sales Footprint
21.3.7.4. Strategy Overview
21.3.7.4.1. Marketing Strategy
21.3.7.4.2. Product Strategy
21.3.7.4.3. Channel Strategy
21.3.8. Schott AG
21.3.8.1. Product Portfolio
21.3.8.2. Profitability by Market Segments
21.3.8.3. Sales Footprint
21.3.8.4. Strategy Overview
21.3.8.4.1. Marketing Strategy
21.3.8.4.2. Product Strategy
21.3.8.4.3. Channel Strategy
21.3.9. Stevanato Group
21.3.9.1. Product Portfolio
21.3.9.2. Profitability by Market Segments
21.3.9.3. Sales Footprint
21.3.9.4. Strategy Overview
21.3.9.4.1. Marketing Strategy
21.3.9.4.2. Product Strategy
21.3.9.4.3. Channel Strategy
21.3.10. Kapoor Glass Pvt. Ltd.
21.3.10.1. Product Portfolio
21.3.10.2. Profitability by Market Segments
21.3.10.3. Sales Footprint
21.3.10.4. Strategy Overview
21.3.10.4.1. Marketing Strategy
21.3.10.4.2. Product Strategy
21.3.10.4.3. Channel Strategy
21.3.11. Shandong Pharmaceutical Glass Co., Ltd.
21.3.11.1. Product Portfolio
21.3.11.2. Profitability by Market Segments
21.3.11.3. Sales Footprint
21.3.11.4. Strategy Overview
21.3.11.4.1. Marketing Strategy
21.3.11.4.2. Product Strategy
21.3.11.4.3. Channel Strategy
21.3.12. Techno Ampoules (Pvt.) Ltd.
21.3.12.1. Product Portfolio
21.3.12.2. Profitability by Market Segments
21.3.12.3. Sales Footprint
21.3.12.4. Strategy Overview
21.3.12.4.1. Marketing Strategy
21.3.12.4.2. Product Strategy
21.3.12.4.3. Channel Strategy
21.3.13. Khemka Glass Products Pvt. Ltd.
21.3.13.1. Product Portfolio
21.3.13.2. Profitability by Market Segments
21.3.13.3. Sales Footprint
21.3.13.4. Strategy Overview
21.3.13.4.1. Marketing Strategy
21.3.13.4.2. Product Strategy
21.3.13.4.3. Channel Strategy
21.3.14. Kishore Group
21.3.14.1. Product Portfolio
21.3.14.2. Profitability by Market Segments
21.3.14.3. Sales Footprint
21.3.14.4. Strategy Overview
21.3.14.4.1. Marketing Strategy
21.3.14.4.2. Product Strategy
21.3.14.4.3. Channel Strategy
21.3.15. Lutz Packaging GmbH
21.3.15.1. Product Portfolio
21.3.15.2. Profitability by Market Segments
21.3.15.3. Sales Footprint
21.3.15.4. Strategy Overview
21.3.15.4.1. Marketing Strategy
21.3.15.4.2. Product Strategy
21.3.15.4.3. Channel Strategy
22. Assumptions and Acronyms Used
23. Research Methodology
List of Tables
Table 01: Global Ampoules Volume (Mn Units), by Material Type, 2014(H)-2031(F)
Table 02: Global Ampoules Value (US$ Mn), by Material Type, 2014(H)-2031(F)
Table 03: Global Ampoules Volume (Mn Units), by Capacity, 2014(H)-2031(F)
Table 04: Global Ampoules Value (US$ Mn), by Capacity, 2014(H)-2031(F)
Table 05: Global Ampoules Volume (Mn Units), by Ampoule Type, 2014(H)-2031(F)
Table 06: Global Ampoules Value (US$ Mn), by Ampoule Type, 2014(H)-2031(F)
Table 07: Global Ampoules Volume (Mn Units), by End-use Industry, 2014(H)-2031(F)
Table 08: Global Ampoules Value (US$ Mn), by End-use Industry, 2014(H)-2031(F)
Table 09: Global Ampoules Volume (Mn Units), by Region, 2014(H)-2031(F)
Table 10: Global Ampoules Value (US$ Mn), by Region, 2014(H)-2031(F)
Table 11: North America Ampoules Volume (Mn Units), by Material Type, 2012(H)-2031(F)
Table 12: North America Ampoules Value (US$ Mn), by Material Type, 2014(H)-2031(F)
Table 13: North America Ampoules Volume (Mn Units), by Capacity, 2014(H)-2031(F)
Table 14: North America Ampoules Value (US$ Mn), by Capacity, 2014(H)-2031(F)
Table 15: North America Ampoules Volume (Mn Units), by Ampoule Type, 2014(H)-2031(F)
Table 16: North America Ampoules Value (US$ Mn), by Ampoule Type, 2014(H)-2031(F)
Table 17: North America Ampoules Volume (Mn Units), by End-use Industry, 2014(H)-2031(F)
Table 18: North America Ampoules Value (US$ Mn), by End-use Industry, 2014(H)-2031(F)
Table 19: North America Ampoules Volume (Mn Units), by Country, 2014(H)-2031(F)
Table 20: North America Ampoules Value (US$ Mn), by Country, 2014(H)-2031(F)
Table 21: Latin America Ampoules Volume (Mn Units), by Material Type, 2014(H)-2031(F)
Table 22: Latin America Ampoules Value (US$ Mn), by Material Type, 2014(H)-2031(F)
Table 23: Latin America Ampoules Volume (Mn Units), by Capacity, 2014(H)-2031(F)
Table 24: Latin America Ampoules Value (US$ Mn), by Capacity, 2014(H)-2031(F)
Table 25: Latin America Ampoules Volume (Mn Units), by Ampoule Type, 2014(H)-2031(F)
Table 26: Latin America Ampoules Value (US$ Mn), by End-use Industry, 2014(H)-2031(F)
Table 27: Latin America Ampoules Volume (Mn Units), by End-use Industry, 2014(H)-2031(F)
Table 28: Latin America Ampoules Value (US$ Mn), by End-use Industry, 2014(H)-2031(F)
Table 29: Latin America Ampoules Volume (Mn Units), by Country, 2014(H)-2031(F)
Table 30: Latin America Ampoules Value (US$ Mn), by Country, 2014(H)-2031(F)
Table 31: Europe Ampoules Volume (Mn Units), by Material Type, 2014(H)-2031(F)
Table 32: Europe Ampoules Value (US$ Mn), by Material Type, 2014(H)-2031(F)
Table 33: Europe Ampoules Volume (Mn Units), by Capacity, 2014(H)-2031(F)
Table 34: Europe Ampoules Value (US$ Mn), by Capacity, 2014(H)-2031(F)
Table 35: Europe Ampoules Volume (Mn Units), by Ampoule Type, 2014(H)-2031(F)
Table 36: Europe Ampoules Value (US$ Mn), by Ampoule Type, 2014(H)-2031(F)
Table 37: Europe Ampoules Volume (Mn Units), by End-use Industry, 2014(H)-2031(F)
Table 38: Europe Ampoules Value (US$ Mn), by End-use Industry, 2014(H)-2031(F)
Table 39: Europe Ampoules Volume (Mn Units), by Country, 2014(H)-2031(F)
Table 40: Europe Ampoules Value (US$ Mn), by Country, 2014(H)-2031(F)
Table 41: Asia Pacific Ampoules Volume (Mn Units), by Material Type, 2014(H)-2031(F)
Table 42: Asia Pacific Ampoules Value (US$ Mn), by Material Type, 2014(H)-2031(F)
Table 43: Asia Pacific Ampoules Volume (Mn Units), by Capacity, 2014(H)-2031(F)
Table 44: Asia Pacific Ampoules Value (US$ Mn), by Capacity, 2014(H)-2031(F)
Table 45: Asia Pacific Ampoules Volume (Mn Units), Ampoule Type, 2014(H)-2031(F)
Table 46: Asia Pacific Ampoules Value (US$ Mn), by Ampoule Type, 2014(H)-2031(F)
Table 47: Asia Pacific Ampoules Volume (Mn Units), by End-use Industry, 2014(H)-2031(F)
Table 48: Asia Pacific Ampoules Value (US$ Mn), by End-use Industry, 2014(H)-2031(F)
Table 49: Asia Pacific Ampoules Volume (Mn Units), by Country, 2014(H)-2031(F)
Table 50: Asia Pacific Ampoules Value (US$ Mn), by Country, 2014(H)-2031(F)
Table 51: Middle East & Africa Ampoules Volume (Mn Units), by Material Type, 2012(H)-2031(F)
Table 52: Middle East & Africa Mn Units Value (US$ Mn), by Material Type, 2012(H)-2031(F)
Table 53: Middle East & Africa Ampoules Volume (Mn Units), by Capacity, 2014(H)-2031(F)
Table 54: Middle East & Africa Ampoules Value (US$ Mn), by Capacity, 2014(H)-2031(F)
Table 55: Middle East & Africa Ampoules Volume (Mn Units), by Ampoule Type, 2014(H)-2031(F)
Table 56: Middle East & Africa Ampoules Value (US$ Mn), by Ampoule Type, 2014(H)-2031(F)
Table 57: Middle East & Africa Ampoules Volume (Mn Units), by End-use Industry, 2014(H)-2031(F)
Table 58: Middle East & Africa Ampoules Value (US$ Mn), by End-use Industry, 2014(H)-2031(F)
Table 59: Middle East & Africa Ampoules Volume (Mn Units), by Country, 2014(H)-2031(F)
Table 60: Middle East & Africa Ampoules Value (US$ Mn), by Country, 2014(H)-2031(F)
List of Figures
Figure 01: Global Ampoules Market Attractiveness Index, by Material Type, 2021(E)-2031(F)
Figure 02: Global Ampoules Market Y-o-Y Analysis by Material Type, 2019(H)-2031(F)
Figure 03: Global Ampoules Market Share Analysis, by Material Type, 2021(E) & 2031(F)
Figure 04: Global Ampoules Market Attractiveness Index, by Capacity, 2021(E)-2031(F)
Figure 05: Global Ampoules Market Y-o-Y Analysis by Capacity, 2019(H)-2031(F)
Figure 06: Global Ampoules Market Share Analysis, by Capacity, 2021(E) & 2031(F)
Figure 07: Global Ampoules Market Attractiveness Index, by Ampoule Type, 2021(E)-2031(F)
Figure 08: Global Ampoules Market Y-o-Y Analysis by Ampoule Type, 2019(H)-2031(F)
Figure 09: Global Ampoules Market Share Analysis, by Ampoule Type, 2021(E) & 2031(F)
Figure 10: Global Ampoules Market Attractiveness Index, by End-use Industry, 2021(E)-2031(F)
Figure 11: Global Ampoules Market Y-o-Y Analysis by End-use Industry, 2019(H)-2031(F)
Figure 12: Global Ampoules Market Share Analysis, by End-use Industry, 2021(E) & 2031(F)
Figure 13: Global Ampoules Market Attractiveness Index, by Region, 2021(E)-2031(F)
Figure 14: Global Ampoules Market Y-o-Y Analysis by Region, 2019(H)-2031(F)
Figure 15: Global Ampoules Market Share Analysis, by Region, 2021(E) & 2031(F)
Figure 16: North America Ampoules Market Attractiveness Index, by Material Type, 2021(E)-2031(F)
Figure 17: North America Ampoules Market Share Analysis, by Material Type, 2021(E) & 2031(F)
Figure 18: North America Ampoules Market Attractiveness Index, by Capacity, 2021(E)-2031(F)
Figure 19: North America Ampoules Market Share Analysis, Capacity, 2021(E) & 2031(F)
Figure 20: North America Ampoules Market Attractiveness Index, by Ampoule Type, 2021(E)-2031(F)
Figure 21: North America Ampoules Market Share Analysis, by Ampoule Type, 2021(E) & 2031(F)
Figure 22: North America Ampoules Market Attractiveness Index, by End-use Industry, 2021(E)-2031(F)
Figure 23: North America Ampoules Market Share Analysis, by End-use Industry, 2021(E) & 2031(F)
Figure 24: North America Ampoules Market Attractiveness Index, by Country, 2021(E)-2031(F)
Figure 25: North America Ampoules Market Share Analysis, by Country, 2021(E) & 2031(F)
Figure 26: Latin America Ampoules Market Attractiveness Index, by Material Type, 2021(E)-2031(F)
Figure 27: Latin America Ampoules Market Share Analysis, by Material Type, 2021(E) & 2031(F)
Figure 28: Latin America Ampoules Market Attractiveness Index, by Capacity, 2021(E)-2031(F)
Figure 29: Latin America Ampoules Market Share Analysis, by Capacity, 2021(E) & 2031(F)
Figure 30: Latin America Ampoules Market Attractiveness Index, by Ampoule Type, 2021(E)-2031(F)
Figure 31: Latin America Ampoules Market Share Analysis, Ampoule Type, 2021(E) & 2031(F)
Figure 32: Latin America Ampoules Market Attractiveness Index, by End-use Industry, 2021(E)-2031(F)
Figure 33: Latin America Ampoules Market Share Analysis, by End-use Industry, 2021(E) & 2031(F)
Figure 34: Latin America Ampoules Market Attractiveness Index, by Country, 2021(E)-2031(F)
Figure 35: Latin America Ampoules Market Share Analysis, by Country 2021(E) & 2031(F)
Figure 36: Europe Ampoules Market Attractiveness Index, by Material Type, 2021(E)-2031(F)
Figure 37: Europe Ampoules Market Share Analysis, by Material Type, 2021(E) & 2031(F)
Figure 38: Europe Ampoules Market Attractiveness Index, by Capacity, 2021(E)-2031(F)
Figure 39: Europe Ampoules Market Share Analysis, by Capacity 2021(E) & 2031(F)
Figure 40: Europe Ampoules Market Attractiveness Index, by Ampoule Type, 2021(E)-2031(F)
Figure 41: Europe Ampoules Market Share Analysis, by Ampoule Type, 2021(E) & 2031(F)
Figure 42: Europe Ampoules Market Attractiveness Index, by End-use Industry, 2021(E)-2031(F)
Figure 43: Europe Ampoules Market Share Analysis, by End-use Industry, 2021(E) & 2031(F)
Figure 44: Europe Ampoules Market Attractiveness Index, by Country, 2021(E)-2031(F)
Figure 45: Europe Ampoules Market Share Analysis, by Country, 2021(E) & 2031(F)
Figure 46: Asia Pacific Ampoules Market Attractiveness Index, by Material Type, 2021(E)-2031(F)
Figure 47: Asia Pacific Ampoules Market Share Analysis, by Material Type, 2021(E) & 2031(F)
Figure 48: Asia Pacific Ampoules Market Attractiveness Index, by Capacity, 2021(E)-2031(F)
Figure 49: Asia Pacific Ampoules Market Share Analysis, by Capacity, 2021(E) & 2031(F)
Figure 50: Asia Pacific Ampoules Market Attractiveness Index, by Ampoule Type, 2021(E)-2031(F)
Figure 51: Asia Pacific Ampoules Market Share Analysis, by Ampoule Type, 2021(E) & 2031(F)
Figure 52: Asia Pacific Ampoules Market Attractiveness Index, by End-use Industry, 2021(E)-2031(F)
Figure 53: Asia Pacific Ampoules Market Share Analysis, by End-use Industry, 2021(E) & 2031(F)
Figure 54: Asia Pacific Ampoules Market Attractiveness Index, by Country, 2021(E)-2031(F)
Figure 55: Asia Pacific Ampoules Market Share Analysis, by Country, 2021(E) & 2031(F)
Figure 56: Middle East & Africa Ampoules Market Attractiveness Index, by Material Type, 2021(E)-2031(F)
Figure 57: Middle East & Africa Ampoules Market Share Analysis, by Material Type, 2021(E) & 2031(F)
Figure 58: Middle East & Africa Ampoules Market Attractiveness Index, by Capacity, 2021(E)-2031(F)
Figure 59: Middle East & Africa Ampoules Market Share Analysis, by Capacity, 2021(E) & 2031(F)
Figure 60: Middle East & Africa Ampoules Market Attractiveness Index, by Ampoule Type, 2021(E)-2031(F)
Figure 61: Middle East & Africa Ampoules Market Share Analysis, by Ampoule Type, 2021(E) & 2031(F)
Figure 62: Middle East & Africa Ampoules Market Attractiveness Index, by End-use Industry, 2021(E)-2031(F)
Figure 63: Middle East & Africa Ampoules Market Share Analysis, by End-use Industry, 2021(E) & 2031(F)
Figure 64: Middle East & Africa Ampoules Market Attractiveness Index, by Country, 2021(E)-2031(F)
Figure 65: Middle East & Africa Ampoules Market Share Analysis, by Country, 2021(E) & 2031(F)
Copyright © Transparency Market Research, Inc. All Rights reserved
Trust Online

Ampoules Market Growth, Forecast 2021 - 2031