
Reports
Reports
Maintenance, Repair, and Operation (MRO) plays an important role in the airline industry. MRO has become one of the major expenditure by the airline company as international aviation authorities across the globe has made MRO mandatory. One of the biggest driving factors in the air transport MRO market is increasing focus on cost reduction through proper maintenance. However, OEMs are also focusing on aftermarket services which is proving to be successful, thus hampering independent MRO companies, especially small businesses.
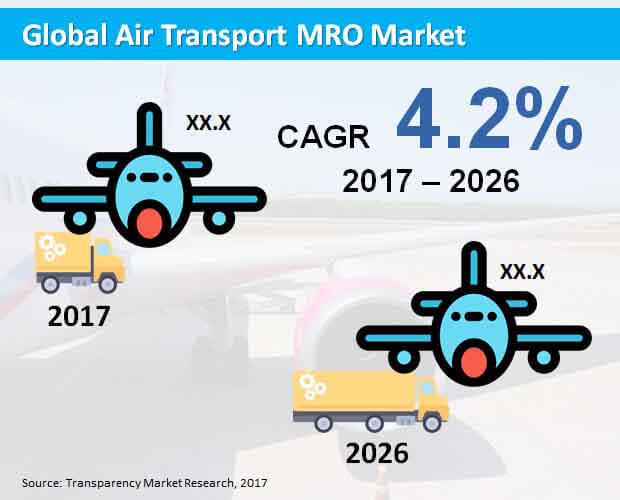
According to a study by Transparency Market Research (TMR), the global air transport MRO market is expected to witness moderate growth. The market is estimated to register 4.2% CAGR between 2017 and 2026. The global market for air transport MRO is also likely to reach US$ 101,941.2 million revenue by the end of 2026.
An engine is expected to account for nearly half of the revenue share by 2017 end. Engine is projected to reach close to US$ 42,800 million revenue towards the end of 2026. Engine being an important part of the aircraft, maintenance, periodic checking, and repairing of engine is done on the large scale. Hence, engine is responsible for majority of MRO market’s value. Moreover, there has been an increase in the number of joint ventures between OEM and MRO along with the focus on the next-generation engine. Also as the aircraft gets older, more value is transferred to its engine, hence more focus is given to the maintenance and repair of aircraft engine.
Compared to various types of aircrafts, narrowbody aircraft is likely to gain maximum traction. By the end of 2026, the narrowbody aircraft is estimated to surpass US$ 51,900 million revenue. Narrowbody aircrafts are replacing existing aircrafts, hence, maintenance industry is providing support to new single-aisle jets by appointing qualified workforce to handle the maintenance service and provide necessary support. However, high cost of repair, retrofit of old aircraft with the upgraded system are some of the factors restricting the growth of narrowbody aircraft MRO. The trend of outsourcing line maintenance to the third party MRO service providers is also emerging.
Original Equipment Manufacturer (OEM) is likely to emerge as one of the largest MRO providers. Between 2017 and 2026, OEM is estimated to create an incremental opportunity of more than US$ 19,500 million. Owing to the development of new generation of commercial jets, component, airframe, engine, OEMs are witnessing better revenue generating opportunities in the aftermarket services. With the launch of next-gen aircrafts, MRO companies are entering into a partnership with OEMs to maintain their position in providing maintenance, repair and overhaul services.
Europe is likely to account for the highest share in the global air transport MRO market between 2017 and 2026. There has been an increase in the airlines replacing old aircrafts with new technology models in Europe. This has resulted in the growth of MRO market, especially for single-aisle jets in Eastern and Western Europe. Meanwhile, the air transport MRO market is also focusing on developing automated mechanism to gain sustainable economic advantages to Aviation Company as well as third parties. However, lack of skilled workforce is one of the biggest challenges in the air transport MRO market across the globe.
Some of the prominent players in the global market for air transport MRO market are MTU Aero Engines AG, Deutsche Lufthansa Aktiengesellschaft, Iberia Lineas Aereas de Espana S.A., John Swire & Sons HK Ltd, General Electric Company, Delta Air Lines, Inc., British Airways PLC, Air France-KLM SA, China National Aviation Holding Company, and AAR Corporation.
Air Transport Maintenance, Repair, and Overhaul (MRO) Market Pins High Hopes on Blockchain to Gain Substantial Cost Reduction
Air transport maintenance, repair, and overhaul (MRO) market has evolved on the back of the evolving regulatory and compliance frameworks in various countries. Growing focus on maintaining the airworthiness of commercial aircrafts is a key trend driving the demand for new systems, technologies, and maintenance schedules in the air transport MRO market. Strides being made by aviation industry in various developing regions of the world have focused on reducing the overall cost of MRO operations. A number of services have emerged to meet the demand for civil and military transport operations. The need for reducing the overall cost of air transport MRO operations has propelled the aviation industry to test new and novel technologies. A case in point is blockchain technology. The technology is a novel one and is showing vast potential in tracking aircraft parts. The cost gains may run into billions according to some of the recent research. A number of blockchain alliances launched in MRO has expanded the horizon for players in the air transport MRO market. The movement and maintenance history of commercial aircraft parts is increasingly complex, and the blockchain is emerging as a novel system to meet the needs of the logistic value chain. In many proof of concept studies, the aviation industry has seen the blockchain to facilitate information sharing between the stakeholders.
Rise in demand for cost cutting has also become vital in the wake of Covid-19 putting bans on the commercial flying. Thus, air transport MRO market is also looking to leverage the technologies that can help it to be agile when the pandemic has led to the aviation industry squeezing profits. Further, over the last few months as the airports allow commercial flying, air transport MRO operators must also adopt systems that help maintain pandemic-specific guidelines. This will see some interesting avenues cropping up in the air transport MRO market.
1. Global Economic Outlook
2. Global Air Transport MRO Market - Executive Summary
3. Global Air Transport MRO Market Overview
3.1. Introduction
3.1.1. Global Air Transport MRO Market Taxonomy
3.1.2. Global Air Transport MRO Market Definition
3.2. Global Air Transport MRO Market Size (US$ Mn) and Forecast, 2012-2026
3.2.1. Global Air Transport MRO Market Y-o-Y Growth
3.3. Global Air Transport MRO Market Dynamics
3.4. GDP v/s RPK Projected Annual Growth Rates
3.5. Global Air Transport Fleet Growth
3.6. Supply Chain
3.7. Air Transport MRO Model Assessment
3.8. MRO Service Flow
3.9. Profit Spent Analysis
3.10. Air Transport MRO Material Related Spend
3.11 In Service Fleet by Region
3.12. Aftermarket Cost Breakdown
3.13. Aircrafts Platform by Total MRO Spend: Forecast
3.14. PESTLE Analysis
3.15. Key Participants Market Presence (Intensity Map) By Region
4. Global Air Transport MRO Market Analysis and Forecast 2012-2026
4.1. Global Air Transport MRO Market Size and Forecast By Type, 2012-2026
4.1.1. Engine Market Size and Forecast, 2012-2026
4.1.1.1. Revenue (US$ Mn) Comparison, By Region
4.1.1.2. Market Share Comparison, By Region
4.1.1.3. Y-o-Y growth Comparison, By Region
4.1.2. Components Market Size and Forecast, 2012-2026
4.1.2.1. Revenue (US$ Mn) Comparison, By Region
4.1.2.2. Market Share Comparison, By Region
4.1.2.3. Y-o-Y growth Comparison, By Region
4.1.3. Line Market Size and Forecast, 2012-2026
4.1.3.1. Revenue (US$ Mn) Comparison, By Region
4.1.3.2. Market Share Comparison, By Region
4.1.3.3. Y-o-Y growth Comparison, By Region
4.1.4. Airframe Market Size and Forecast, 2012-2026
4.1.4.1. Revenue (US$ Mn) Comparison, By Region
4.1.4.2. Market Share Comparison, By Region
4.1.4.3. Y-o-Y growth Comparison, By Region
4.2. Global Air Transport MRO Market Size and Forecast By Aircraft Type, 2012-2026
4.2.1. Narrowbody Jet Market Size and Forecast, 2012-2026
4.2.1.1. Revenue (US$ Mn) Comparison, By Region
4.2.1.2. Market Share Comparison, By Region
4.2.1.3. Y-o-Y growth Comparison, By Region
4.2.2. Widebody Jet Market Size and Forecast, 2012-2026
4.2.2.1. Revenue (US$ Mn) Comparison, By Region
4.2.2.2. Market Share Comparison, By Region
4.2.2.3. Y-o-Y growth Comparison, By Region
4.2.3. Turboprop Market Size and Forecast, 2012-2026
4.2.3.1. Revenue (US$ Mn) Comparison, By Region
4.2.3.2. Market Share Comparison, By Region
4.2.3.3. Y-o-Y growth Comparison, By Region
4.2.4. Regional Jet Market Size and Forecast, 2012-2026
4.2.4.1. Revenue (US$ Mn) Comparison, By Region
4.2.4.2. Market Share Comparison, By Region
4.2.4.3. Y-o-Y growth Comparison, By Region
4.3. Global Air Transport MRO Market Size and Forecast By MRO Provider Type, 2012-2026
4.3.1. OEM Market Size and Forecast, 2012-2026
4.3.1.1. Revenue (US$ Mn) Comparison, By Region
4.3.1.2. Market Share Comparison, By Region
4.3.1.3. Y-o-Y growth Comparison, By Region
4.3.2. Non-OEM MRO Market Size and Forecast, 2012-2026
4.3.2.1. Revenue (US$ Mn) Comparison, By Region
4.3.2.2. Market Share Comparison, By Region
4.3.2.3. Y-o-Y growth Comparison, By Region
5. North America Air Transport MRO Market Size and Forecast, 2012-2026
5.1. North America Outlook
5.2. North America Aerospace & Defense Market Outlook
5.3. North America Air Transport MRO Market Outlook
5.4. Revenue (US$ Mn) Comparison, By Country
5.4.1. US Market Size and Forecast (US$ Mn), 2012-2026
5.4.2. Canada Market Size and Forecast (US$ Mn), 2012-2026
5.5. Revenue (US$ Mn) Comparison, By Type
5.6. Revenue (US$ Mn) Comparison, By Aircraft Type
5.7. Revenue (US$ Mn) Comparison, By MRO Provider Type
6. Latin America Air Transport MRO Market Size and Forecast, 2012-2026
6.1. Latin America Outlook
6.2. Latin America Aerospace & Defense Market Outlook
6.3. Latin America Air Transport MRO Market Outlook
6.4. Revenue (US$ Mn) Comparison, By Country
6.4.1. Brazil Market Size and Forecast (US$ Mn), 2012-2026
6.4.2. Mexico Market Size and Forecast (US$ Mn), 2012-2026
6.4.3. Rest of Latin America Market Size and Forecast (US$ Mn), 2012-2026
6.5. Revenue (US$ Mn) Comparison, By Type
6.6. Revenue (US$ Mn) Comparison, By Aircraft Type
6.7. Revenue (US$ Mn) Comparison, By MRO Provider Type
7. Europe Air Transport MRO Market Size and Forecast, 2012-2026
7.1. Europe Outlook
7.2. Europe Aerospace & Defense Market Outlook
7.3. Europe Air Transport MRO Market Outlook
7.4. Revenue (US$ Mn) Comparison, By Country
7.4.1. Germany Market Size and Forecast (US$ Mn), 2012-2026
7.4.2. U.K. Market Size and Forecast (US$ Mn), 2012-2026
7.4.3. Spain Market Size and Forecast (US$ Mn), 2012-2026
7.4.4. France Market Size and Forecast (US$ Mn), 2012-2026
7.4.5. Italy Market Size and Forecast (US$ Mn), 2012-2026
7.4.6. Rest Of Europe Market Size and Forecast (US$ Mn), 2012-2026
7.5. Revenue (US$ Mn) Comparison, By Type
7.6. Revenue (US$ Mn) Comparison, By Aircraft Type
7.7. Revenue (US$ Mn) Comparison, By MRO Provider Type
8. Japan Air Transport MRO Market Size and Forecast, 2012-2026
8.1. Japan Outlook
8.2. Japan Aerospace & Defense Market Outlook
8.3. Japan Air Transport MRO Market Outlook
8.4. Revenue (US$ Mn) Comparison, By Country
8.4.1. Japan Market Size and Forecast (US$ Mn), 2012-2026
8.5. Revenue (US$ Mn) Comparison, By Type
8.6. Revenue (US$ Mn) Comparison, By Aircraft Type
8.7. Revenue (US$ Mn) Comparison, By MRO Provider Type
9. APEJ Air Transport MRO Market Size and Forecast, 2012-2026
9.1. APEJ Outlook
9.2. APEJ Aerospace & Defense Market Outlook
9.3. APEJ Air Transport MRO Market Outlook
9.4. Revenue (US$ Mn) Comparison, By Country
9.4.1. China Market Size and Forecast (US$ Mn), 2012-2026
9.4.2. India Market Size and Forecast (US$ Mn), 2012-2026
9.4.3. Australia & New Zealand Market Size and Forecast (US$ Mn), 2012-2026
9.4.4. ASEAN Market Size and Forecast (US$ Mn), 2012-2026
9.4.5. Rest Of APEJ Market Size and Forecast (US$ Mn), 2012-2026
9.5. Revenue (US$ Mn) Comparison, By Type
9.6. Revenue (US$ Mn) Comparison, By Aircraft Type
9.7. Revenue (US$ Mn) Comparison, By MRO Provider Type
10. MEA Air Transport MRO Market Size and Forecast, 2012-2026
10.1. MEA Outlook
10.2. MEA Aerospace & Defense Market Outlook
10.3. MEA Air Transport MRO Market Outlook
10.4. Revenue (US$ Mn) Comparison, By Country
10.4.1. GCC Countries Market Size and Forecast (US$ Mn), 2012-2026
10.4.2. Turkey Market Size and Forecast (US$ Mn), 2012-2026
10.4.3. Rest of MEA Market Size and Forecast (US$ Mn), 2012-2026
10.5. Revenue (US$ Mn) Comparison, By Type
10.6. Revenue (US$ Mn) Comparison, By Aircraft Type
10.7. Revenue (US$ Mn) Comparison, By MRO Provider Type
11. Global Air Transport MRO Market Company Share, Competition Landscape and Company Profiles
11.1. Company Share Analysis
11.2. Competition Landscape
11.3. Company Profiles
11.3.1. AAR Corporation
11.3.2. China National Aviation Holding Company
11.3.3. Air France-KLM SA,
11.3.4. British Airways PLC
11.3.5. Delta Air Lines, Inc.
11.3.6. General Electric Company.
11.3.7. John Swire & Sons HK Ltd
11.3.8. Iberia Lineas Aereas de Espana S.A.
11.3.9. Deutsche Lufthansa Aktiengesellschaft
11.3.10. MTU Aero Engines AG
11.3.11. Mubadala Investment Company
11.3.12. Singapore Technologies Aerospace Ltd.
12. Research Methodology
13. Secondary and Primary Sources
14. Assumptions and Acronyms
15. Disclaimer
List of Tables
TABLE 1 Global Air Transport MRO Market Value (US$ Mn), 2012-2017
TABLE 2 Global Air Transport MRO Market Value (US$ Mn), 2018-2026
TABLE 3 Global Air Transport MRO Market Value (US$ Mn) and Y-o-Y, 2017-2026
TABLE 4 Global Engine Segment Value (US$ Mn), By Region 2012-2017
TABLE 5 Global Engine Segment Value (US$ Mn), By Region 2018-2026
TABLE 6 Global Engine Segment Market Share, By Region 2012-2017
TABLE 7 Global Engine Segment Market Share, By Region 2018-2026
TABLE 8 Global Engine Segment Y-o-Y, By Region 2017-2026
TABLE 9 Global Components Segment Value (US$ Mn), By Region 2012-2017
TABLE 10 Global Components Segment Value (US$ Mn), By Region 2018-2026
TABLE 11 Global Components Segment Market Share, By Region 2012-2017
TABLE 12 Global Components Segment Market Share, By Region 2018-2026
TABLE 13 Global Components Segment Y-o-Y, By Region 2017-2026
TABLE 14 Global Line Segment Value (US$ Mn), By Region 2012-2017
TABLE 15 Global Line Segment Value (US$ Mn), By Region 2018-2026
TABLE 16 Global Line Segment Market Share, By Region 2012-2017
TABLE 17 Global Line Segment Market Share, By Region 2018-2026
TABLE 18 Global Line Segment Y-o-Y, By Region 2017-2026
TABLE 19 Global Airframe Segment Value (US$ Mn), By Region 2012-2017
TABLE 20 Global Airframe Segment Value (US$ Mn), By Region 2018-2026
TABLE 21 Global Airframe Segment Market Share, By Region 2012-2017
TABLE 22 Global Airframe Segment Market Share, By Region 2018-2026
TABLE 23 Global Airframe Segment Y-o-Y, By Region 2017-2026
TABLE 24 Global Narrowbody Jet Segment Value (US$ Mn), By Region 2012-2017
TABLE 25 Global Narrowbody Jet Segment Value (US$ Mn), By Region 2018-2026
TABLE 26 Global Narrowbody Jet Segment Market Share, By Region 2012-2017
TABLE 27 Global Narrowbody Jet Segment Market Share, By Region 2018-2026
TABLE 28 Global Narrowbody Jet Segment Y-o-Y, By Region 2017-2026
TABLE 29 Global Widebody Jet Segment Value (US$ Mn), By Region 2012-2017
TABLE 30 Global Widebody Jet Segment Value (US$ Mn), By Region 2018-2026
TABLE 31 Global Widebody Jet Segment Market Share, By Region 2012-2017
TABLE 32 Global Widebody Jet Segment Market Share, By Region 2018-2026
TABLE 33 Global Widebody Jet Segment Y-o-Y, By Region 2017-2026
TABLE 34 Global Turboprop Segment Value (US$ Mn), By Region 2012-2017
TABLE 35 Global Turboprop Segment Value (US$ Mn), By Region 2018-2026
TABLE 36 Global Turboprop Segment Market Share, By Region 2012-2017
TABLE 37 Global Turboprop Segment Market Share, By Region 2018-2026
TABLE 38 Global Turboprop Segment Y-o-Y, By Region 2017-2026
TABLE 39 Global Regional Jet Segment Value (US$ Mn), By Region 2012-2017
TABLE 40 Global Regional Jet Segment Value (US$ Mn), By Region 2018-2026
TABLE 41 Global Regional Jet Segment Market Share, By Region 2012-2017
TABLE 42 Global Regional Jet Segment Market Share, By Region 2018-2026
TABLE 43 Global Regional Jet Segment Y-o-Y, By Region 2017-2026
TABLE 44 Global OEM Segment Value (US$ Mn), By Region 2012-2017
TABLE 45 Global OEM Segment Value (US$ Mn), By Region 2018-2026
TABLE 46 Global OEM Segment Market Share, By Region 2012-2017
TABLE 47 Global OEM Segment Market Share, By Region 2018-2026
TABLE 48 Global OEM Segment Y-o-Y, By Region 2017-2026
TABLE 49 Global Non-OEM MRO Segment Value (US$ Mn), By Region 2012-2017
TABLE 50 Global Non-OEM MRO Segment Value (US$ Mn), By Region 2018-2026
TABLE 51 Global Non-OEM MRO Segment Market Share, By Region 2012-2017
TABLE 52 Global Non-OEM MRO Segment Market Share, By Region 2018-2026
TABLE 53 Global Non-OEM MRO Segment Y-o-Y, By Region 2017-2026
TABLE 54 North America Air Transport MRO Market Value (US$ Mn), By Country 2012-2017
TABLE 55 North America Air Transport MRO Market Value (US$ Mn), By Country 2018-2026
TABLE 56 North America Air Transport MRO Market Value (US$ Mn), By Type 2012-2017
TABLE 57 North America Air Transport MRO Market Value (US$ Mn), By Type 2018-2026
TABLE 58 North America Air Transport MRO Market Value (US$ Mn), By Aircraft Type 2012-2017
TABLE 59 North America Air Transport MRO Market Value (US$ Mn), By Aircraft Type 2018-2026
TABLE 60 North America Air Transport MRO Market Value (US$ Mn), By MRO Provider Type 2012-2017
TABLE 61 North America Air Transport MRO Market Value (US$ Mn), By MRO Provider Type 2018-2026
TABLE 62 Latin America Air Transport MRO Market Value (US$ Mn), By Country 2012-2017
TABLE 63 Latin America Air Transport MRO Market Value (US$ Mn), By Country 2018-2026
TABLE 64 Latin America Air Transport MRO Market Value (US$ Mn), By Type 2012-2017
TABLE 65 Latin America Air Transport MRO Market Value (US$ Mn), By Type 2018-2026
TABLE 66 Latin America Air Transport MRO Market Value (US$ Mn), By Aircraft Type 2012-2017
TABLE 67 Latin America Air Transport MRO Market Value (US$ Mn), By Aircraft Type 2018-2026
TABLE 68 Latin America Air Transport MRO Market Value (US$ Mn), By MRO Provider Type 2012-2017
TABLE 69 Latin America Air Transport MRO Market Value (US$ Mn), By MRO Provider Type 2018-2026
TABLE 70 Europe Air Transport MRO Market Value (US$ Mn), By Country 2012-2017
TABLE 71 Europe Air Transport MRO Market Value (US$ Mn), By Country 2018-2026
TABLE 72 Europe Air Transport MRO Market Value (US$ Mn), By Type 2012-2017
TABLE 73 Europe Air Transport MRO Market Value (US$ Mn), By Type 2018-2026
TABLE 74 Europe Air Transport MRO Market Value (US$ Mn), By Aircraft Type 2012-2017
TABLE 75 Europe Air Transport MRO Market Value (US$ Mn), By Aircraft Type 2018-2026
TABLE 76 Europe Air Transport MRO Market Value (US$ Mn), By MRO Provider Type 2012-2017
TABLE 77 Europe Air Transport MRO Market Value (US$ Mn), By MRO Provider Type 2018-2026
TABLE 78 Japan Air Transport MRO Market Value (US$ Mn), By Country 2012-2017
TABLE 79 Japan Air Transport MRO Market Value (US$ Mn), By Country 2018-2026
TABLE 80 Japan Air Transport MRO Market Value (US$ Mn), By Type 2012-2017
TABLE 81 Japan Air Transport MRO Market Value (US$ Mn), By Type 2018-2026
TABLE 82 Japan Air Transport MRO Market Value (US$ Mn), By Aircraft Type 2012-2017
TABLE 83 Japan Air Transport MRO Market Value (US$ Mn), By Aircraft Type 2018-2026
TABLE 84 Japan Air Transport MRO Market Value (US$ Mn), By MRO Provider Type 2012-2017
TABLE 85 Japan Air Transport MRO Market Value (US$ Mn), By MRO Provider Type 2018-2026
TABLE 86 APEJ Air Transport MRO Market Value (US$ Mn), By Country 2012-2017
TABLE 87 APEJ Air Transport MRO Market Value (US$ Mn), By Country 2018-2026
TABLE 88 APEJ Air Transport MRO Market Value (US$ Mn), By Type 2012-2017
TABLE 89 APEJ Air Transport MRO Market Value (US$ Mn), By Type 2018-2026
TABLE 90 APEJ Air Transport MRO Market Value (US$ Mn), By Aircraft Type 2012-2017
TABLE 91 APEJ Air Transport MRO Market Value (US$ Mn), By Aircraft Type 2018-2026
TABLE 92 APEJ Air Transport MRO Market Value (US$ Mn), By MRO Provider Type 2012-2017
TABLE 93 APEJ Air Transport MRO Market Value (US$ Mn), By MRO Provider Type 2018-2026
TABLE 94 MEA Air Transport MRO Market Value (US$ Mn), By Country 2012-2017
TABLE 95 MEA Air Transport MRO Market Value (US$ Mn), By Country 2018-2026
TABLE 96 MEA Air Transport MRO Market Value (US$ Mn), By Type 2012-2017
TABLE 97 MEA Air Transport MRO Market Value (US$ Mn), By Type 2018-2026
TABLE 98 MEA Air Transport MRO Market Value (US$ Mn), By Aircraft Type 2012-2017
TABLE 99 MEA Air Transport MRO Market Value (US$ Mn), By Aircraft Type 2018-2026
TABLE 100 MEA Air Transport MRO Market Value (US$ Mn), By MRO Provider Type 2012-2017
TABLE 101 MEA Air Transport MRO Market Value (US$ Mn), By MRO Provider Type 2018-2026
List of Figures
FIG. 1 Global Air Transport MRO Market Value (US$ Mn), 2012-2017
FIG. 2 Global Air Transport MRO Market Value (US$ Mn) Forecast, 2018-2026
FIG. 3 Global Air Transport MRO Market Value (US$ Mn) and Y-o-Y, 2017-2026
FIG. 4 Global Engine Segment Market Value (US$ Mn) By Region, 2012-2017
FIG. 5 Global Engine Segment Market Value (US$ Mn) By Region, 2018-2026
FIG. 6 Global Engine Segment Y-o-Y Growth Rate, By Region, 2017-2026
FIG. 7 Global Components Segment Market Value (US$ Mn) By Region, 2012-2017
FIG. 8 Global Components Segment Market Value (US$ Mn) By Region, 2018-2026
FIG. 9 Global Components Segment Y-o-Y Growth Rate, By Region, 2017-2026
FIG. 10 Global Line Segment Market Value (US$ Mn) By Region, 2012-2017
FIG. 11 Global Line Segment Market Value (US$ Mn) By Region, 2018-2026
FIG. 12 Global Line Segment Y-o-Y Growth Rate, By Region, 2017-2026
FIG. 13 Global Airframe Segment Market Value (US$ Mn) By Region, 2012-2017
FIG. 14 Global Airframe Segment Market Value (US$ Mn) By Region, 2018-2026
FIG. 15 Global Airframe Segment Y-o-Y Growth Rate, By Region, 2017-2026
FIG. 16 Global Narrowbody Jet Segment Market Value (US$ Mn) By Region, 2012-2017
FIG. 17 Global Narrowbody Jet Segment Market Value (US$ Mn) By Region, 2018-2026
FIG. 18 Global Narrowbody Jet Segment Y-o-Y Growth Rate, By Region, 2017-2026
FIG. 19 Global Widebody Jet Segment Market Value (US$ Mn) By Region, 2012-2017
FIG. 20 Global Widebody Jet Segment Market Value (US$ Mn) By Region, 2018-2026
FIG. 21 Global Widebody Jet Segment Y-o-Y Growth Rate, By Region, 2017-2026
FIG. 22 Global Turboprop Segment Market Value (US$ Mn) By Region, 2012-2017
FIG. 23 Global Turboprop Segment Market Value (US$ Mn) By Region, 2018-2026
FIG. 24 Global Turboprop Segment Y-o-Y Growth Rate, By Region, 2017-2026
FIG. 25 Global Regional Jet Segment Market Value (US$ Mn) By Region, 2012-2017
FIG. 26 Global Regional Jet Segment Market Value (US$ Mn) By Region, 2018-2026
FIG. 27 Global Regional Jet Segment Y-o-Y Growth Rate, By Region, 2017-2026
FIG. 28 Global OEM Segment Market Value (US$ Mn) By Region, 2012-2017
FIG. 29 Global OEM Segment Market Value (US$ Mn) By Region, 2018-2026
FIG. 30 Global OEM Segment Y-o-Y Growth Rate, By Region, 2017-2026
FIG. 31 Global Non-OEM MRO Segment Market Value (US$ Mn) By Region, 2012-2017
FIG. 32 Global Non-OEM MRO Segment Market Value (US$ Mn) By Region, 2018-2026
FIG. 33 Global Non-OEM MRO Segment Y-o-Y Growth Rate, By Region, 2017-2026
FIG. 34 North America Air Transport MRO Market Value (US$ Mn), By Country 2012-2017
FIG. 35 North America Air Transport MRO Market Value (US$ Mn), By Country 2018-2026
FIG. 36 North America Air Transport MRO Market Value (US$ Mn), By Type 2012-2017
FIG. 37 North America Air Transport MRO Market Value (US$ Mn), By Type 2018-2026
FIG. 38 North America Air Transport MRO Market Value (US$ Mn), By Aircraft Type 2012-2017
FIG. 39 North America Air Transport MRO Market Value (US$ Mn), By Aircraft Type 2018-2026
FIG. 40 North America Air Transport MRO Market Value (US$ Mn), By MRO Provider Type 2012-2017
FIG. 41 North America Air Transport MRO Market Value (US$ Mn), By MRO Provider Type 2018-2026
FIG. 42 Latin America Air Transport MRO Market Value (US$ Mn), By Country 2012-2017
FIG. 43 Latin America Air Transport MRO Market Value (US$ Mn), By Country 2018-2026
FIG. 44 Latin America Air Transport MRO Market Value (US$ Mn), By Type 2012-2017
FIG. 45 Latin America Air Transport MRO Market Value (US$ Mn), By Type 2018-2026
FIG. 46 Latin America Air Transport MRO Market Value (US$ Mn), By Aircraft Type 2012-2017
FIG. 47 Latin America Air Transport MRO Market Value (US$ Mn), By Aircraft Type 2018-2026
FIG. 48 Latin America Air Transport MRO Market Value (US$ Mn), By MRO Provider Type 2012-2017
FIG. 49 Latin America Air Transport MRO Market Value (US$ Mn), By MRO Provider Type 2018-2026
FIG. 50 Europe Air Transport MRO Market Value (US$ Mn), By Country 2012-2017
FIG. 51 Europe Air Transport MRO Market Value (US$ Mn), By Country 2018-2026
FIG. 52 Europe Air Transport MRO Market Value (US$ Mn), By Type 2012-2017
FIG. 53 Europe Air Transport MRO Market Value (US$ Mn), By Type 2018-2026
FIG. 54 Europe Air Transport MRO Market Value (US$ Mn), By Aircraft Type 2012-2017
FIG. 55 Europe Air Transport MRO Market Value (US$ Mn), By Aircraft Type 2018-2026
FIG. 56 Europe Air Transport MRO Market Value (US$ Mn), By MRO Provider Type 2012-2017
FIG. 57 Europe Air Transport MRO Market Value (US$ Mn), By MRO Provider Type 2018-2026
FIG. 58 Japan Air Transport MRO Market Value (US$ Mn), By Country 2012-2017
FIG. 59 Japan Air Transport MRO Market Value (US$ Mn), By Country 2018-2026
FIG. 60 Japan Air Transport MRO Market Value (US$ Mn), By Type 2012-2017
FIG. 61 Japan Air Transport MRO Market Value (US$ Mn), By Type 2018-2026
FIG. 62 Japan Air Transport MRO Market Value (US$ Mn), By MRO Provider Type 2012-2017
FIG. 63 Japan Air Transport MRO Market Value (US$ Mn), By Aircraft Type 2018-2026
FIG. 64 Japan Air Transport MRO Market Value (US$ Mn), By MRO Provider Type 2012-2017
FIG. 65 Japan Air Transport MRO Market Value (US$ Mn), By MRO Provider Type 2018-2026
FIG. 66 APEJ Air Transport MRO Market Value (US$ Mn), By Country 2012-2017
FIG. 67 APEJ Air Transport MRO Market Value (US$ Mn), By Country 2018-2026
FIG. 68 APEJ Air Transport MRO Market Value (US$ Mn), By Type 2012-2017
FIG. 69 APEJ Air Transport MRO Market Value (US$ Mn), By Type 2018-2026
FIG. 70 APEJ Air Transport MRO Market Value (US$ Mn), By Aircraft Type 2012-2017
FIG. 71 APEJ Air Transport MRO Market Value (US$ Mn), By Aircraft Type 2018-2026
FIG. 72 APEJ Air Transport MRO Market Value (US$ Mn), By MRO Provider Type 2012-2017
FIG. 73 APEJ Air Transport MRO Market Value (US$ Mn), By MRO Provider Type 2018-2026
FIG. 74 MEA Air Transport MRO Market Value (US$ Mn), By Country 2012-2017
FIG. 75 MEA Air Transport MRO Market Value (US$ Mn), By Country 2018-2026
FIG. 76 MEA Air Transport MRO Market Value (US$ Mn), By Type 2012-2017
FIG. 77 MEA Air Transport MRO Market Value (US$ Mn), By Type 2018-2026
FIG. 78 MEA Air Transport MRO Market Value (US$ Mn), By Aircraft Type 2012-2017
FIG. 79 MEA Air Transport MRO Market Value (US$ Mn), By Aircraft Type 2018-2026
FIG. 80 MEA Air Transport MRO Market Value (US$ Mn), By MRO Provider Type 2012-2017
FIG. 81 MEA Air Transport MRO Market Value (US$ Mn), By MRO Provider Type 2018-2026
Copyright © Transparency Market Research, Inc. All Rights reserved
Trust Online

Air Transport MRO Market