
Reports
Reports
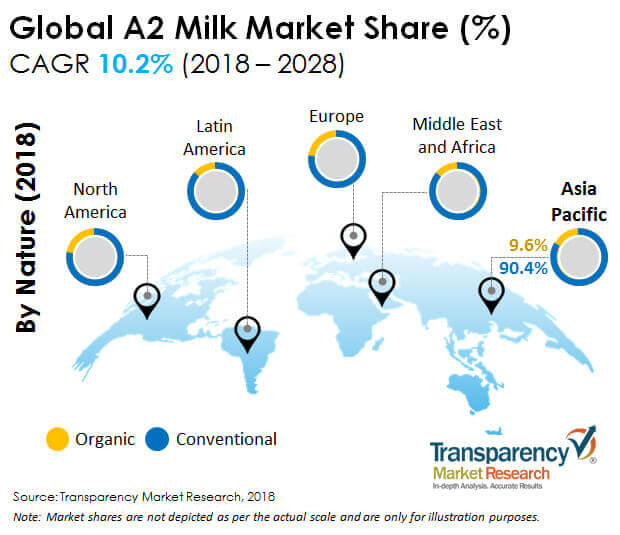
A2 Milk Market: Introduction
There are two variants of beta-casein protein in cow milk - a1 and a2. Milk that contains only a2 beta-casein protein is known as a2 milk. A2 milk is obtained from specific breeds of cows that produce the beta-casein protein in their milk with a proline at number 67. These cows are older breeds and are found mostly in India. Some breeds that produce a2 milk include Guernsey, Shahiwal, Gir, and Red Sindhi. A2 milk has more nutritional value than regular milk, since it contains nutrients such as calcium, potassium, vitamin D, and protein. Milk that is free from a1 beta-casein and rich in a2 beta-casein has been found by many people to be easier as far as digestion is concerned. A2 milk reduces heart disease risk and dairy-related inflammation. The production of a2 milk is more in the Asia Pacific region. Due to augmenting applications and rising demand, the a2 milk market is anticipated to proliferate in terms of value and volume during the forecast period.
A2 Milk: Market Outlook
In a2 milk, the bioactive peptide beta-casomorphin-7 or BCM-7 is almost four times less as compared to a1 and regular milk. BCM-7 creates discomfort during digestion. Due to the lack of BCM-7, the demand for a2 milk has increased among consumers. A2 milk is widely consumed in its natural or liquid form. Also, many manufacturers are providing a2 milk in the powdered form, and it is widely used in the production of infant formula. The growing number of dairy products and increasing dairy industries are also boosting the demand for a2 milk, since it is also used in manufacturing ghee, butter, yogurt, ice cream, cheese, milk powder, and many other products. A2 milk is used in bakeries and confectioneries, and it is also used for manufacturing milk-based beverages. Due to this, it is expected that there will be further launches of new dairy-based products with natural ingredients, such as a2 milk, which is anticipated to drive the growth of the global A2 milk market during the forecast period. A2 milk is produced mostly in the Asia Pacific region due to the presence of the a2 breed cows, and also due to the rising demand for dairy products in this region.
A2 Milk: Market Drivers
Growing Number of People Experiencing Problems with Regular Milk Consumption
Problems related to milk digestion are increasing, globally, among consumers. Many people are afraid to consume milk as they experience gas and bloating after consuming regular milk or milk that contains a1 beta-casein protein. A2 milk is found to be easier as far as digestion is concerned, since it contains only a2-beta-casein protein.
Increasing Application of A2 Milk in Infant Formulae Surging the Market
A2 milk can be used as alternative milk for infants. As we all know, mother’s milk is very important for infants to ensure good health and growth. But there are many cases where mothers are unable to feed a sufficient amount of milk to their children. In such cases, a2 milk is a great alternative, as it is quite comparable to goat’s and mother’s milk. Also, many manufacturers are using a2 milk for the manufacturing of infant food. Many new infant food products are being launched every year by various manufacturers, which is boosting the share of a2 milk in the market.
A2 Milk Reduces Dairy -related Inflammation and Heart Disease Risk
An increasing number of people across the globe are suffering from heart diseases. Also, a large number of people are suffering from dairy-related inflammation by consuming regular milk. A2 milk reduces the risk of dairy-related inflammation and heart disease among consumers.
More Nutritional Value than Regular Milk (Milk Fat Content is Higher in A2 Milk)
Milk is a daily food ingredient that is used in various dairy products. Milk is consumed globally as a healthy food, since it contains various nutrients that are necessary for human as well as animal health. One of the major nutrients in milk is fat, which is considered to be good fat. The fat content in a2 milk is higher as compared to regular milk. In regular milk, the fat content is around 3.6%, whereas, in a2 milk, it is around 4.8% fat.
Growing Consumer Health Awareness Leading to Increased Consumption of A2 Milk
The trend of eating healthy food is increasing among consumers, globally. Milk is considered to be one of the most consumed food, globally. Milk is consumed on a large extent, as it is considered as a healthy product. But there is an increasing number of people who are not able to consume milk and milk products due to indigestion problems. A2 milk is easier to digest, and that’s why it has great demand among consumers as a healthy food that can be digested easily.
Bound to all the above driving factors, it is anticipated that, the global A2 milk market would proliferate in terms of volume and value during the forecast period.
1. A2 Milk Market - Executive Summary
1.1. Global A2 Milk Market Country Analysis
1.2. Vertical Specific Market Penetration
1.3. Application – Product Mapping
1.4. Competition Blueprint
1.5. TMR Analysis and Recommendations
2. Market Overview
2.1. Market Introduction
2.2. Market Definition
2.3. Market Taxonomy
3. Market Dynamics
3.1. Macro-economic Factors
3.2. Drivers
3.2.1. Economic Drivers
3.2.2. Supply Side Drivers
3.2.3. Demand Side Drivers
3.3. Market Restraints
3.3.1. Regulatory concerns
3.3.2. Others
3.4. Market Trends
3.5. Overview of Milk and Milk Products
3.6. Cow Milk Consumption & Demand
3.7. Milk Import & Export Data
3.8. Comparison Between Regular and A2 Milk
3.9. Forecast Factors – Relevance and Impact
3.10. Key Regulations By Regions
4. Supply Chain Analysis
4.1. Profitability and Gross Margin Analysis By Competition
4.2. List of Active Participants- By Region
4.2.1. Raw Material Suppliers
4.2.2. Key Manufacturers
4.2.3. Integrators
4.2.4. Key Distributor/Retailers
5. Global A2 Milk Market Pricing Analysis (2018-2028)
5.1. Price Point Assessment by Nature
5.2. Regional Average Pricing Analysis
5.2.1. North America
5.2.2. Latin America
5.2.3. Europe
5.2.4. Asia Pacific
5.2.5. Middle East and Africa
5.3. Price Forecast till 2028
6. Global A2 Milk Market- Trade Analysis, 2018
6.1.A2 Milk Market- Exports to the World
6.1.1. List of Key Exporters
6.1.2. Key Exporting Countries/Regions- Market Share Analysis (2018E)
6.1.3. Value (US$ Mn) of Export
6.1.4. Volume (Units) of Export
6.2. A2 Milk Market- Imports to the World
6.2.1. List of Key Importers
6.2.2. Key importing Countries/Regions- Market Share Analysis (2018E)
6.2.3. Value (US$ Mn) of Import
6.2.4. Volume (Units) of Import
7. Global A2 Milk Market Analysis and Forecast
7.1. Market Size Analysis (2013-2018) and Forecast (2018-2028)
7.1.1. Market Value (US$ Mn) and Volume (MT) and Y-o-Y Growth
7.1.2. Absolute $ Opportunity
7.2. Global A2 Milk Market Scenario Forecast (Optimistic, Likely and Conservative Market Conditions)
7.2.1. Forecast Factors and Relevance of Impact
7.2.2. Regional A2 Milk Market Business Performance Summary
8. Global A2 Milk Market Analysis By Nature
8.1. Introduction
8.1.1. Y-o-Y Growth Comparison By Nature
8.1.2. Basis Point Share (BPS) Analysis By Nature
8.2. A2 Milk Market Size (US$ Mn) and Volume (MT) Analysis (2013-2018) & Forecast (2018-2028) By Nature
8.2.1. Organic
8.2.2. Conventional
8.3. Market Attractiveness Analysis By Nature
9. Global A2 Milk Market Analysis By Form
9.1. Introduction
9.1.1. Y-o-Y Growth Comparison By Form
9.1.2. Basis Point Share (BPS) Analysis By Form
9.2. A2 Milk Market Size (US$ Mn) and Volume (MT) Analysis (2013-2018) & Forecast (2018-2028) By Form
9.2.1. Liquid
9.2.2. Powder
9.3. Market Attractiveness Analysis By Form
10. Global A2 Milk Market Analysis By Application
10.1. Introduction
10.1.1. Y-o-Y Growth Comparison By Application
10.1.2. Basis Point Share (BPS) Analysis By Application
10.2. A2 Milk Market Size (US$ Mn) and Volume (MT) Analysis (2013-2018) & Forecast (2018-2028) By Application
10.2.1. Infant Formula
10.2.2. Dairy Products
10.2.2.1. Butter
10.2.2.2. Cheese
10.2.2.3. Yogurt
10.2.2.4. Milk Powder
10.2.2.5. Ice Cream
10.2.2.6. Others
10.2.3. Bakery & Confectionery
10.2.4. Milk & Milk-based Beverages
10.3. Market Attractiveness Analysis By Application
11. Global A2 Milk Market Analysis By Packaging
11.1. Introduction
11.1.1. Y-o-Y Growth Comparison By Packaging
11.1.2. Basis Point Share (BPS) Analysis By Packaging
11.2. A2 Milk Market Size (US$ Mn) and Volume (MT) Analysis (2013-2018) & Forecast (2018-2028) By Packaging
11.2.1. Glass Bottles
11.2.2. Plastic Bottles & Pouches
11.2.3. Carton Packaging
11.2.4. Cans
11.3. Market Attractiveness Analysis By Packaging
12. Global A2 Milk Market Analysis By Distribution Channel
12.1. Introduction
12.1.1. Y-o-Y Growth Comparison By Distribution Channel
12.1.2. Basis Point Share (BPS) Analysis By Distribution Channel
12.2. A2 Milk Market Size (US$ Mn) and Volume (MT) Analysis (2013-2018) & Forecast (2018-2028) By Distribution Channel
12.2.1. B2B
12.2.2. B2C
12.2.2.1. Store-based Retailing
12.2.2.2. Hypermarkets/Supermarkets
12.2.2.3. Grocery Stores
12.2.2.4. Convenience Stores
12.2.2.5. Specialty Stores
12.2.3. Online Retailing
12.3. Market Attractiveness Analysis By Distribution Channel
13. Global A2 Milk Market Analysis and Forecast, By Region
13.1. Introduction
13.1.1. Basis Point Share (BPS) Analysis By Region
13.1.2. Y-o-Y Growth Projections By Region
13.2. A2 Milk Market Size (US$ Mn) and Volume (MT) Analysis (2013-2018) & Forecast (2018-2028) Analysis By Region
13.2.1. North America
13.2.2. Latin America
13.2.3. Europe
13.2.4. APAC
13.2.5. MEA
13.3. Market Attractiveness Analysis By Region
14. North America A2 Milk Market Analysis and Forecast
14.1. Introduction
14.1.1. Basis Point Share (BPS) Analysis By Country
14.1.2. Y-o-Y Growth Projections By Country
14.2. A2 Milk Market Size (Value (US$) and Volume (MT) Analysis (2013-2018) and Forecast (2018-2028)
14.2.1. Market Attractiveness By Country
14.2.1.1. U.S.
14.2.1.2. Canada
14.2.2. By Nature
14.2.3. By Form
14.2.4. By Application
14.2.5. By Packaging
14.2.6. By Distribution Channel
14.3. Analysis
14.3.1. By Country
14.3.2. By Nature
14.3.3. By Form
14.3.4. By Application
14.3.5. By Packaging
14.3.6. By Distribution Channel
14.4. Drivers and Restraints: Impact Analysis
15. Latin America A2 Milk Market Analysis and Forecast
15.1. Introduction
15.1.1. Basis Point Share (BPS) Analysis By Country
15.1.2. Y-o-Y Growth Projections By Country
15.1.3. Key Regulations
15.2. A2 Milk Market Size (Value (US$) and Volume (MT) Analysis (2013-2018) and Forecast (2018-2028)
15.2.1. By Country
15.2.1.1. Brazil
15.2.1.2. Mexico
15.2.1.3. Rest of Latin America
15.2.2. By Nature
15.2.3. By Form
15.2.4. By Application
15.2.5. By Packaging
15.2.6. By Distribution Channel
15.3. Market Attractiveness Analysis
15.3.1. By Country
15.3.2. By Nature
15.3.3. By Form
15.3.4. By Application
15.3.5. By Packaging
15.3.6. By Distribution Channel
15.4. Drivers and Restraints: Impact Analysis
16. Europe A2 Milk Market Analysis and Forecast
16.1. Introduction
16.1.1. Basis Point Share (BPS) Analysis By Country
16.1.2. Y-o-Y Growth Projections By Country
16.1.3. Key Regulations
16.2. A2 Milk Market Size (Value (US$) and Volume (MT) Analysis (2013-2018) and Forecast (2018-2028)
16.2.1. By Country
16.2.1.1. Germany
16.2.1.2. France
16.2.1.3. Italy
16.2.1.4. U.K.
16.2.1.5. Spain
16.2.1.6. Russia
16.2.1.7. Poland
16.2.1.8. Rest of Europe
16.2.2. By Nature
16.2.3. By Form
16.2.4. By Application
16.2.5. By Packaging
16.2.6. By Distribution Channel
16.3. Market Attractiveness Analysis
16.3.1. By Country
16.3.2. By Nature
16.3.3. By Form
16.3.4. By Application
16.3.5. By Packaging
16.3.6. By Distribution Channel
16.4. Drivers and Restraints: Impact Analysis
17. APAC A2 Milk Market Analysis and Forecast
17.1. Introduction
17.1.1. Basis Point Share (BPS) Analysis By Country
17.1.2. Y-o-Y Growth Projections By Country
17.1.3. Key Regulations
17.2. A2 Milk Market Size (Value (US$) and Volume (MT) Analysis (2013-2018) and Forecast (2018-2028)
17.2.1. By Country
17.2.1.1. India
17.2.1.2. China
17.2.1.3. Japan
17.2.1.4. South Korea
17.2.1.5. Australia & New Zealand
17.2.1.6. Rest of APAC
17.2.2. By Nature
17.2.3. By Form
17.2.4. By Application
17.2.5. By Packaging
17.2.6. By Distribution Channel
17.3. Market Attractiveness Analysis
17.3.1. By Country
17.3.2. By Nature
17.3.3. By Form
17.3.4. By Application
17.3.5. By Packaging
17.3.6. By Distribution Channel
17.4. Drivers and Restraints: Impact Analysis
18. Middle East and Africa (MEA) A2 Milk Market Analysis and Forecast
18.1. Introduction
18.1.1. Basis Point Share (BPS) Analysis By Country
18.1.2. Y-o-Y Growth Projections By Country
18.1.3. Key Regulations
18.2. A2 Milk Market Size (Value (US$) and Volume (MT) Analysis (2013-2018) and Forecast (2018-2028)
18.2.1. By Country
18.2.1.1. GCC Countries
18.2.1.2. Turkey
18.2.1.3. North Africa
18.2.1.4. South Africa
18.2.1.5. Rest of Middle East and Africa
18.2.2. By Nature
18.2.3. By Form
18.2.4. By Application
18.2.5. By Packaging
18.2.6. By Distribution Channel
18.3. Market Attractiveness Analysis
18.3.1. By Country
18.3.2. By Nature
18.3.3. By Form
18.3.4. By Application
18.3.5. By Packaging
18.3.6. By Distribution Channel
18.4. Drivers and Restraints: Impact Analysis
19. Competition Assessment
19.1. Global A2 Milk Market Competition - a Dashboard View
19.2. Global A2 Milk Market Structure Analysis
19.3. Global A2 Milk Market Company Share Analysis
19.3.1. For Tier 1 Market Players, 2018
19.3.2. Company Market Share Analysis of Top 10 Players, By Region
19.4. Key Participants Market Presence (Intensity Mapping) by Region
20. Brand Assessment
20.1. Brand Identity (Brand as Product, Brand as Organization, Brand as Person, Brand as Symbol)
20.2. A2 Milk Audience and Positioning (Demographic Segmentation, Geographic Segmentation, Psychographic Segmentation, Situational Segmentation)
20.3. Brand Strategy
21. Competition Deep-dive (Manufacturers/Suppliers)
21.1. The a2 Milk Company Limited
21.1.1. Overview
21.1.2. Product Portfolio
21.1.3. Sales Footprint
21.1.4. Channel Footprint
21.1.4.1. Distributors List
21.1.4.2. Sales Channel (Clients)
21.1.5. Strategy Overview
21.1.5.1. Marketing Strategy
21.1.5.2. Culture Strategy
21.1.5.3. Channel Strategy
21.1.6. SWOT Analysis
21.1.7. Financial Analysis
21.1.8. Revenue Share
21.1.8.1. By Nature
21.1.8.2. By Region
21.1.9. Key Clients
21.1.10. Analyst Comments
21.2. FREEDOM FOODS GROUP LIMITED
21.2.1. Overview
21.2.2. Product Portfolio
21.2.3. Sales Footprint
21.2.4. Channel Footprint
21.2.4.1. Distributors List
21.2.4.2. Sales Channel (Clients)
21.2.5. Strategy Overview
21.2.5.1. Marketing Strategy
21.2.5.2. Culture Strategy
21.2.5.3. Channel Strategy
21.2.6. SWOT Analysis
21.2.7. Financial Analysis
21.2.8. Revenue Share
21.2.8.1. By Nature
21.2.8.2. By Region
21.2.9. Key Clients
21.2.10. Analyst Comments
21.3. Fonterra Co-operative Group Limited
21.3.1. Overview
21.3.2. Product Portfolio
21.3.3. Sales Footprint
21.3.4. Channel Footprint
21.3.4.1. Distributors List
21.3.4.2. Sales Channel (Clients)
21.3.5. Strategy Overview
21.3.5.1. Marketing Strategy
21.3.5.2. Culture Strategy
21.3.5.3. Channel Strategy
21.3.6. SWOT Analysis
21.3.7. Financial Analysis
21.3.8. Revenue Share
21.3.8.1. By Nature
21.3.8.2. By Region
21.3.9. Key Clients
21.3.10. Analyst Comments
21.4. Vietnam Dairy Products Joint Stock Company
21.4.1. Overview
21.4.2. Product Portfolio
21.4.3. Sales Footprint
21.4.4. Channel Footprint
21.4.4.1. Distributors List
21.4.4.2. Sales Channel (Clients)
21.4.5. Strategy Overview
21.4.5.1. Marketing Strategy
21.4.5.2. Culture Strategy
21.4.5.3. Channel Strategy
21.4.6. SWOT Analysis
21.4.7. Financial Analysis
21.4.8. Revenue Share
21.4.8.1. By Nature
21.4.8.2. By Region
21.4.9. Key Clients
21.4.10. Analyst Comments
21.5. Gujarat Cooperative Milk Marketing Federation Ltd.
21.5.1. Overview
21.5.2. Product Portfolio
21.5.3. Sales Footprint
21.5.4. Channel Footprint
21.5.4.1. Distributors List
21.5.4.2. Sales Channel (Clients)
21.5.5. Strategy Overview
21.5.5.1. Marketing Strategy
21.5.5.2. Culture Strategy
21.5.5.3. Channel Strategy
21.5.6. SWOT Analysis
21.5.7. Financial Analysis
21.5.8. Revenue Share
21.5.8.1. By Nature
21.5.8.2. By Region
21.5.9. Key Clients
21.5.10. Analyst Comments
21.6. Provilac Dairy Farms Private Limited
21.7. Vedaaz Organics Pvt. Ltd.
21.8. Ratnawali Dairy Products LLP
21.9. Erden Creamery Private Limited
22. Recommendation- Critical Success Factors
23. Research Methodology
24. Assumptions & Acronyms Used
List of Figures
Figure 01: Global A2 Milk Market Absolute $ Opportunity (US$ Mn), 2017-2028
Figure 02: Global A2 Milk Market Value (US$ Mn) and Volume (MT), 2013-2017
Figure 03: Global A2 Milk Market Value (US$ Mn) and Volume (MT) Forecast, 2018-2028
Figure 04: Global A2 Milk Market Volume (MT) Analysis by Nature , 2018 & 2028
Figure 05: Global A2 Milk Market Value (US$ Mn) Analysis by Nature , 2018 & 2028
Figure 06: Global A2 Milk Market Value Share (%) and BPS Analysis by Nature , 2018 & 2028
Figure 07: Global A2 Milk Market Y-o-Y Growth (%) Projections by Nature , 2018-2028
Figure 08: Global A2 Milk Market Volume (MT) Analysis by Form, 2018 & 2028
Figure 09: Global A2 Milk Market Value (US$ Mn) Analysis by Form, 2018 & 2028
Figure 10: Global A2 Milk Market Value Share (%) and BPS Analysis by Form, 2018 & 2028
Figure 11: Global A2 Milk Market Y-o-Y Growth (%) Projections by Form, 2018-2028
Figure 12: Global A2 Milk Market Volume (MT) Analysis by Application, 2018 & 2028
Figure 13: Global A2 Milk Market Value (US$ Mn) Analysis by Application, 2018 & 2028
Figure 14: Global A2 Milk Market Value Share (%) and BPS Analysis by Application, 2018 & 2028
Figure 15: Global A2 Milk Market Y-o-Y Growth (%) Projections by Application, 2018-2028
Figure 16: Global A2 Milk Market Volume (MT) Analysis by Packaging, 2018 & 2028
Figure 17: Global A2 Milk Market Value (US$ Mn) Analysis by Packaging, 2018 & 2028
Figure 18: Global A2 Milk Market Value Share (%) and BPS Analysis by Packaging, 2018 & 2028
Figure 19: Global A2 Milk Market Y-o-Y Growth (%) Projections by Packaging, 2018-2028
Figure 20: Global A2 Milk Market Volume (MT) Analysis by Distribution Channel, 2018 & 2028
Figure 21: Global A2 Milk Market Value (US$ Mn) Analysis by Distribution Channel, 2018 & 2028
Figure 22: Global A2 Milk Market Value Share (%) and BPS Analysis by Distribution Channel, 2018 & 2028
Figure 23: Global A2 Milk Market Y-o-Y Growth (%) Projections by Distribution Channel, 2018-2028
Figure 24: Global A2 Milk Market Volume (MT) Analysis by Region, 2018 & 2028
Figure 25: lobal A2 Milk Market Value (US$ Mn) Analysis by Region, 2018 & 2028
Figure 26: Global A2 Milk Market Value Share (%) and BPS Analysis by Region, 2018 & 2028
Figure 27: Global A2 Milk Market Y-o-Y Growth (%) Projections by Region, 2018-2028
Figure 28: Global A2 Milk Market Attractiveness Analysis, by Nature, 2018 & 2028
Figure 29: Global A2 Milk Market Attractiveness Analysis, by Form, 2018 & 2028
Figure 30: Global A2 Milk Market Attractiveness Analysis, by Application, 2018 & 2028
Figure 31: Global A2 Milk Market Attractiveness Analysis, by Packaging, 2018 & 2028
Figure 32: Global A2 Milk Market Attractiveness Analysis, by Distribution Channel, 2018 & 2028
Figure 33: Global A2 Milk Market Attractiveness Analysis, by Region, 2018 & 2028
Figure 34: North America A2 Milk Market Volume (MT) Analysis by Country, 2018 & 2028
Figure 35: North America A2 Milk Market Value (US$ Mn) Analysis by Country, 2018 & 2028
Figure 36: North America A2 Milk Market Value Share (%) and BPS Analysis by Country, 2018 & 2028
Figure 37: North America A2 Milk Market Y-o-Y Growth (%) Projections by Country, 2018-2028
Figure 38: North America A2 Milk Market Volume (MT) Analysis by Nature , 2018 & 2028
Figure 39: North America A2 Milk Market Value (US$ Mn) Analysis by Nature , 2018 & 2028
Figure 40: North America A2 Milk Market Value Share (%) and BPS Analysis by Nature, 2018 & 2028
Figure 41: North America A2 Milk Market Y-o-Y Growth (%) Projections by Nature , 2018-2028
Figure 42: North America A2 Milk Market Volume (MT) Analysis by Form, 2018 & 2028
Figure 43: North America A2 Milk Market Value (US$ Mn) Analysis by Form, 2018 & 2028
Figure 44: North America A2 Milk Market Value Share (%) and BPS Analysis by Form, 2018 & 2028
Figure 45: North America A2 Milk Market Y-o-Y Growth (%) Projections by Form, 2018-2028
Figure 46: North America A2 Milk Market Volume (MT) Analysis by Application, 2018 & 2028
Figure 47: North America A2 Milk Market Value (US$ Mn) Analysis by Application, 2018 & 2028
Figure 48: North America A2 Milk Market Value Share (%) and BPS Analysis by Application, 2018 & 2028
Figure 49: North America A2 Milk Market Y-o-Y Growth (%) Projections by Application, 2018-2028
Figure 50: North America A2 Milk Market Volume (MT) Analysis by Packaging, 2018 & 2028
Figure 51: North America A2 Milk Market Value (US$ Mn) Analysis by Packaging, 2018 & 2028
Figure 52: North America A2 Milk Market Value Share (%) and BPS Analysis by Packaging, 2018 & 2028
Figure 53: North America A2 Milk Market Y-o-Y Growth (%) Projections by Packaging, 2018-2028
Figure 54: North America A2 Milk Market Volume (MT) Analysis by distribution Channel, 2018 & 2028
Figure 55: North America A2 Milk Market Value (US$ Mn) Analysis by Distribution Channel, 2018 & 2028
Figure 56: North America A2 Milk Market Value Share (%) and BPS Analysis by Distribution Channel, 2018 & 2028
Figure 57: North America A2 Milk Market Y-o-Y Growth (%) Projections by Distribution Channel, 2018-2028
Figure 58: North America A2 Milk Market Attractiveness Analysis, by Nature, 2018 & 2028
Figure 59: North America A2 Milk Market Attractiveness Analysis, by Form, 2018 & 2028
Figure 60: North America A2 Milk Market Attractiveness Analysis, by Application, 2018 & 2028
Figure 61: North America A2 Milk Market Attractiveness Analysis, by Packaging, 2018 & 2028
Figure 62: North America A2 Milk Market Attractiveness Analysis, by Distribution Channel, 2018 & 2028
Figure 63: North America A2 Milk Market Attractiveness Analysis, by Country, 2018 & 2028
Figure 64: Latin America A2 Milk Market Volume (MT) Analysis by Country, 2018 & 2028
Figure 65: Latin America A2 Milk Market Value (US$ Mn) Analysis by Country, 2018 & 2028
Figure 66: Latin America A2 Milk Market Value Share (%) and BPS Analysis by Country, 2018 & 2028
Figure 67: Latin America A2 Milk Market Y-o-Y Growth (%) Projections by Country, 2018-2028
Figure 68: Latin America A2 Milk Market Volume (MT) Analysis by Nature , 2018 & 2028
Figure 69: Latin America A2 Milk Market Value (US$ Mn) Analysis by Nature , 2018 & 2028
Figure 70: Latin America A2 Milk Market Value Share (%) and BPS Analysis by Nature, 2018 & 2028
Figure 71: Latin America A2 Milk Market Y-o-Y Growth (%) Projections by Nature , 2018-2028
Figure 72: Latin America A2 Milk Market Volume (MT) Analysis by Form, 2018 & 2028
Figure 73: Latin America A2 Milk Market Value (US$ Mn) Analysis by Form, 2018 & 2028
Figure 74: Latin America A2 Milk Market Value Share (%) and BPS Analysis by Form, 2018 & 2028
Figure 75: Latin America A2 Milk Market Y-o-Y Growth (%) Projections by Form, 2018-2028
Figure 76: Latin America A2 Milk Market Volume (MT) Analysis by Application, 2018 & 2028
Figure 77: Latin America A2 Milk Market Value (US$ Mn) Analysis by Application, 2018 & 2028
Figure 78: Latin America A2 Milk Market Value Share (%) and BPS Analysis by Application, 2018 & 2028
Figure 79: Latin America A2 Milk Market Y-o-Y Growth (%) Projections by Application, 2018-2028
Figure 80: Latin America A2 Milk Market Volume (MT) Analysis by Packaging, 2018 & 2028
Figure 81: Latin America A2 Milk Market Value (US$ Mn) Analysis by Packaging, 2018 & 2028
Figure 82: Latin America A2 Milk Market Value Share (%) and BPS Analysis by Packaging, 2018 & 2028
Figure 83: Latin America A2 Milk Market Y-o-Y Growth (%) Projections by Packaging, 2018-2028
Figure 84: Latin America A2 Milk Market Volume (MT) Analysis by Distribution Channel, 2018 & 2028
Figure 85: Latin America A2 Milk Market Value (US$ Mn) Analysis by Distribution Channel, 2018 & 2028
Figure 86: Latin America A2 Milk Market Value Share (%) and BPS Analysis by Distribution cahnnel, 2018 & 2028
Figure 87: Latin America A2 Milk Market Y-o-Y Growth (%) Projections by Distribution Channel, 2018-2028
Figure 88: Latin America A2 Milk Market Attractiveness Analysis, by Nature, 2018 & 2028
Figure 89: Latin America A2 Milk Market Attractiveness Analysis, by Form, 2018 & 2028
Figure 90: Latin America A2 Milk Market Attractiveness Analysis, by Application, 2018 & 2028
Figure 91: Latin America A2 Milk Market Attractiveness Analysis, by Packaging, 2018 & 2028
Figure 92: Latin America A2 Milk Market Attractiveness Analysis, by Distribution Channel, 2018 & 2028
Figure 93: Latin America A2 Milk Market Attractiveness Analysis, by Country, 2018 & 2028
Figure 94: Europe A2 Milk Market Volume (MT) Analysis by Country, 2018 & 2028
Figure 95: Europe A2 Milk Market Value (US$ Mn) Analysis by Country, 2018 & 2028
Figure 96: Europe A2 Milk Market Value Share (%) and BPS Analysis by Country, 2018 & 2028
Figure 97: Europe A2 Milk Market Y-o-Y Growth (%) Projections by Country, 2018-2028
Figure 98: Europe A2 Milk Market Volume (MT) Analysis by Nature , 2018 & 2028
Figure 99: Europe A2 Milk Market Value (US$ Mn) Analysis by Nature , 2018 & 2028
Figure 100: Europe A2 Milk Market Value Share (%) and BPS Analysis by Nature, 2018 & 2028
Figure 101: Europe A2 Milk Market Y-o-Y Growth (%) Projections by Nature , 2018-2028
Figure 102: Europe A2 Milk Market Volume (MT) Analysis by Form, 2018 & 2028
Figure 103: Europe A2 Milk Market Value (US$ Mn) Analysis by Form, 2018 & 2028
Figure 104: Europe A2 Milk Market Value Share (%) and BPS Analysis by Form, 2018 & 2028
Figure 105: Europe A2 Milk Market Y-o-Y Growth (%) Projections by Form, 2018-2028
Figure 106: Europe A2 Milk Market Volume (MT) Analysis by Application, 2018 & 2028
Figure 107: Europe A2 Milk Market Value (US$ Mn) Analysis by Application, 2018 & 2028
Figure 108: Europe A2 Milk Market Value Share (%) and BPS Analysis by Application, 2018 & 2028
Figure 109: Europe A2 Milk Market Y-o-Y Growth (%) Projections by Application, 2018-2028
Figure 110: Europe A2 Milk Market Volume (MT) Analysis by Packaging, 2018 & 2028
Figure 111: Europe A2 Milk Market Value (US$ Mn) Analysis by Packaging, 2018 & 2028
Figure 112: Europe A2 Milk Market Value Share (%) and BPS Analysis by Packaging, 2018 & 2028
Figure 113: Europe A2 Milk Market Y-o-Y Growth (%) Projections by Packaging, 2018-2028
Figure 114: Europe A2 Milk Market Volume (MT) Analysis by Distribution Channel, 2018 & 2028
Figure 115: Europe A2 Milk Market Value (US$ Mn) Analysis by Distribution Channel, 2018 & 2028
Figure 116: Europe A2 Milk Market Value Share (%) and BPS Analysis by Distribution Channel, 2018 & 2028
Figure 117: Europe A2 Milk Market Y-o-Y Growth (%) Projections by Distribution Channel, 2018-2028
Figure 118: Europe A2 Milk Market Attractiveness Analysis, by Nature, 2018 & 2028
Figure 119: Europe A2 Milk Market Attractiveness Analysis, by Form, 2018 & 2028
Figure 120: Europe A2 Milk Market Attractiveness Analysis, by Application, 2018 & 2028
Figure 121: Europe A2 Milk Market Attractiveness Analysis, by Packaging, 2018 & 2028
Figure 122: Europe A2 Milk Market Attractiveness Analysis, by Distribution Channel, 2018 & 2028
Figure 123: Europe A2 Milk Market Attractiveness Analysis, by Country, 2018 & 2028
Figure 124: APAC A2 Milk Market Volume (MT) Analysis by Country, 2018 & 2028
Figure 125: APAC A2 Milk Market Value (US$ Mn) Analysis by Country, 2018 & 2028
Figure 126: APAC A2 Milk Market Value Share (%) and BPS Analysis by Country, 2018 & 2028
Figure 127: APAC A2 Milk Market Y-o-Y Growth (%) Projections by Country, 2018-2028
Figure 128: APAC A2 Milk Market Volume (MT) Analysis by Nature , 2018 & 2028
Figure 129: APAC A2 Milk Market Value (US$ Mn) Analysis by Nature , 2018 & 2028
Figure 130: APAC A2 Milk Market Value Share (%) and BPS Analysis by Nature, 2018 & 2028
Figure 131: APAC A2 Milk Market Y-o-Y Growth (%) Projections by Nature , 2018-2028
Figure 132: APAC A2 Milk Market Volume (MT) Analysis by Form, 2018 & 2028
Figure 133: APAC A2 Milk Market Value (US$ Mn) Analysis by Form, 2018 & 2028
Figure 134: APAC A2 Milk Market Value Share (%) and BPS Analysis by Form, 2018 & 2028
Figure 135: APAC A2 Milk Market Y-o-Y Growth (%) Projections by Form, 2018-2028
Figure 136: APAC A2 Milk Market Volume (MT) Analysis by Application, 2018 & 2028
Figure 137: APAC A2 Milk Market Value (US$ Mn) Analysis by Application, 2018 & 2028
Figure 138: APAC A2 Milk Market Value Share (%) and BPS Analysis by Application, 2018 & 2028
Figure 139: APAC A2 Milk Market Y-o-Y Growth (%) Projections by Application, 2018-2028
Figure 140: APAC A2 Milk Market Volume (MT) Analysis by Packaging, 2018 & 2028
Figure 141: APAC A2 Milk Market Value (US$ Mn) Analysis by Packaging, 2018 & 2028
Figure 142: APAC A2 Milk Market Value Share (%) and BPS Analysis by Packaging, 2018 & 2028
Figure 143: APAC A2 Milk Market Y-o-Y Growth (%) Projections by Packaging, 2018-2028
Figure 144: APAC A2 Milk Market Volume (MT) Analysis by Distribution Channel, 2018 & 2028
Figure 145: APAC A2 Milk Market Value (US$ Mn) Analysis by Distribution Channel, 2018 & 2028
Figure 146: APAC A2 Milk Market Value Share (%) and BPS Analysis by Distribution Channel, 2018 & 2028
Figure 147: APAC A2 Milk Market Y-o-Y Growth (%) Projections by Distribution Channel, 2018-2028
Figure 148: APAC A2 Milk Market Attractiveness Analysis, by Nature, 2018 & 2028
Figure 149: APAC A2 Milk Market Attractiveness Analysis, by Form, 2018 & 2028
Figure 150: APAC A2 Milk Market Attractiveness Analysis, by Application, 2018 & 2028
Figure 151: APAC A2 Milk Market Attractiveness Analysis, by Packaging, 2018 & 2028
Figure 152: APAC A2 Milk Market Attractiveness Analysis, by Distribution Channel, 2018 & 2028
Figure 153: APAC A2 Milk Market Attractiveness Analysis, by Country, 2018 & 2028
Figure 154: MEA A2 Milk Market Volume (MT) Analysis by Country, 2018 & 2028
Figure 155: MEA A2 Milk Market Value (US$ Mn) Analysis by Country, 2018 & 2028
Figure 156: MEA A2 Milk Market Value Share (%) and BPS Analysis by Country, 2018 & 2028
Figure 157: MEA A2 Milk Market Y-o-Y Growth (%) Projections by Country, 2018-2028
Figure 158: MEA A2 Milk Market Volume (MT) Analysis by Nature , 2018 & 2028
Figure 159: MEA A2 Milk Market Value (US$ Mn) Analysis by Nature , 2018 & 2028
Figure 160: MEA A2 Milk Market Value Share (%) and BPS Analysis by Nature, 2018 & 2028
Figure 161: MEA A2 Milk Market Y-o-Y Growth (%) Projections by Nature , 2018-2028
Figure 162: MEA A2 Milk Market Volume (MT) Analysis by Form, 2018 & 2028
Figure 163: MEA A2 Milk Market Value (US$ Mn) Analysis by Form, 2018 & 2028
Figure 164: MEA A2 Milk Market Value Share (%) and BPS Analysis by Form, 2018 & 2028
Figure 165: MEA A2 Milk Market Y-o-Y Growth (%) Projections by Form, 2018-2028
Figure 166: MEA A2 Milk Market Volume (MT) Analysis by Application, 2018 & 2028
Figure 167: MEA A2 Milk Market Value (US$ Mn) Analysis by Application, 2018 & 2028
Figure 168: MEA A2 Milk Market Value Share (%) and BPS Analysis by Application, 2018 & 2028
Figure 169: MEA A2 Milk Market Y-o-Y Growth (%) Projections by Application, 2018-2028
Figure 170: MEA A2 Milk Market Volume (MT) Analysis by Packaging, 2018 & 2028
Figure 171: MEA A2 Milk Market Value (US$ Mn) Analysis by Packaging, 2018 & 2028
Figure 172: MEA A2 Milk Market Value Share (%) and BPS Analysis by Packaging, 2018 & 2028
Figure 173: MEA A2 Milk Market Y-o-Y Growth (%) Projections by Packaging, 2018-2028
Figure 174: MEA A2 Milk Market Volume (MT) Analysis by Distribution Channel, 2018 & 2028
Figure 175: MEA A2 Milk Market Value (US$ Mn) Analysis by Distribution Channel, 2018 & 2028
Figure 176: MEA A2 Milk Market Value Share (%) and BPS Analysis by Distribution Channel, 2018 & 2028
Figure 177: MEA A2 Milk Market Y-o-Y Growth (%) Projections by Distribution Channel, 2018-2028
Figure 178: MEA A2 Milk Market Attractiveness Analysis, by Nature, 2018 & 2028
Figure 179: MEA A2 Milk Market Attractiveness Analysis, by Form, 2018 & 2028
Figure 180: MEA A2 Milk Market Attractiveness Analysis, by Application, 2018 & 2028 Figure 181: MEA A2 Milk Market Attractiveness Analysis, by Packaging, 2018 & 2028 Figure 182: MEA A2 Milk Market Attractiveness Analysis, by Distribution Channel, 2018 & 2028
Figure 183: MEA A2 Milk Market Attractiveness Analysis, by Country, 2018 & 2028
Copyright © Transparency Market Research, Inc. All Rights reserved
Trust Online

A2 Milk Market