
Reports
Reports
The recuperating economy of the U.S. has offered a substantial growth opportunity to the market for specialty printing consumables in this country. The construction of new offices and the rejuvenation of older ones in order to support business activities have propelled the application of these consumables significantly. Additionally, the rise in demand for digital cameras as well as color laser printing is boosting the adoption of these consumables across the nation. The current trend among U.S. citizens of in-house printing of photographs is also adding significantly to this growing demand.
Going forward, the growing application of specialty printing consumables in various printing procedures such as marking of tags and labels and printing on consumer products is expected to boost their demand substantially over the next few years. In 2015, the opportunity in the U.S. specialty printing consumables market was pegged at US$24.09 bn. Rising at a CAGR of 4.4% between 2016 and 2024, it is expected to be worth US$35.75 bn by 2024.
On the whole, the opportunity in this market looks rewarding; however, the lack of raw materials, coupled with stringent regulations regarding their usage, is likely to hamper the adoption of these consumables to some extent in the near future. Apart from this, the rapid advent of electronic media replacing the concept of paper printing in this country will pose a serious threat to the market’s growth over the next few years.
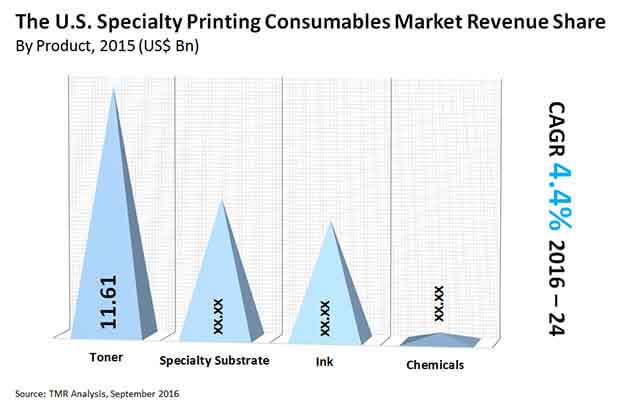
Inks, toners, chemicals, and specialty substrates are the key specialty printing consumables available in the global market. In 2015, the demand for toners was the highest among these with a share of just over 48%. The segment is likely to remain dominant for the rest of the forecast period, expanding at a CAGR of 4.5%.
The specialty substrate segment is also anticipated to register significant growth in the coming years. An upswing in the adoption of digital cameras is projected to boost the demand for these substrates at a 5.4% CAGR from 2016 to 2024.
The lithographic printing segment of the overall specialty printing chemicals market in the U.S. contributed majority market share in 2015 by printing process and is likely to retain its dominance throughout the forecast period. Digital printing, on the other hand, is anticipated to register a CAGR higher than any other segment from 2016 to 2024.
TMR finds that lithographic printing as well as digital printing will continue to have a significant impact on the specialty printing consumables product market, be it toners, inks, specialty substrates, and chemicals.
In 2015, the office and professional segment of the U.S. specialty printing consumables market emerged as the key contributor by application and is forecast to retain its lead through 2024. This segment is also projected to expand at a pace greater than other application segments.
Research analysts at TMR have noted that while the office and professional application segment will retain its dominance in the specialty printing consumables product market, the segment expanding at the fastest pace will differ from product to product. The commercial printing and publishing sector has been identified as one of the rapidly growing application segments.
The specialty printing consumables market in the U.S. is led by HP Development Co., Xerox Corp., DIC Corp., Canon Inc., and Eastman Kodak Co. Some of the other prominent manufacturers of specialty printing consumables in this nation are Claire Manufacturing Co., Arizona Chemical, American Ink Jet Corp., 3M, and FUJIFILM.
The Specialty Printing Consumables Market is studied from 2016 - 2024.
The Specialty Printing Consumables market is projected to reach the valuation of US$ 35.75 Bn by 2024
The Specialty Printing Consumables market is expected to grow at a CAGR of 4.4% during 2019-2030
HP Development Co., Xerox Corp., DIC Corp., Canon Inc., and Eastman Kodak Co. are the key vendors in the Specialty Printing Consumables market.
The key factors driving the Specialty Printing Consumables market growth are: Demand for Specialty Printing Consumables market in the U.S. is highly influenced by the rapid expansion of the country’s IT and industrial sectors
1. Preface
1.1. Research Scope
1.2. Market Segmentation
1.3. Research Methodology
2. Executive Summary
2.1. The U.S. Specialty Printing Consumables Market Snapshot
2.2. The U.S. Specialty Printing Consumables Market Revenue, 2014 - 2024 (US$ Bn) and Year-on-Year Growth (%)
3. The U.S. Specialty Printing Consumables Market Analysis, 2014 - 2024 (US$ Bn)
3.1. Key Trends Analysis
3.2. Market Dynamics
3.2.1. Drivers
3.2.2. Restraints
3.2.3. Opportunities
3.3. The U.S. Specialty Printing Consumables Market, By Printing Process, 2014 - 2024 (US$ Bn)
3.3.1. Overview
3.3.2. Lithographic Printing
3.3.3. Flexographic Printing
3.3.4. Rotogravure Printing
3.3.5. Digital Printing
3.4. The U.S. Specialty Printing Consumables Market Analysis, By Product, 2014 - 2024 (US$ Bn)
3.4.1. Overview
3.4.2. Toner
3.4.3. Ink
3.4.4. Specialty Substrate
3.4.5. Chemicals
3.5. The U.S. Specialty Printing Consumables Market Analysis, By Application, 2014 - 2024 (US$ Bn)
3.5.1. Overview
3.5.2. Office And Professional Application
3.5.3. Commercial Printing And Publishing Application
3.5.4. Other Application
3.6. The U.S. Specialty Printing Consumables Product (Toner) Market, By Printing Process, 2014 - 2024 (US$ Bn)
3.6.1. Overview
3.6.2. Lithographic Printing
3.6.3. Flexographic Printing
3.6.4. Rotogravure Printing
3.6.5. Digital Printing
3.7. The U.S. Specialty Printing Consumables Product (Ink) Market, By Printing Process, 2014 - 2024 (US$ Bn)
3.7.1. Overview
3.7.2. Lithographic Printing
3.7.3. Flexographic Printing
3.7.4. Rotogravure Printing
3.7.5. Digital Printing
3.8. The U.S. Specialty Printing Consumables Product (Specialty Substrate) Market, By Printing Process, 2014 - 2024 (US$ Bn)
3.8.1. Overview
3.8.2. Lithographic Printing
3.8.3. Flexographic Printing
3.8.4. Rotogravure Printing
3.8.5. Digital Printing
3.9. The U.S. Specialty Printing Consumables Product (Chemicals) Market, By Printing Process, 2014 - 2024 (US$ Bn)
3.9.1. Overview
3.9.2. Lithographic Printing
3.9.3. Flexographic Printing
3.9.4. Rotogravure Printing
3.9.5. Digital Printing
3.10. The U.S. Specialty Printing Consumables Product (Toner) Market, By Application, 2014 - 2024 (US$ Bn)
3.10.1. Overview
3.10.2. Office and Professional Application
3.10.3. Commercial Printing and Publishing Application
3.10.4. Other Application
3.11. The U.S. Specialty Printing Consumables Product (Ink) Market, By Application, 2014 - 2024 (US$ Bn)
3.11.1. Overview
3.11.2. Office and Professional Application
3.11.3. Commercial Printing and Publishing Application
3.11.4. Other Application
3.12. The U.S. Specialty Printing Consumables Product (Specialty Substrate) Market, By Application, 2014 - 2024 (US$ Bn)
3.12.1. Overview
3.12.2. Office and Professional Application
3.12.3. Commercial Printing and Publishing Application
3.12.4. Other Application
3.13. The U.S. Specialty Printing Consumables Product (Chemicals) Market, By Application, 2014 - 2024 (US$ Bn)
3.13.1. Overview
3.13.2. Office and Professional Application
3.13.3. Commercial Printing and Publishing Application
4. Company Profiles
4.1. DIC Corporation
4.1.1. Company Details (HQ, Foundation Year, Employee Strength)
4.1.2. Market Presence, By Segment and Geography
4.1.3. Key Developments
4.1.4. Strategy and Historical Roadmap
4.1.5. Revenue and Operating Profits
4.2. Canon Inc.
4.2.1. Company Details (HQ, Foundation Year, Employee Strength)
4.2.2. Market Presence, By Segment and Geography
4.2.3. Key Developments
4.2.4. Strategy and Historical Roadmap
4.2.5. Revenue and Operating Profits
4.3. Xerox Corporation
4.3.1. Company Details (HQ, Foundation Year, Employee Strength)
4.3.2. Market Presence, By Segment and Geography
4.3.3. Key Developments
4.3.4. Strategy and Historical Roadmap
4.3.5. Revenue and Operating Profits
4.4. HP Development Company, L.P.
4.4.1. Company Details (HQ, Foundation Year, Employee Strength)
4.4.2. Market Presence, By Segment and Geography
4.4.3. Key Developments
4.4.4. Strategy and Historical Roadmap
4.4.5. Revenue and Operating Profits
4.5. Eastman Kodak Co.
4.5.1. Company Details (HQ, Foundation Year, Employee Strength)
4.5.2. Market Presence, By Segment and Geography
4.5.3. Key Developments
4.5.4. Strategy and Historical Roadmap
4.5.5. Revenue and Operating Profits
4.6. Flint Ink Incorporation
4.6.1. Company Details (HQ, Foundation Year, Employee Strength)
4.6.2. Market Presence, By Segment and Geography
4.6.3. Key Developments
4.6.4. Strategy and Historical Roadmap
4.6.5. Revenue and Operating Profits
4.7. Nazdar Ink Technologies
4.7.1. Company Details (HQ, Foundation Year, Employee Strength)
4.7.2. Market Presence, By Segment and Geography
4.7.3. Key Developments
4.7.4. Strategy and Historical Roadmap
4.7.5. Revenue and Operating Profits
List of Tables
Table 1 Market Snapshot
Table 2 Common printing processes used for high-volume products
Table 3 Specialty Printing Process Analysis, By Requirements
Table 4 The U.S. Specialty Printing Consumables Market Analysis, By Printing Process, 2014 – 2024 (US$ Bn)
Table 5 The U.S. Specialty Printing Consumables Market Analysis, By Product, 2014 – 2024 (US$ Bn)
Table 6 The U.S. Specialty Printing Consumables Market Analysis, By Application, 2014 – 2024 (US$ Bn)
Table 7 The U.S. Specialty Printing Consumables Product (Toner) Market Analysis, By Printing Process, 2014 – 2024 (US$ Bn)
Table 8 The U.S. Specialty Printing Consumables Product (Ink) Market Analysis, By Printing Process, 2014 – 2024 (US$ Bn)
Table 9 The U.S. Specialty Printing Consumables Product (Specialty Substrate) Market Analysis, By Printing Process, 2014 – 2024 (US$ Bn)
Table 10 The U.S. Specialty Printing Consumables Product (Chemicals) Market Analysis, By Printing Process, 2014 – 2024 (US$ Bn)
Table 11 The U.S. Specialty Printing Consumables Product (Toner) Market Analysis, By Application, 2014 – 2024 (US$ Bn)
Table 12 The U.S. Specialty Printing Consumables Product (Ink) Market Analysis, By Application, 2014 – 2024 (US$ Bn)
Table 13 The U.S. Specialty Printing Consumables Product (Specialty Substrate) Market Analysis, By Application, 2014 – 2024 (US$ Bn)
Table 14 The U.S. Specialty Printing Consumables Product (Chemicals) Market Analysis, By Application, 2014 – 2024 (US$ Bn)
List of Figures
FIG. 1 The U.S. Specialty Printing Consumables Market Revenues, 2014 – 2024 (US$ Bn) and Y-o-Y Growth (%)
FIG. 2 The U.S. Specialty Printing Consumables Market Revenues (US$ Bn), 2016 & 2024, CAGR (%)
FIG. 3 Lithographic Printing Analysis, By Industry
FIG. 4 Flexographic Printing Analysis, By Industry
FIG. 5 Rotogravure Printing Analysis, By Industry
FIG. 6 Digital Printing Analysis, By Industry
FIG. 7 The U.S. Market Share, Printing Process, 2015 & 2024 (%)
FIG. 8 The U.S. Market Share, Product, 2015 & 2024 (%)
FIG. 9 The U.S. Market Share, Application, 2015 & 2024 (%)
FIG. 10 The U.S. Toner Market Share, Printing Process, 2015 & 2024 (%)
FIG. 11 The U.S. Ink Market Share, Printing Process, 2015 & 2024 (%)
FIG. 12 The U.S. Specialty Substrate Market Share, Printing Process, 2015 & 2024 (%)
FIG. 13 The U.S. Chemicals Market Share, Printing Process, 2015 & 2024 (%)
FIG. 14 The U.S. Toner Market Share, Application, 2015 & 2024 (%)
FIG. 15 The U.S. Ink Market Share, Application, 2015 & 2024 (%)
FIG. 16 The U.S. Specialty Substrate Market Share, Application, 2015 & 2024 (%)
FIG. 17 The U.S. Chemicals Market Share, Application, 2015 & 2024 (%)
FIG. 18 Market Positioning of Key Players, 2015
Copyright © Transparency Market Research, Inc. All Rights reserved
Trust Online

U.S. Specialty Printing Consumables Market