
Reports
Reports
Thermic Fluids Market: Snapshot
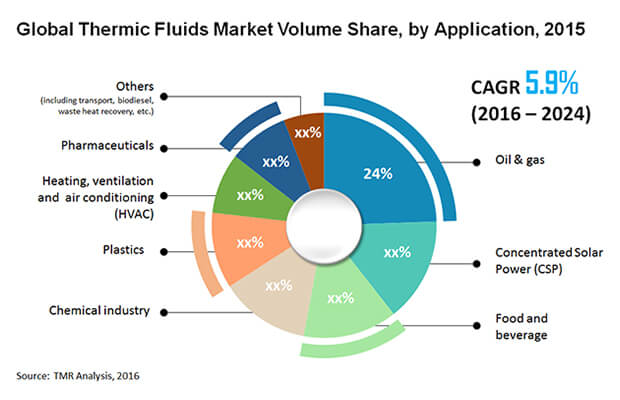
The global thermic fluids market is predicted to dictate highest revenues in the upcoming years. Key factor supporting this prediction is increased use of thermic fluids in a gamut of applications. Concentrated solar power, plastics, oil and gas, food and beverages, HVAC, chemicals, and pharmaceuticals are some of the key end-user industries owing to which the global thermic fluids market is witnessing stupendous demand avenues.
In recent period, oil and natural gas industry is showing growth at rapid speed. This factor is projected to push the development of the global thermic fluids market in the upcoming years. Key reason for this projection is usability of thermic fluids in oil and natural gas extraction as a temperature-regulating medium. There is rise in awareness about the advantage of thermic fluids over other alternatives. This is one of the key factors pushing the growth of the global thermic fluids market.
The global thermic fluids market is projected to witness increased demand from the pharmaceutical industry. Key reason supporting this estimation is rising use of thermic fluids in wide range of applications. Besides, presence of many well-established vendors in the global thermic fluids market is making the entry of new players somewhat difficult. Many enterprises are focused on strengthening their market position by executing diverse tactics such as mergers, acquisitions, partnerships, and collaborations. All these activities are estimated to stimulate the growth of the global thermic fluids market during the years ahead.
The global thermic fluids market is witnessing remarkable growth avenues from Europe. One of the key factors for this growth opportunity is increased rising application of thermic fluids for thermal storage in concentrated solar power plants. In addition to this, increased awareness about the use of thermic fluids in renewable energy technologies is driving the market growth in Europe.
Widespread use of thermic fluids in a plethora of industries such as plastics, concentrated solar power, food and beverages, oil and gas, pharmaceuticals, HVAC, and chemicals, is mainly driving growth in the associated market. Moreover, these fluids present numerous advantages over other alternative, thus possessing high demand. A rapidly expanding oil and natural gas industry too is making the global thermic fluids markets grow at a phenomenal pace. This is mainly due to a high need of these fluids in the context of oil and natural gas extraction in the form of mediums that help regulate temperature.
Statistically speaking, the global thermic fluids market is prophesized to register revenue valued at US$4.17 bn by 2024, which is decent rise from initial revenue worth US$2.1 bn clocked in 2014. This growth is projected to occur at an impressive CAGR of 7.1% during the forecast period from 2016 – 2024.
The global thermic fluids market is segregated into innumerable segments on the basis of three key criteria: product type, end-user, and regional spread. Under product type, silicone and aromatic based thermic fluids, mineral oil based thermic fluids, glycol (ethylene and propylene) based thermic fluids, and others, are key segments. Whereas with respect to end users, the global thermic fluids market consists of segments such as oil & gas, chemical, concentrated solar power, food & beverages, plastics, pharmaceuticals, heating, ventilation, and air conditioning, and others.
Oil and Gas Industry to Remain the Kingly Segment Thanks to Rising Resource Demand
Under product type, mineral oil based thermic fluids are expected to showcase extensive growth in the global thermic fluids market. This is mainly due to rising demand for these fluids thanks to their various advantages. Besides these, the glycol based thermic fluids also is expected to hold a leading position, thereby becoming an important segment in the market during the next few years.
With respect to end users, the oil and natural gas industry segment is prophesized to trump all others thanks to the widespread need of the fluids to operate facilitate specific processes. Tremendous growth opportunities lie in this sector, with a recent valuation of US$479.4 mn possesses by the oil and natural gas industry. Apart from this sector, the chemicals industry too is showcasing handsome growth in the global thermic fluids market. To be more specific, this segment was valued at impressive revenue of US$254.4 mn in 2014, and is envisaged to expand at a healthy CAGR of 6.6% during the forecast period. In addition, the concentrated solar power segment is also depicting a promising growth in this market, by progressing at a splendid CAGR of 8.3% during the same forecast period.
Europe Holds Leading Edge in the Market Thanks to High Solar Power Utilization
Geography-wise, the global thermic fluids market is spread across North America, South America, Asia Pacific, Europe, and the Middle East and Africa. Of these, a rising application of thermic fluids for thermal storage in concentrated solar power plants situated in Europe have made this region hold a leading position in the market. Moreover, a surge in awareness regarding use of thermic fluids in renewable energy harnessing technologies too has made Europe generate immense revenue from the global thermic fluids market.
Kost USA, Inc., British Petroleum (BP), Dynalene Inc., Paratherm Corporation, Dow Chemicals, Eastman Chemical Company, Exxon Mobil Corporation, Multitherm LLC, Royal Dutch Shell, and BASF SE, are key players operating in the global thermic fluids market.
Table of Contents
Chapter 1 Preface
1.1 Report Description
1.2 Research Scope
1.3 Assumptions
1.4 Market Segmentation
1.5 Research Methodology
Chapter 2 Executive Summary
2.1 Global Thermic fluids Market, 2014 - 2024, (Kilo Tons) (US$ Mn)
2.2 Thermic fluids: Market Snapshot
Chapter 3 Thermic fluids Market - Industry Analysis
3.1 Introduction
3.2 Value Chain Analysis
3.3 Market Drivers
3.3.1 Growing Concentrated Solar Power (CSP) Production
3.3.2 Advantages of Thermal Fluid Systems Over Steam Systems
3.3.3 FDA Approval for Food Grade Thermic Fluids
3.4 Restraints
3.4.1 Volatile Raw Material Prices
3.5 Opportunity
3.5.1 Increase in Production of Bio-based Thermic Fluids
3.5.2 Growth of Major End-Use Industries In Asia Pacific
3.6 Porter’s Five Forces Analysis
3.6.1 Bargaining Power of Suppliers
3.6.2 Bargaining Power of Buyers
3.6.3 Threat of New Entrants
3.6.4 Threat of Substitutes
3.6.5 Degree of Competition
3.7 Global Thermic fluids Market Attractiveness, by End-user, 2014
3.8 Global Thermic fluids Market Attractiveness, by Country, 2014
Chapter 4 Price Trend Analysis
4.4 Global Average Thermic fluids Price Trend, 2014–2024 (US$/Kg)
Chapter 5 Global Thermic fluids Market - Product Segment Analysis
5.2 Global Thermic fluids Market: Product Segment Overview
5.2 Global Thermic fluids Market for Silicone and Aromatic Based Thermic Fluid, 2014–2024 (Kilo Tons) (US$ Mn)
5.3 Global Thermic fluids Market for Mineral Oils Based Thermic Fluid, 2014–2024 (Kilo Tons) (US$ Mn)
5.4 Global Thermic fluids Market for Glycol (Ethylene and Propylene) Based Thermic Fluid, 2014–2024 (Kilo Tons) (US$ Mn)
5.5 Global Thermic fluids Market for Other (Including Molten Salts & HFPE Thermic Fluids, Etc.), 2014–2024 (Kilo Tons) (US$ Mn)
Chapter 6 Global Thermic fluids Market – End-user Analysis
6.1 Global Thermic fluids Market: End-user Overview
6.2 Global Thermic fluids Market for Chemical Industry, 2014–2024 (Kilo Tons) (US$ Mn)
6.3 Global Thermic fluids Market for Concentrated Solar Power (CSP), 2014–2024 (Kilo Tons) (US$ Mn)
6.4 Global Thermic fluids Market for Food and Beverage, 2014–2024 (Kilo Tons) (US$ Mn)
6.5 Global Thermic fluids Market for Plastics, 2014–2024 (Kilo Tons) (US$ Mn)
6.6 Global Thermic fluids Market for Pharmaceuticals, 2014–2024 (Kilo Tons) (US$ Mn)
6.7 Global Thermic fluids Market for Heating, Ventilation and Air Conditioning (HVAC), 2014–2024 (Kilo Tons) (US$ Mn)
6.8 Global Thermic fluids Market for Others (Including Transport, Biodiesel, Waste Heat Recovery, etc.), 2014–2024 (Kilo Tons) (US$ Mn)
Chapter 7 Global Thermic fluids Market - Regional Analysis
7.1 Global Thermic fluids Market: Regional Overview
7.2 North America Thermic fluids Market, 2014 and 2024
7.2.1 North America Thermic fluids Market Volume, by Product Segment, 2014–2024 (Kilo Tons)
7.2.2 North America Thermic fluids Market Revenue, by Product Segment, 2014–2024 (US$ Mn)
7.2.3 North America Thermic fluids Market Volume, by End-user, 2014–2024 (Kilo Tons)
7.2.4 North America Thermic fluids Market Revenue, by End-user, 2014–2024 (US$ Mn)
7.2.5 U.S. Thermic fluids Market Volume, by Product Segment, 2014–2024 (Kilo Tons)
7.2.6 U.S. Thermic fluids Market Revenue, by Product Segment, 2014–2024 (US$ Mn)
7.2.7 U.S. Thermic fluids Market Volume, by End-user, 2014–2024 (Kilo Tons)
7.2.8 U.S. Thermic fluids Market Revenue, by End-user, 2014–2024 (US$ Mn)
7.2.9 Rest of North America Thermic fluids Market Volume, by Product Segment, 2014–2024 (Kilo Tons)
7.2.10 Rest of North America Thermic fluids Market Revenue, by Product Segment, 2014–2024 (US$ Mn)
7.2.11 Rest of North America Thermic fluids Market Volume, by End-user, 2014–2024 (Kilo Tons)
7.2.12 Rest of North America Thermic fluids Market Revenue, by End-user, 2014–2024 (US$ Mn)
7.3 Europe Thermic fluids Market, 2014 and 2024
7.3.1 Europe Thermic fluids Market Volume, by Product Segment, 2014–2024 (Kilo Tons)
7.3.2 Europe Thermic fluids Market Revenue, by Product Segment, 2014–2024 (US$ Mn)
7.3.3 Europe Thermic fluids Market Volume, by End-user, 2014–2024 (Kilo Tons)
7.3.4 Europe Thermic fluids Market Revenue, by End-user, 2014–2024 (US$ Mn)
7.3.5 France Thermic fluids Market Volume, by Product Segment, 2014–2024 (Kilo Tons)
7.3.6 France Thermic fluids Market Revenue, by Product Segment, 2014–2024 (US$ Mn)
7.3.7 France Thermic fluids Market Volume, by End-user, 2014–2024 (Kilo Tons)
7.3.8 France Thermic fluids Market Revenue, by End-user, 2014–2024 (US$ Mn)
7.3.9 UK Thermic fluids Market Volume, by Product Segment, 2014–2024 (Kilo Tons)
7.3.10 UK Thermic fluids Market Revenue, by Product Segment, 2014–2024 (US$ Mn)
7.3.11 UK Thermic fluids Market Volume, by End-user, 2014–2024 (Kilo Tons)
7.3.12 UK Thermic fluids Market Revenue, by End-user, 2014–2024 (US$ Mn)
7.3.13 Spain Thermic fluids Market Volume, by Product Segment, 2014–2024 (Kilo Tons)
7.3.14 Spain Thermic fluids Market Revenue, by Product Segment, 2014–2024 (US$ Mn)
7.3.15 Spain Thermic fluids Market Volume, by End-user, 2014–2024 (Kilo Tons)
7.3.16 Spain Thermic fluids Market Revenue, by End-user, 2014–2024 (US$ Mn)
7.3.17 Germany Thermic fluids Market Volume, by Product Segment, 2014–2024 (Kilo Tons)
7.3.18 Germany Thermic fluids Market Revenue, by Product Segment, 2014–2024 (US$ Mn)
7.3.19 Germany Thermic fluids Market Volume, by End-user, 2014–2024 (Kilo Tons)
7.3.20 Germany Thermic fluids Market Revenue, by End-user, 2014–2024 (US$ Mn)
7.3.21 Italy Thermic fluids Market Volume, by Product Segment, 2014–2024 (Kilo Tons)
7.3.22 Italy Thermic fluids Market Revenue, by Product Segment, 2014–2024 (US$ Mn)
7.3.23 Italy Thermic fluids Market Volume, by End-user, 2014–2024 (Kilo Tons)
7.3.24 Italy Thermic fluids Market Revenue, by End-user, 2014–2024 (US$ Mn)
7.3.25 Rest of Europe Thermic fluids Market Volume, by Product Segment, 2014–2024 (Kilo Tons)
7.3.26 Rest of Europe Thermic fluids Market Revenue, by Product Segment, 2014–2024 (US$ Mn)
7.3.27 Rest of Europe Thermic fluids Market Volume, by End-user, 2014–2024 (Kilo Tons)
7.3.28 Rest of Europe Thermic fluids Market Revenue, by End-user, 2014–2024 (US$ Mn)
7.4 Asia Pacific (APAC) Thermic fluids Market, 2014 and 2024
7.4.1 Asia Pacific Thermic fluids Market Volume, by Product Segment, 2014–2024 (Kilo Tons)
7.4.2 Asia Pacific Thermic fluids Market Revenue, by Product Segment, 2014–2024 (US$ Mn)
7.4.3 Asia Pacific Thermic fluids Market Volume, by End-user, 2014–2024 (Kilo Tons)
7.4.4 Asia Pacific Thermic fluids Market Revenue, by End-user, 2014–2024 (US$ Mn)
7.4.5 China Thermic fluids Market Volume, by Product Segment, 2014–2024 (Kilo Tons)
7.4.6 China Thermic fluids Market Revenue, by Product Segment, 2014–2024 (US$ Mn)
7.4.7 China Thermic fluids Market Volume, by End-user, 2014–2024 (Kilo Tons)
7.4.8 China Thermic fluids Market Revenue, by End-user, 2014–2024 (US$ Mn)
7.4.9 Thermic fluids Market Volume, by Product Segment, 2014–2024 (Kilo Tons)
7.4.10 Japan Thermic fluids Market Revenue, by Product Segment, 2014–2024 (US$ Mn)
7.4.11 Japan Thermic fluids Market Volume, by End-user, 2014–2024 (Kilo Tons)
7.4.12 Japan Thermic fluids Market Revenue, by End-user, 2014–2024 (US$ Mn)
7.4.21 ASEAN Thermic fluids Market Volume, by Product Segment, 2014–2024 (Kilo Tons)
7.4.22 ASEAN Thermic fluids Market Revenue, by Product Segment, 2014–2024 (US$ Mn)
7.4.23 ASEAN Thermic fluids Market Volume, by End-user, 2014–2024 (Kilo Tons)
7.4.24 ASEAN Thermic fluids Market Revenue, by End-user, 2014–2024 (US$ Mn)
7.4.25 Rest of APAC Thermic fluids Market Volume, by Product Segment, 2014–2024 (Kilo Tons)
7.4.26 Rest of APAC Thermic fluids Market Revenue, by Product Segment, 2014–2024 (US$ Mn)
7.4.27 Rest of APAC Thermic fluids Market Volume, by End-user, 2014–2024 (Kilo Tons)
7.4.28 Rest of APAC Thermic fluids Market Revenue, by End-user, 2014–2024 (US$ Mn)
7.5 Latin America (LA) Thermic fluids Market, 2014 and 2024
7.5.1 Latin America Thermic fluids Market Volume, by Product Segment, 2014–2024 (Kilo Tons)
7.5.2 Latin America Thermic fluids Market Revenue, by Product Segment, 2014–2024 (US$ Mn)
7.5.3 Latin America Thermic fluids Market Volume, by End-user, 2014–2024 (Kilo Tons)
7.5.4 Latin America Thermic fluids Market Revenue, by End-user, 2014–2024 (US$ Mn)
7.5.5 Brazil Thermic fluids Market Volume, by Product Segment, 2014–2024 (Kilo Tons)
7.5.6 Brazil Thermic fluids Market Revenue, by Product Segment, 2014–2024 (US$ Mn)
7.5.7 Brazil Thermic fluids Market Volume, by End-user, 2014–2024 (Kilo Tons)
7.5.8 Brazil Thermic fluids Market Revenue, by End-user, 2014–2024 (US$ Mn)
7.5.9 Rest of LA Thermic fluids Market Volume, by Product Segment, 2014–2024 (Kilo Tons)
7.5.10 Rest of LA Thermic fluids Market Revenue, by Product Segment, 2014–2024 (US$ Mn)
7.5.11 Rest of LA Thermic fluids Market Volume, by End-user, 2014–2024 (Kilo Tons)
7.5.12 Rest of LA Thermic fluids Market Revenue, by End-user, 2014–2024 (US$ Mn)
7.6 Middle East & Africa (MEA) Thermic fluids Market, 2014 and 2024
7.6.1 Middle East & Africa Thermic fluids Market Volume, by Product Segment, 2014–2024 (Kilo Tons)
7.6.2 Middle East & Africa Thermic fluids Market Revenue, by Product Segment, 2014–2024 (US$ Mn)
7.6.3 Middle East & Africa Thermic fluids Market Volume, by End-user, 2014–2024 (Kilo Tons)
7.6.4 Middle East & Africa Thermic fluids Market Revenue, by End-user, 2014–2024 (US$ Mn)
7.6.5 GCC Thermic fluids Market Volume, by Product Segment, 2014–2024 (Kilo Tons)
7.6.6 GCC Thermic fluids Market Revenue, by Product Segment, 2014–2024 (US$ Mn)
7.6.7 GCC Thermic fluids Market Volume, by End-user, 2014–2024 (Kilo Tons)
7.6.8 GCC Thermic fluids Market Revenue, by End-user, 2014–2024 (US$ Mn)
7.6.9 South Africa Thermic fluids Market Volume, by Product Segment, 2014–2024 (Kilo Tons)
7.6.10 South Africa Thermic fluids Market Revenue, by Product Segment, 2014–2024 (US$ Mn)
7.6.11 South Africa Thermic fluids Market Volume, by End-user, 2014–2024 (Kilo Tons)
7.6.12 South Africa Thermic fluids Market Revenue, by End-user, 2014–2024 (US$ Mn)
7.6.13 Rest of Middle East & Africa Thermic fluids Market Volume, by Product Segment, 2014–2024 (Kilo Tons)
7.6.14 Rest of Middle East & Africa Thermic fluids Market Revenue, by Product Segment, 2014–2024 (US$ Mn)
7.6.15 Rest of Middle East & Africa Thermic fluids Market Volume, by End-user, 2014–2024 (Kilo Tons)
7.6.16 Rest of Middle East & Africa Thermic fluids Market Revenue, by End-user, 2014–2024 (US$ Mn)
Chapter 8 Company Profiles
8.1 Dow Chemical Company
8.2 Exxon Mobil
8.3 Eastman Chemical Company
8.4 British Petroleum
8.5 Shell
8.6 BASF SE
8.7 Dynalene Inc.
8.8 Paratherm Corporation
8.9 Multitherm LLC.
8.10 Kost U.S.A Inc.
Chapter 9 Primary Research - Key Findings
Chapter 10 List of Key Customers
Copyright © Transparency Market Research, Inc. All Rights reserved
Trust Online

Thermic Fluids Market