
Reports
Reports
Analysts’ Viewpoint on Smart Card Market Scenario
Smart cards are widely used in healthcare, transportation, BFSI, and other verticals, as they provide confidentiality and privacy to users. The global market value of the smart card is anticipated to grow rapidly during the forecast period owing to the surge in demand for contactless smart card (tap to pay) payments. Rise in penetration of smart cards for access control and personal identification is significantly impacting the market. Technological advancements and digitalization in various sectors are also contributing to market growth. Expansion in retail and e-commerce industries is expected to boost the demand for smart cards, thereby providing numerous opportunities for players in the global smart card market. Market players are launching high-performance biometric smart card platforms to increase card performance and reduce manufacturing complexities.
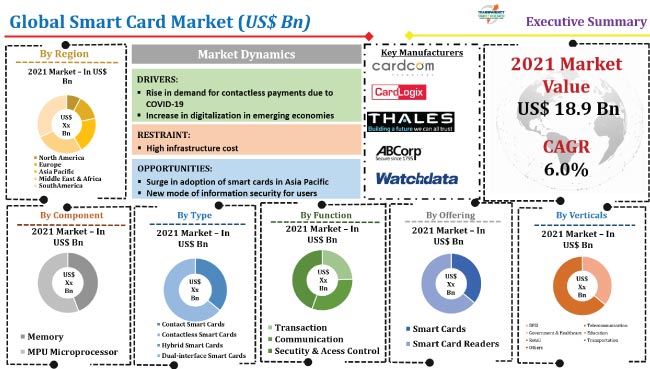
Smart card or eSmart card is a physical card that contains a microcontroller. The embedded memory in the card provides secure encryption. Smart cards are usually tamper-proof and are activated in wireless network areas. They are embedded with smart features that are crucial for high-security transactions. Smart cards communicate with a reader through short-range wireless networks or direct physical contacts such as near-field communication (NFC) or radio-frequency identification (RFID). Smart cards can store passwords, private keys, personal information, and account numbers. Various types of smart cards include contact smart cards, contactless smart cards, hybrid smart cards, memory smart cards, microprocessor smart cards, and dual-interface smart cards.
The penetration of smart cards is high in developed and emerging economies. Most stores and businesses accept contactless payments. Many stores restricted physical payments during the peak of the COVID-19 pandemic. Adoption of smart cards is high due to ease of use and convenience. The COVID-19 period proved to be advantageous for the smart card market, with rise in demand for smart cards in healthcare and telecommunication markets. Contactless payment is widely preferred due to hygiene concerns and as a precautionary measure to prevent the spread of the virus.
According to the recent demand analysis of smart cards, increase in adoption of digital payment technologies that focus on improved convenience and security compared to traditional cash-based payments is expected to drive the market during the forecast period. Users pay through smart cards online instead of cash on delivery for convenience purposes. Smart cards ensure privacy and easy management of payment records as smart card-based transactions are highly secure.
Rapid urbanization and rise in industrialization in developing countries such as India, China, Mexico, South Africa, and Brazil are providing lucrative opportunities for players in the global smart card market. Expansion in the prepaid credit card market and contactless smart card market; and rise in adoption of universal smart cards to process banking transactions are also driving the smart card market.
In terms of type, the global smart card market has been segmented into contact smart cards, contactless smart cards, hybrid smart cards, and dual-interface smart cards. The contactless smart cards segment is expected to hold major share of the market during the forecast period. Majority of consumers have shifted to digitalization and automation technologies. This shift has overhauled the functional dynamics of various sectors and industries. Advancements in Internet of Things (IoT) market and automation technology are expected to propel the demand for contactless smart cards. Embedded smart card, secure microcontroller or equivalent intelligence, internal memory, and a small antenna are components of a contactless smart card. COVID-19 has positively impacted the contactless smart cards segment, as companies and government organizations across the globe are increasingly adopting contactless smart cards to ensure social distancing and other COVID related precautions.
Based on verticals, the global smart card market has been classified into BFSI, telecommunication, government & healthcare, education, retail, transportation, and others. The BFSI segment is expected to hold major share of the market during the forecast period. Adoption of smart cards in the BFSI sector has increased significantly, as smart cards are more beneficial than traditional payment methods. Smart cards keep personal data confidential and enable secure transactions. They are utilized as credit cards, debit cards, access control cards, and authentication cards. Smart cards are also used as electronic wallets. They are loaded with funds that can be transferred to a vending machine or an account using cryptographic protocols. Thus, adoption of smart cards has increased in the BFSI sector due to their secure and confidential features.
Asia Pacific is projected to be the fastest-growing market for smart cards during the forecast period, due to rapid urbanization and industrialization in countries such as China, India, and Japan. Rapid growth of the e-commerce market is also fueling the demand for smart cards in the region.
North America and Europe are expected to account for significant share of the global smart card market. The market in South America is also anticipated to grow at a high pace, due to the rise in consumer spending through digital media in the region. The smart card market in Middle East & Africa is estimated to witness substantial progress in the next few years. Rise in adoption of advanced technologies is projected to drive the demand for smart cards in the region.
Players operating in the global smart card market are focusing on investments in research & development activities. Investment in R&D is likely to boost the launch of innovative products, which can better penetrate the existing and untapped markets. In July 2021, Infineon Technologies AG, in collaboration with IDEX Biometrics ASA, announced a reference design for an innovative fingerprint smart card architecture. The design utilizes the TrustedBio solution from IDEX Biometrics and the Infineon SLC38BML800 safety controller with GPIO interface. This allows fingerprint verification with high accuracy, low latency, and power efficiency.
Prominent players operating in the smart card market are Thales, CPI Card Group Inc., Giesecke+Devrient GmbH, IDEMIA, NXP Semiconductors Austria GmbH Styria, CardLogix Corporation, Watchdata Co., Ltd., Eastcompeace Technology Co., Ltd., HID Global Corporation, ABCorp, CardCom, Ingenico., Kona, Identiv, Inc., Valid, VeriFone, Inc., BrilliantTS, Perfect Plastic Printing, Bartronics India Limited, and Infineon Technologies AG.
Each of these players has been profiled in the smart card market report based on parameters such as company overview, financial overview, business strategies, product portfolio, business segments, and recent developments.
|
Attribute |
Detail |
|
Market Value in 2021 |
US$ 18.9 Bn |
|
Market Forecast Value in 2031 |
US$ 33.5 Bn |
|
Growth Rate (CAGR) |
6.0% |
|
Forecast Period |
2022–2031 |
|
Historical Data Available for |
2017–2020 |
|
Quantitative Units |
US$ Bn for Value and Million Units for Volume |
|
Market Analysis |
It includes cross-segment analysis at the global as well as regional levels. Furthermore, the qualitative analysis includes drivers, restraints, opportunities, key trends, Porter’s Five Forces analysis, value chain analysis, and key trend analysis. |
|
Competition Landscape |
|
|
Format |
Electronic (PDF) + Excel |
|
Market Segmentation |
|
|
Regions Covered |
|
|
Countries Covered |
|
|
Companies Profiled |
|
|
Customization Scope |
Available upon request |
|
Pricing |
Available upon request |
The smart card market stood at US$ 18.9 Bn in 2021
The smart card market is estimated to grow at a CAGR of 6.0% during 2022-2031.
Rise in demand for contactless payments due to COVID-19 and increase in penetration of smart cards for access control.
The BFSI segment accounted for maximum share of the market in 2021.
Asia Pacific is likely to be one of the lucrative regions of the market during the forecast period.
Thales, CPI Card Group Inc., Giesecke+Devrient GmbH, IDEMIA, NXP Semiconductors Austria GmbH Styria, CardLogix Corporation, Watchdata Co., Ltd., Eastcompeace Technology Co., Ltd., HID Global Corporation, ABCorp, CardCom, Ingenico., Kona, Identiv, Inc., Valid, VeriFone, Inc., BrilliantTS, Perfect Plastic Printing, Bartronics India Limited, and Infineon Technologies AG.
1. Preface
1.1. Market Definition and Scope
1.2. Market Segmentation
1.3. Key Research Objectives
1.4. Research Highlights
2. Assumptions
3. Research Methodology
4. Executive Summary
5. Market Overview
5.1. Market Dynamics
5.1.1. Drivers
5.1.2. Restraints
5.1.3. Opportunities
5.2. Key Trends Analysis
5.2.1. Demand Side Analysis
5.2.2. Supply Side Analysis
5.3. Key Market Indicators
5.3.1. Parent Market Overview
5.4. Porter’s Five Forces Analysis
5.5. Value Chain Analysis
5.6. Industry SWOT Analysis
5.7. COVID-19 Impact Analysis
5.8. Technological Roadmap
5.9. Global Smart Card Market Analysis and Forecast, 2017 - 2031
5.9.1. Market Value Projections (US$ Mn)
5.9.2. Market Volume Projections (Million Units)
6. Global Smart Card Market Analysis and Forecast, By Component
6.1. Global Smart Card Market Size (US$ Mn and Million Units), By Component, 2017 - 2031
6.1.1. Memory
6.1.2. MPU Microprocessor
6.2. Incremental Opportunity, By Component
7. Global Smart Card Market Analysis and Forecast, By Type
7.1. Global Smart Card Market Size (US$ Mn and Million Units), By Type, 2017 - 2031
7.1.1. Contact Smart Cards
7.1.2. Contactless Smart Cards
7.1.3. Hybrid Smart Cards
7.1.4. Dual-interface Smart Cards
7.2. Incremental Opportunity, By Type
8. Global Smart Card Market Analysis and Forecast, By Function
8.1. Global Smart Card Market Size (US$ Mn and Million Units), By Function, 2017 - 2031
8.1.1. Transaction
8.1.2. Communication
8.1.3. Security & Access Control
8.2. Incremental Opportunity, By Function
9. Global Smart Card Market Analysis and Forecast, By Offering
9.1. Global Smart Card Market Size (US$ Mn and Million Units), By Offering, 2017 - 2031
9.1.1. Smart Cards
9.1.2. Smart Card Readers
9.2. Incremental Opportunity, By Offering
10. Global Smart Card Market Analysis and Forecast, By Verticals
10.1. Global Smart Card Market Size (US$ Mn and Million Units), By Verticals, 2017 - 2031
10.1.1. BFSI
10.1.2. Telecommunication
10.1.3. Government & Healthcare
10.1.4. Education
10.1.5. Retail
10.1.6. Transportation
10.1.7. Others
10.2. Incremental Opportunity, By Verticals
11. Global Smart Card Market Analysis and Forecast, Region
11.1. Global Smart Card Market Size (US$ Mn and Million Units), By Region, 2017 - 2031
11.1.1. North America
11.1.2. Europe
11.1.3. Asia Pacific
11.1.4. Middle East & Africa
11.1.5. South America
11.2. Incremental Opportunity, By Region
12. North America Smart Card Market Analysis and Forecast
12.1. Regional Snapshot
12.2. Price Trend Analysis
12.2.1. Weighted Average Selling Price (US$)
12.3. Key Trends Analysis
12.3.1. Demand Side Analysis
12.3.2. Supply Side Analysis
12.4. COVID-19 Impact Analysis
12.5. Smart Card Market Size (US$ Mn and Million Units), By Component, 2017 - 2031
12.5.1. Memory
12.5.2. MPU Microprocessor
12.6. Smart Card Market Size (US$ Mn and Million Units), By Type, 2017 - 2031
12.6.1. Contact Smart Cards
12.6.2. Contactless Smart Cards
12.6.3. Hybrid Smart Cards
12.6.4. Dual-interface Smart Cards
12.7. Smart Card Market Size (US$ Mn and Million Units), By Function, 2017 - 2031
12.7.1. Transaction
12.7.2. Communication
12.7.3. Security & Access Control
12.8. Smart Card Market Size (US$ Mn and Million Units), By Offering, 2017 - 2031
12.8.1. Smart Cards
12.8.2. Smart Card Readers
12.9. Smart Card Market Size (US$ Mn and Million Units), By Verticals, 2017 - 2031
12.9.1. BFSI
12.9.2. Telecommunication
12.9.3. Government & Healthcare
12.9.4. Education
12.9.5. Retail
12.9.6. Transportation
12.9.7. Others
12.10. Smart Card Market Size (US$ Mn and Million Units), By Country/Sub-region, 2017 - 2031
12.10.1. U.S.
12.10.2. Canada
12.10.3. Rest of North America
12.11. Incremental Opportunity Analysis
13. Europe Smart Card Market Analysis and Forecast
13.1. Regional Snapshot
13.2. Price Trend Analysis
13.2.1. Weighted Average Selling Price (US$)
13.3. Key Trends Analysis
13.3.1. Demand Side Analysis
13.3.2. Supply Side Analysis
13.4. COVID-19 Impact Analysis
13.5. Smart Card Market Size (US$ Mn and Million Units), By Component, 2017 - 2031
13.5.1. Memory
13.5.2. MPU Microprocessor
13.6. Smart Card Market Size (US$ Mn and Million Units), By Type, 2017 - 2031
13.6.1. Contact Smart Cards
13.6.2. Contactless Smart Cards
13.6.3. Hybrid Smart Cards
13.6.4. Dual-interface Smart Cards
13.7. Smart Card Market Size (US$ Mn and Million Units), By Function, 2017 - 2031
13.7.1. Transaction
13.7.2. Communication
13.7.3. Security & Access Control
13.8. Smart Card Market Size (US$ Mn and Million Units), By Offering, 2017 - 2031
13.8.1. Smart Cards
13.8.2. Smart Card Readers
13.9. Smart Card Market Size (US$ Mn and Million Units), By Verticals, 2017 - 2031
13.9.1. BFSI
13.9.2. Telecommunication
13.9.3. Government & Healthcare
13.9.4. Education
13.9.5. Retail
13.9.6. Transportation
13.9.7. Others
13.10. Smart Card Market Size (US$ Mn and Million Units), By Country/Sub-region, 2017 - 2031
13.10.1. U.K.
13.10.2. Germany
13.10.3. France
13.10.4. Rest of Europe
13.11. Incremental Opportunity Analysis
14. Asia Pacific Smart Card Market Analysis and Forecast
14.1. Regional Snapshot
14.2. Price Trend Analysis
14.2.1. Weighted Average Selling Price (US$)
14.3. Key Trends Analysis
14.3.1. Demand Side Analysis
14.3.2. Supply Side Analysis
14.4. COVID-19 Impact Analysis
14.5. Smart Card Market Size (US$ Mn and Million Units), By Component, 2017 - 2031
14.5.1. Memory
14.5.2. MPU Microprocessor
14.6. Smart Card Market Size (US$ Mn and Million Units), By Type, 2017 - 2031
14.6.1. Contact Smart Cards
14.6.2. Contactless Smart Cards
14.6.3. Hybrid Smart Cards
14.6.4. Dual-interface Smart Cards
14.7. Smart Card Market Size (US$ Mn and Million Units), By Function, 2017 - 2031
14.7.1. Transaction
14.7.2. Communication
14.7.3. Security & Access Control
14.8. Smart Card Market Size (US$ Mn and Million Units), By Offering, 2017 - 2031
14.8.1. Smart Cards
14.8.2. Smart Card Readers
14.9. Smart Card Market Size (US$ Mn and Million Units), By Verticals, 2017 - 2031
14.9.1. BFSI
14.9.2. Telecommunication
14.9.3. Government & Healthcare
14.9.4. Education
14.9.5. Retail
14.9.6. Transportation
14.9.7. Others
14.10. Smart Card Market Size (US$ Mn and Million Units), By Country/Sub-region, 2017 - 2031
14.10.1. China
14.10.2. India
14.10.3. Japan
14.10.4. Rest of Asia Pacific
14.11. Incremental Opportunity Analysis
15. Middle East & Africa Smart Card Market Analysis and Forecast
15.1. Regional Snapshot
15.2. Price Trend Analysis
15.2.1. Weighted Average Selling Price (US$)
15.3. Key Trends Analysis
15.3.1. Demand Side Analysis
15.3.2. Supply Side Analysis
15.4. COVID-19 Impact Analysis
15.5. Smart Card Market Size (US$ Mn and Million Units), By Component, 2017 - 2031
15.5.1. Memory
15.5.2. MPU Microprocessor
15.6. Smart Card Market Size (US$ Mn and Million Units), By Type, 2017 - 2031
15.6.1. Contact Smart Cards
15.6.2. Contactless Smart Cards
15.6.3. Hybrid Smart Cards
15.6.4. Dual-interface Smart Cards
15.7. Smart Card Market Size (US$ Mn and Million Units), By Function, 2017 - 2031
15.7.1. Transaction
15.7.2. Communication
15.7.3. Security & Access Control
15.8. Smart Card Market Size (US$ Mn and Million Units), By Offering, 2017 - 2031
15.8.1. Smart Cards
15.8.2. Smart Card Readers
15.9. Smart Card Market Size (US$ Mn and Million Units), By Verticals, 2017 - 2031
15.9.1. BFSI
15.9.2. Telecommunication
15.9.3. Government & Healthcare
15.9.4. Education
15.9.5. Retail
15.9.6. Transportation
15.9.7. Others
15.10. Smart Card Market Size (US$ Mn and Million Units), By Country/Sub-region, 2017 - 2031
15.10.1. GCC
15.10.2. South Africa
15.10.3. Rest of Middle East & Africa
15.11. Incremental Opportunity Analysis
16. South America Smart Card Market Analysis and Forecast
16.1. Regional Snapshot
16.2. Price Trend Analysis
16.2.1. Weighted Average Selling Type (US$)
16.3. Key Trends Analysis
16.3.1. Demand Side Analysis
16.3.2. Supply Side Analysis
16.4. COVID-19 Impact Analysis
16.5. Smart Card Market Size (US$ Mn and Million Units), By Component, 2017 - 2031
16.5.1. Memory
16.5.2. MPU Microprocessor
16.6. Smart Card Market Size (US$ Mn and Million Units), By Type, 2017 - 2031
16.6.1. Contact Smart Cards
16.6.2. Contactless Smart Cards
16.6.3. Hybrid Smart Cards
16.6.4. Dual-interface Smart Cards
16.7. Smart Card Market Size (US$ Mn and Million Units), By Function, 2017 - 2031
16.7.1. Transaction
16.7.2. Communication
16.7.3. Security & Access Control
16.8. Smart Card Market Size (US$ Mn and Million Units), By Offering, 2017 - 2031
16.8.1. Smart Cards
16.8.2. Smart Card Readers
16.9. Smart Card Market Size (US$ Mn and Million Units), By Verticals, 2017 - 2031
16.9.1. BFSI
16.9.2. Telecommunication
16.9.3. Government & Healthcare
16.9.4. Education
16.9.5. Retail
16.9.6. Transportation
16.9.7. Others
16.10. Smart Card Market Size (US$ Mn and Million Units), By Country/Sub-region, 2017 - 2031
16.10.1. Brazil
16.10.2. Rest of South America
16.11. Incremental Opportunity Analysis
17. Competition Landscape
17.1. Market Player – Competition Dashboard
17.2. Market Share Analysis (%), 2021
17.3. Company Profiles (Details – Company Overview, Sales Area/Geographical Presence, Financial/Revenue, Strategy & Business Overview, Sales Channel Analysis, Size Portfolio)
17.3.1. Thales (Netherlands)
17.3.1.1. Company Overview
17.3.1.2. Sales Area/Geographical Presence
17.3.1.3. Financial/Revenue
17.3.1.4. Strategy & Business Overview
17.3.1.5. Sales Channel Analysis
17.3.1.6. Size Portfolio
17.3.2. CPI Card Group Inc. (US)
17.3.2.1. Company Overview
17.3.2.2. Sales Area/Geographical Presence
17.3.2.3. Financial/Revenue
17.3.2.4. Strategy & Business Overview
17.3.2.5. Sales Channel Analysis
17.3.2.6. Size Portfolio
17.3.3. Giesecke+Devrient GmbH (Germany)
17.3.3.1. Company Overview
17.3.3.2. Sales Area/Geographical Presence
17.3.3.3. Financial/Revenue
17.3.3.4. Strategy & Business Overview
17.3.3.5. Sales Channel Analysis
17.3.3.6. Size Portfolio
17.3.4. IDEMIA (France)
17.3.4.1. Company Overview
17.3.4.2. Sales Area/Geographical Presence
17.3.4.3. Financial/Revenue
17.3.4.4. Strategy & Business Overview
17.3.4.5. Sales Channel Analysis
17.3.4.6. Size Portfolio
17.3.5. NXP Semiconductors Austria GmbH Styria (Venezuela)
17.3.5.1. Company Overview
17.3.5.2. Sales Area/Geographical Presence
17.3.5.3. Financial/Revenue
17.3.5.4. Strategy & Business Overview
17.3.5.5. Sales Channel Analysis
17.3.5.6. Size Portfolio
17.3.6. CardLogix Corporation (US)
17.3.6.1. Company Overview
17.3.6.2. Sales Area/Geographical Presence
17.3.6.3. Financial/Revenue
17.3.6.4. Strategy & Business Overview
17.3.6.5. Sales Channel Analysis
17.3.6.6. Size Portfolio
17.3.7. Watchdata Co., Ltd. (Singapore)
17.3.7.1. Company Overview
17.3.7.2. Sales Area/Geographical Presence
17.3.7.3. Financial/Revenue
17.3.7.4. Strategy & Business Overview
17.3.7.5. Sales Channel Analysis
17.3.7.6. Size Portfolio
17.3.8. Eastcompeace Technology Co., Ltd. (China)
17.3.8.1. Company Overview
17.3.8.2. Sales Area/Geographical Presence
17.3.8.3. Financial/Revenue
17.3.8.4. Strategy & Business Overview
17.3.8.5. Sales Channel Analysis
17.3.8.6. Size Portfolio
17.3.9. HID Global Corporation (US)
17.3.9.1. Company Overview
17.3.9.2. Sales Area/Geographical Presence
17.3.9.3. Financial/Revenue
17.3.9.4. Strategy & Business Overview
17.3.9.5. Sales Channel Analysis
17.3.9.6. Size Portfolio
17.3.10. ABCorp (US)
17.3.10.1. Company Overview
17.3.10.2. Sales Area/Geographical Presence
17.3.10.3. Financial/Revenue
17.3.10.4. Strategy & Business Overview
17.3.10.5. Sales Channel Analysis
17.3.10.6. Size Portfolio
17.3.11. CardCom (US)
17.3.11.1. Company Overview
17.3.11.2. Sales Area/Geographical Presence
17.3.11.3. Financial/Revenue
17.3.11.4. Strategy & Business Overview
17.3.11.5. Sales Channel Analysis
17.3.11.6. Size Portfolio
17.3.12. Ingenico. (France)
17.3.12.1. Company Overview
17.3.12.2. Sales Area/Geographical Presence
17.3.12.3. Financial/Revenue
17.3.12.4. Strategy & Business Overview
17.3.12.5. Sales Channel Analysis
17.3.12.6. Size Portfolio
17.3.13. Kona (South Korea)
17.3.13.1. Company Overview
17.3.13.2. Sales Area/Geographical Presence
17.3.13.3. Financial/Revenue
17.3.13.4. Strategy & Business Overview
17.3.13.5. Sales Channel Analysis
17.3.13.6. Size Portfolio
17.3.14. Identiv, Inc. (US)
17.3.14.1. Company Overview
17.3.14.2. Sales Area/Geographical Presence
17.3.14.3. Financial/Revenue
17.3.14.4. Strategy & Business Overview
17.3.14.5. Sales Channel Analysis
17.3.14.6. Size Portfolio
17.3.15. Valid (Brazil)
17.3.15.1. Company Overview
17.3.15.2. Sales Area/Geographical Presence
17.3.15.3. Financial/Revenue
17.3.15.4. Strategy & Business Overview
17.3.15.5. Sales Channel Analysis
17.3.15.6. Size Portfolio
17.3.16. VeriFone, Inc. (US)
17.3.16.1. Company Overview
17.3.16.2. Sales Area/Geographical Presence
17.3.16.3. Financial/Revenue
17.3.16.4. Strategy & Business Overview
17.3.16.5. Sales Channel Analysis
17.3.16.6. Size Portfolio
17.3.17. BrilliantTS (South Korea)
17.3.17.1. Company Overview
17.3.17.2. Sales Area/Geographical Presence
17.3.17.3. Financial/Revenue
17.3.17.4. Strategy & Business Overview
17.3.17.5. Sales Channel Analysis
17.3.17.6. Size Portfolio
17.3.18. Perfect Plastic Printing (US)
17.3.18.1. Company Overview
17.3.18.2. Sales Area/Geographical Presence
17.3.18.3. Financial/Revenue
17.3.18.4. Strategy & Business Overview
17.3.18.5. Sales Channel Analysis
17.3.18.6. Size Portfolio
17.3.19. Bartronics India Limited (India)
17.3.19.1. Company Overview
17.3.19.2. Sales Area/Geographical Presence
17.3.19.3. Financial/Revenue
17.3.19.4. Strategy & Business Overview
17.3.19.5. Sales Channel Analysis
17.3.19.6. Size Portfolio
17.3.20. Infineon Technologies AG (Germany)
17.3.20.1. Company Overview
17.3.20.2. Sales Area/Geographical Presence
17.3.20.3. Financial/Revenue
17.3.20.4. Strategy & Business Overview
17.3.20.5. Sales Channel Analysis
17.3.20.6. Size Portfolio
18. Key Takeaway
18.1. Identification of Potential Market Spaces
18.1.1. Component
18.1.2. Type
18.1.3. Function
18.1.4. Offering
18.1.5. Verticals
18.1.6. Geography
18.2. Understanding the Buying Process of Customers
18.3. Preferred Sales & Marketing Strategy
List of Tables
Table 1: Global Smart Card Market, by Component, Million Units, 2017-2031
Table 2: Global Smart Card Market, by Component, US$ Mn, 2017-2031
Table 3: Global Smart Card Market, by Type, Million Units, 2017-2031
Table 4: Global Smart Card Market, by Type, US$ Mn, 2017-2031
Table 5: Global Smart Card Market, by Function, Million Units, 2017-2031
Table 6: Global Smart Card Market, by Function, US$ Mn, 2017-2031
Table 7: Global Smart Card Market, by Offering, Million Units, 2017-2031
Table 8: Global Smart Card Market, by Offering, US$ Mn, 2017-2031
Table 9: Global Smart Card Market, by Verticals, Million Units, 2017-2031
Table 10: Global Smart Card Market, by Verticals, US$ Mn, 2017-2031
Table 11: Global Smart Card Market, by Region, Million Units, 2017-2031
Table 12: Global Smart Card Market, by Region, US$ Mn, 2017-2031
Table 13: North America Smart Card Market, by Component, Million Units, 2017-2031
Table 14: North America Smart Card Market, by Component, US$ Mn, 2017-2031
Table 15: North America Smart Card Market, by Type, Million Units, 2017-2031
Table 16: North America Smart Card Market, by Type, US$ Mn, 2017-2031
Table 17: North America Smart Card Market, by Function, Million Units, 2017-2031
Table 18: North America Smart Card Market, by Function, US$ Mn, 2017-2031
Table 19: North America Smart Card Market, by Offering, Million Units, 2017-2031
Table 20: North America Smart Card Market, by Offering, US$ Mn, 2017-2031
Table 21: North America Smart Card Market, by Verticals, Million Units, 2017-2031
Table 22: North America Smart Card Market, by Verticals, US$ Mn, 2017-2031
Table 23: North America Smart Card Market, by Country, Million Units, 2017-2031
Table 24: North America Smart Card Market, by Country, US$ Mn, 2017-2031
Table 25: Europe Smart Card Market, by Component, Million Units, 2017-2031
Table 26: Europe Smart Card Market, by Component, US$ Mn, 2017-2031
Table 27: Europe Smart Card Market, by Type, Million Units, 2017-2031
Table 28: Europe Smart Card Market, by Type, US$ Mn, 2017-2031
Table 29: Europe Smart Card Market, by Function, Million Units, 2017-2031
Table 30: Europe Smart Card Market, by Function, US$ Mn, 2017-2031
Table 31: Europe Smart Card Market, by Offering, Million Units, 2017-2031
Table 32: Europe Smart Card Market, by Offering, US$ Mn, 2017-2031
Table 33: Europe Smart Card Market, by Verticals, Million Units, 2017-2031
Table 34: Europe Smart Card Market, by Verticals, US$ Mn, 2017-2031
Table 35: Europe Smart Card Market, by Country, Million Units, 2017-2031
Table 36: Europe Smart Card Market, by Country, US$ Mn, 2017-2031
Table 37: Asia Pacific Smart Card Market, by Component, Million Units, 2017-2031
Table 38: Asia Pacific Smart Card Market, by Component, US$ Mn, 2017-2031
Table 39: Asia Pacific Smart Card Market, by Type, Million Units, 2017-2031
Table 40: Asia Pacific Smart Card Market, by Type, US$ Mn, 2017-2031
Table 41: Asia Pacific Smart Card Market, by Function, Million Units, 2017-2031
Table 42: Asia Pacific Smart Card Market, by Function, US$ Mn, 2017-2031
Table 43: Asia Pacific Smart Card Market, by Offering, Million Units, 2017-2031
Table 44: Asia Pacific Smart Card Market, by Offering, US$ Mn, 2017-2031
Table 45: Asia Pacific Smart Card Market, by Verticals, Million Units, 2017-2031
Table 46: Asia Pacific Smart Card Market, by Verticals, US$ Mn, 2017-2031
Table 47: Asia Pacific Smart Card Market, by Country, Million Units, 2017-2031
Table 48: Asia Pacific Smart Card Market, by Country, US$ Mn, 2017-2031
Table 49: Middle East & Africa Smart Card Market, by Component, Million Units, 2017-2031
Table 50: Middle East & Africa Smart Card Market, by Component, US$ Mn, 2017-2031
Table 51: Middle East & Africa Smart Card Market, by Type, Million Units, 2017-2031
Table 52: Middle East & Africa Smart Card Market, by Type, US$ Mn, 2017-2031
Table 53: Middle East & Africa Smart Card Market, by Function, Million Units, 2017-2031
Table 54: Middle East & Africa Smart Card Market, by Function, US$ Mn, 2017-2031
Table 55: Middle East & Africa Smart Card Market, by Offering, Million Units, 2017-2031
Table 56: Middle East & Africa Smart Card Market, by Offering, US$ Mn, 2017-2031
Table 57: Middle East & Africa Smart Card Market, by Verticals, Million Units, 2017-2031
Table 58: Middle East & Africa Smart Card Market, by Verticals, US$ Mn, 2017-2031
Table 59: Middle East & Africa Smart Card Market, by Country, Million Units, 2017-2031
Table 60: Middle East & Africa Smart Card Market, by Country, US$ Mn, 2017-2031
Table 61: South America Smart Card Market, by Component, Million Units, 2017-2031
Table 62: South America Smart Card Market, by Component, US$ Mn, 2017-2031
Table 63: South America Smart Card Market, by Type, Million Units, 2017-2031
Table 64: South America Smart Card Market, by Type, US$ Mn, 2017-2031
Table 65: South America Smart Card Market, by Function, Million Units, 2017-2031
Table 66: South America Smart Card Market, by Function, US$ Mn, 2017-2031
Table 67: South America Smart Card Market, by Offering, Million Units, 2017-2031
Table 68: South America Smart Card Market, by Offering, US$ Mn, 2017-2031
Table 69: South America Smart Card Market, by Verticals, Million Units, 2017-2031
Table 70: South America Smart Card Market, by Verticals, US$ Mn, 2017-2031
Table 71: South America Smart Card Market, by Country, Million Units, 2017-2031
Table 72: South America Smart Card Market, by Country, US$ Mn, 2017-2031
List of Figures
Figure 1: Global Smart Card Market, by Component, Million Units, 2017-2031
Figure 2: Global Smart Card Market, by Component, US$ Mn, 2017-2031
Figure 3: Global Smart Card Market Incremental Opportunity, by Component, US$ Mn, 2017-2031
Figure 4: Global Smart Card Market, by Type, Million Units, 2017-2031
Figure 5: Global Smart Card Market, by Type, US$ Mn, 2017-2031
Figure 6: Global Smart Card Market Incremental Opportunity, by Type, US$ Mn, 2017-2031
Figure 7: Global Smart Card Market, by Function, Million Units, 2017-2031
Figure 8: Global Smart Card Market, by Function, US$ Mn, 2017-2031
Figure 9: Global Smart Card Market Incremental Opportunity, by Function, US$ Mn, 2017-2031
Figure 10: Global Smart Card Market, by Offering, Million Units, 2017-2031
Figure 11: Global Smart Card Market, by Offering, US$ Mn, 2017-2031
Figure 12: Global Smart Card Market Incremental Opportunity, by Offering, US$ Mn, 2017-2031
Figure 13: Global Smart Card Market, by Verticals, Million Units, 2017-2031
Figure 14: Global Smart Card Market, by Verticals, US$ Mn, 2017-2031
Figure 15: Global Smart Card Market Incremental Opportunity, by Verticals, US$ Mn, 2017-2031
Figure 16: Global Smart Card Market, by Region, Million Units, 2017-2031
Figure 17: Global Smart Card Market, by Region, US$ Mn, 2017-2031
Figure 18: Global Smart Card Market Incremental Opportunity, by Region, US$ Mn, 2017-2031
Figure 19: North America Smart Card Market, by Component, Million Units, 2017-2031
Figure 20: North America Smart Card Market, by Component, US$ Mn, 2017-2031
Figure 21: North America Smart Card Market Incremental Opportunity, by Component, US$ Mn, 2017-2031
Figure 22: North America Smart Card Market, by Type, Million Units, 2017-2031
Figure 23: North America Smart Card Market, by Type, US$ Mn, 2017-2031
Figure 24: North America Smart Card Market Incremental Opportunity, by Type, US$ Mn, 2017-2031
Figure 25: North America Smart Card Market, by Function, Million Units, 2017-2031
Figure 26: North America Smart Card Market, by Function, US$ Mn, 2017-2031
Figure 27: North America Smart Card Market Incremental Opportunity, by Function, US$ Mn, 2017-2031
Figure 28: North America Smart Card Market, by Offering, Million Units, 2017-2031
Figure 29: North America Smart Card Market, by Offering, US$ Mn, 2017-2031
Figure 30: North America Smart Card Market Incremental Opportunity, by Offering, US$ Mn, 2017-2031
Figure 31: North America Smart Card Market, by Verticals, Million Units, 2017-2031
Figure 32: North America Smart Card Market, by Verticals, US$ Mn, 2017-2031
Figure 33: North America Smart Card Market Incremental Opportunity, by Verticals, US$ Mn, 2017-2031
Figure 34: North America Smart Card Market, by Country, Million Units, 2017-2031
Figure 35: North America Smart Card Market, by Country, US$ Mn, 2017-2031
Figure 36: North America Smart Card Market Incremental Opportunity, by Country, US$ Mn, 2017-2031
Figure 37: Europe Smart Card Market, by Component, Million Units, 2017-2031
Figure 38: Europe Smart Card Market, by Component, US$ Mn, 2017-2031
Figure 39: Europe Smart Card Market Incremental Opportunity, by Component, US$ Mn, 2017-2031
Figure 40: Europe Smart Card Market, by Type, Million Units, 2017-2031
Figure 41: Europe Smart Card Market, by Type, US$ Mn, 2017-2031
Figure 42: Europe Smart Card Market Incremental Opportunity, by Type, US$ Mn, 2017-2031
Figure 43: Europe Smart Card Market, by Function, Million Units, 2017-2031
Figure 44: Europe Smart Card Market, by Function, US$ Mn, 2017-2031
Figure 45: Europe Smart Card Market Incremental Opportunity, by Function, US$ Mn, 2017-2031
Figure 46: Europe Smart Card Market, by Offering, Million Units, 2017-2031
Figure 47: Europe Smart Card Market, by Offering, US$ Mn, 2017-2031
Figure 48: Europe Smart Card Market Incremental Opportunity, by Offering, US$ Mn, 2017-2031
Figure 49: Europe Smart Card Market, by Verticals, Million Units, 2017-2031
Figure 50: Europe Smart Card Market, by Verticals, US$ Mn, 2017-2031
Figure 51: Europe Smart Card Market Incremental Opportunity, by Verticals, US$ Mn, 2017-2031
Figure 52: Europe Smart Card Market, by Country, Million Units, 2017-2031
Figure 53: Europe Smart Card Market, by Country, US$ Mn, 2017-2031
Figure 54: Europe Smart Card Market Incremental Opportunity, by Country, US$ Mn, 2017-2031
Figure 55: Asia Pacific Smart Card Market, by Component, Million Units, 2017-2031
Figure 56: Asia Pacific Smart Card Market, by Component, US$ Mn, 2017-2031
Figure 57: Asia Pacific Smart Card Market Incremental Opportunity, by Component, US$ Mn, 2017-2031
Figure 58: Asia Pacific Smart Card Market, by Type, Million Units, 2017-2031
Figure 59: Asia Pacific Smart Card Market, by Type, US$ Mn, 2017-2031
Figure 60: Asia Pacific Smart Card Market Incremental Opportunity, by Type, US$ Mn, 2017-2031
Figure 61: Asia Pacific Smart Card Market, by Function, Million Units, 2017-2031
Figure 62: Asia Pacific Smart Card Market, by Function, US$ Mn, 2017-2031
Figure 63: Asia Pacific Smart Card Market Incremental Opportunity, by Function, US$ Mn, 2017-2031
Figure 64: Asia Pacific Smart Card Market, by Offering, Million Units, 2017-2031
Figure 65: Asia Pacific Smart Card Market, by Offering, US$ Mn, 2017-2031
Figure 66: Asia Pacific Smart Card Market Incremental Opportunity, by Offering, US$ Mn, 2017-2031
Figure 67: Asia Pacific Smart Card Market, by Verticals, Million Units, 2017-2031
Figure 68: Asia Pacific Smart Card Market, by Verticals, US$ Mn, 2017-2031
Figure 69: Asia Pacific Smart Card Market Incremental Opportunity, by Verticals, US$ Mn, 2017-2031
Figure 70: Asia Pacific Smart Card Market, by Country, Million Units, 2017-2031
Figure 71: Asia Pacific Smart Card Market, by Country, US$ Mn, 2017-2031
Figure 72: Asia Pacific Smart Card Market Incremental Opportunity, by Country, US$ Mn, 2017-2031
Figure 73: Middle East & Africa Smart Card Market, by Component, Million Units, 2017-2031
Figure 74: Middle East & Africa Smart Card Market, by Component, US$ Mn, 2017-2031
Figure 75: Middle East & Africa Smart Card Market Incremental Opportunity, by Component, US$ Mn, 2017-2031
Figure 76: Middle East & Africa Smart Card Market, by Type, Million Units, 2017-2031
Figure 77: Middle East & Africa Smart Card Market, by Type, US$ Mn, 2017-2031
Figure 78: Middle East & Africa Smart Card Market Incremental Opportunity, by Type, US$ Mn, 2017-2031
Figure 79: Middle East & Africa Smart Card Market, by Function, Million Units, 2017-2031
Figure 80: Middle East & Africa Smart Card Market, by Function, US$ Mn, 2017-2031
Figure 81: Middle East & Africa Smart Card Market Incremental Opportunity, by Function, US$ Mn, 2017-2031
Figure 82: Middle East & Africa Smart Card Market, by Offering, Million Units, 2017-2031
Figure 83: Middle East & Africa Smart Card Market, by Offering, US$ Mn, 2017-2031
Figure 84: Middle East & Africa Smart Card Market Incremental Opportunity, by Offering, US$ Mn, 2017-2031
Figure 85: Middle East & Africa Smart Card Market, by Verticals, Million Units, 2017-2031
Figure 86: Middle East & Africa Smart Card Market, by Verticals, US$ Mn, 2017-2031
Figure 87: Middle East & Africa Smart Card Market Incremental Opportunity, by Verticals, US$ Mn, 2017-2031
Figure 88: Middle East & Africa Smart Card Market, by Country, Million Units, 2017-2031
Figure 89: Middle East & Africa Smart Card Market, by Country, US$ Mn, 2017-2031
Figure 90: Middle East & Africa Smart Card Market Incremental Opportunity, by Country, US$ Mn, 2017-2031
Figure 91: South America Smart Card Market, by Component, Million Units, 2017-2031
Figure 92: South America Smart Card Market, by Component, US$ Mn, 2017-2031
Figure 93: South America Smart Card Market Incremental Opportunity, by Component, US$ Mn, 2017-2031
Figure 94: South America Smart Card Market, by Type, Million Units, 2017-2031
Figure 95: South America Smart Card Market, by Type, US$ Mn, 2017-2031
Figure 96: South America Smart Card Market Incremental Opportunity, by Type, US$ Mn, 2017-2031
Figure 97: South America Smart Card Market, by Function, Million Units, 2017-2031
Figure 98: South America Smart Card Market, by Function, US$ Mn, 2017-2031
Figure 99: South America Smart Card Market Incremental Opportunity, by Function, US$ Mn, 2017-2031
Figure 100: South America Smart Card Market, by Offering, Million Units, 2017-2031
Figure 101: South America Smart Card Market, by Offering, US$ Mn, 2017-2031
Figure 102: South America Smart Card Market Incremental Opportunity, by Offering, US$ Mn, 2017-2031
Figure 103: South America Smart Card Market, by Verticals, Million Units, 2017-2031
Figure 104: South America Smart Card Market, by Verticals, US$ Mn, 2017-2031
Figure 105: South America Smart Card Market Incremental Opportunity, by Verticals, US$ Mn, 2017-2031
Figure 106: South America Smart Card Market, by Country, Million Units, 2017-2031
Figure 107: South America Smart Card Market, by Country, US$ Mn, 2017-2031
Figure 108: South America Smart Card Market Incremental Opportunity, by Country, US$ Mn, 2017-2031
Copyright © Transparency Market Research, Inc. All Rights reserved
Trust Online

Smart Card Market