
Reports
Reports
Global Proximity Mobile Payment Market: Snapshot
The proximity mobile payment market is very much a market of modernity, having come to the fore following widespread acceptance of mobile payment technology and digital economic architecture. Proximity mobile payment consists of payment carried out through mobile phones or other wireless devices. Barcodes and NFC are two of the leading contenders in the global proximity mobile payment market at present. Proximity mobile payment systems requires a large volume of supporting technological architecture, but their immense utility in making payment easier, more secure, and more convenient for customers is likely to drive demand from the global proximity mobile payment market in the coming years.
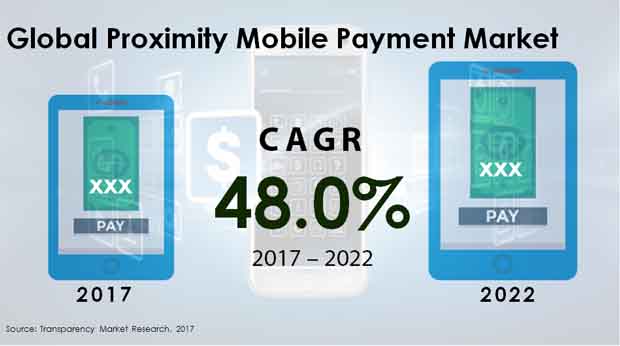
According to Transparency Market Research, the global proximity mobile payment market was valued at US$57.9 bn in 2017, but is likely to exhibit stunning progress in the coming years to end up at a valuation of US$411.4 bn by 2022. The proximity mobile payment market is expected to exhibit a robust 48% CAGR between 2017 and 2022.
Near Field Communication Likely to Dominate Proximity Mobile Payment Market
Of the two types of proximity mobile payment systems currently in major use, near field communication is likely to remain the dominant leader over the 2017-2022 forecast period. Barcodes are used extensively across the world, but the greater convenience of NFC tags have made them likely to be adopted on a wide scale in the retail sector. Near field communication accounted for more than 75% of the global proximity mobile payment market in 2017 and is likely to extend its dominance by increasing its market share to 87.7% by 2022. The segment was valued at US$43.6 bn in 2017 and is likely to exhibit a superb CAGR of 52.6% between 2017 and 2022 to emerge with a valuation of US$360.9 bn in 2022.
North America Likely to Remain leading Geographical Segment due to Widespread Acceptance
North America is the leading contributor to the global proximity mobile payment market and is likely to retain this position in the coming years thanks to the widespread adoption of proximity mobile payment systems in the developed region. The high adoption of smartphones and especially NFC-enabled smartphones in advanced countries such as the U.S. and Canada is likely to remain a key driver for the proximity mobile payment market in North America in the coming years. The North America proximity mobile payment market is likely to rise from US$13 bn to more than US$98 bn over the 2017-2022 forecast period, exhibiting a strong 49.8% CAGR therein.
The Europe proximity mobile payment market is likely to follow North America closely, with the region likely to account for a valuation of US$73.9 bn by the end of 2022. Like in North America, the proximity mobile payment market has also been helped in Europe by the steady technological development of the overall shopping experience and widespread support for technological advancements such as proximity mobile payment. The Europe proximity mobile payment market is expected to exhibit a robust 46.9% CAGR from 2017 to 2022.
The Middle East and Africa (MEA) market could also turn out to play a key role in the proximity mobile payment market in the near future due to the rapid economic development of several countries in the region and the steady acceptance of technological innovations in the economic chain.
Global Proximity Mobile Payment Market: Competitive Dynamics
Leading players in the global proximity mobile payment market include Samsung Electronics Co. Ltd., Visa Inc., Apple Inc., Alphabet Inc., Square Inc., ACI Worldwide Inc., PayPal Holdings Inc., Starbucks Corporation, Mastercard Incorporated, and CVS Health Group.
1. Global Proximity Mobile Payment Market - Executive Summary
?2. Global Proximity Mobile Payment Market Overview
2.1. Introduction
2.1.1. Global Proximity Mobile Payment Market Taxonomy
2.1.2. Global Proximity Mobile Payment Market Definition
2.2. Global Proximity Mobile Payment Market Size (US$ Mn) and Forecast, 2012-2022
2.2.1. Global Proximity Mobile Payment Market Y-o-Y Growth
2.3. Global Proximity Mobile Payment Market Dynamics
2.4. Cost Structure Analysis
2.5. Value Chain Assessment and Profitability Margins
2.6. Key Participants Market Presence (Intensity Map) By Region
3. Global Proximity Mobile Payment Market Analysis and Forecast By Mode of Payment
3.1. Global Proximity Mobile Payment Market Size and Forecast By Mode of Payment, 2012-2022
3.1.1. Near Field Communication Proximity Mobile Payment Market Size and Forecast, 2012-2022
3.1.1.1. Revenue (US$ Mn) Comparison, By Region
3.1.1.2. Market Share Comparison, By Region
3.1.1.3. Y-o-Y growth Comparison, By Region
3.1.2. Barcode Payments Proximity Mobile Payment Market Size and Forecast, 2012-2022
3.1.2.1. Revenue (US$ Mn) Comparison, By Region
3.1.2.2. Market Share Comparison, By Region
3.1.2.3. Y-o-Y growth Comparison, By Region
4. Global Proximity Mobile Payment Market Analysis and Forecast By End-use Industry
4.1. Global Proximity Mobile Payment Market Size and Forecast By End-use Industry, 2012-2022
4.1.1. Retail Proximity Mobile Payment Market Size and Forecast, 2012-2022
4.1.1.1. Revenue (US$ Mn) Comparison, By Region
4.1.1.2. Market Share Comparison, By Region
4.1.1.3. Y-o-Y growth Comparison, By Region
4.1.2. Hospitality & Tourism Proximity Mobile Payment Market Size and Forecast, 2012-2022
4.1.2.1. Revenue (US$ Mn) Comparison, By Region
4.1.2.2. Market Share Comparison, By Region
4.1.2.3. Y-o-Y growth Comparison, By Region
4.1.3. IT & Telecommunication Proximity Mobile Payment Market Size and Forecast, 2012-2022
4.1.3.1. Revenue (US$ Mn) Comparison, By Region
4.1.3.2. Market Share Comparison, By Region
4.1.3.3. Y-o-Y growth Comparison, By Region
4.1.4. BFSI Proximity Mobile Payment Market Size and Forecast, 2012-2022
4.1.4.1. Revenue (US$ Mn) Comparison, By Region
4.1.4.2. Market Share Comparison, By Region
4.1.4.3. Y-o-Y growth Comparison, By Region
4.1.5. Media & Entertainment Proximity Mobile Payment Market Size and Forecast, 2012-2022
4.1.5.1. Revenue (US$ Mn) Comparison, By Region
4.1.5.2. Market Share Comparison, By Region
4.1.5.3. Y-o-Y growth Comparison, By Region
4.1.6. Healthcare Proximity Mobile Payment Market Size and Forecast, 2012-2022
4.1.6.1. Revenue (US$ Mn) Comparison, By Region
4.1.6.2. Market Share Comparison, By Region
4.1.6.3. Y-o-Y growth Comparison, By Region
4.1.7. Airline Proximity Mobile Payment Market Size and Forecast, 2012-2022
4.1.7.1. Revenue (US$ Mn) Comparison, By Region
4.1.7.2. Market Share Comparison, By Region
4.1.7.3. Y-o-Y growth Comparison, By Region
4.1.8. Others Proximity Mobile Payment Market Size and Forecast, 2012-2022
4.1.8.1. Revenue (US$ Mn) Comparison, By Region
4.1.8.2. Market Share Comparison, By Region
4.1.8.3. Y-o-Y growth Comparison, By Region
5. Global Proximity Mobile Payment Market Analysis and Forecast By Region
5.1. Global Proximity Mobile Payment Market Size and Forecast, 2012-2022
5.1.1. North America Proximity Mobile Payment Market Size and Forecast, 2012-2022
5.1.1.1. Revenue (US$ Mn) Comparison, By Mode of Payment
5.1.1.2. Revenue (US$ Mn) Comparison, By End-use Industry
5.1.2. Latin America Proximity Mobile Payment Market Size and Forecast, 2012-2022
5.1.2.1. Revenue (US$ Mn) Comparison, By Mode of Payment
5.1.2.2. Revenue (US$ Mn) Comparison, By End-use Industry
5.1.3. Europe Proximity Mobile Payment Market Size and Forecast, 2012-2022
5.1.3.1. Revenue (US$ Mn) Comparison, By Mode of Payment
5.1.3.2. Revenue (US$ Mn) Comparison, By End-use Industry
5.1.4. Japan Proximity Mobile Payment Market Size and Forecast, 2012-2022
5.1.4.1. Revenue (US$ Mn) Comparison, By Mode of Payment
5.1.4.2. Revenue (US$ Mn) Comparison, By End-use Industry
5.1.5. APEJ Proximity Mobile Payment Market Size and Forecast, 2012-2022
5.1.5.1. Revenue (US$ Mn) Comparison, By Mode of Payment
5.1.5.2. Revenue (US$ Mn) Comparison, By End-use Industry
5.1.6. MEA Proximity Mobile Payment Market Size and Forecast, 2012-2022
5.1.6.1. Revenue (US$ Mn) Comparison, By Mode of Payment
5.1.6.2. Revenue (US$ Mn) Comparison, By End-use Industry
6. North America Proximity Mobile Payment Market Analysis and Forecast, By Country, 2012-2022
6.1. US Proximity Mobile Payment Market Size and Forecast, 2012-2022
6.1.1. Revenue (US$ Mn) Comparison, By Mode of Payment
6.1.2. Revenue (US$ Mn) Comparison, By End-use Industry
6.2. Canada Proximity Mobile Payment Market Size and Forecast, 2012-2022
6.2.1. Revenue (US$ Mn) Comparison, By Mode of Payment
6.2.2. Revenue (US$ Mn) Comparison, By End-use Industry
7. Latin America Proximity Mobile Payment Market Analysis and Forecast, By Country, 2012-2022
7.1. Brazil Proximity Mobile Payment Market Size and Forecast, 2012-2022
7.1.1. Revenue (US$ Mn) Comparison, By Mode of Payment
7.1.2. Revenue (US$ Mn) Comparison, By End-use Industry
7.2. Mexico Proximity Mobile Payment Market Size and Forecast, 2012-2022
7.2.1. Revenue (US$ Mn) Comparison, By Mode of Payment
7.2.2. Revenue (US$ Mn) Comparison, By End-use Industry
7.3. Argentina Proximity Mobile Payment Market Size and Forecast, 2012-2022
7.3.1. Revenue (US$ Mn) Comparison, By Mode of Payment
7.3.2. Revenue (US$ Mn) Comparison, By End-use Industry
8. Europe Proximity Mobile Payment Market Analysis and Forecast, By Country, 2012-2022
8.1. Germany Proximity Mobile Payment Market Size and Forecast, 2012-2022
8.1.1. Revenue (US$ Mn) Comparison, By Mode of Payment
8.1.2. Revenue (US$ Mn) Comparison, By End-use Industry
8.2. UK Proximity Mobile Payment Market Size and Forecast, 2012-2022
8.2.1. Revenue (US$ Mn) Comparison, By Mode of Payment
8.2.2. Revenue (US$ Mn) Comparison, By End-use Industry
8.3. France Proximity Mobile Payment Market Size and Forecast, 2012-2022
8.3.1. Revenue (US$ Mn) Comparison, By Mode of Payment
8.3.2. Revenue (US$ Mn) Comparison, By End-use Industry
8.4. Spain Proximity Mobile Payment Market Size and Forecast, 2012-2022
8.4.1. Revenue (US$ Mn) Comparison, By Mode of Payment
8.4.2. Revenue (US$ Mn) Comparison, By End-use Industry
8.5. Italy Proximity Mobile Payment Market Size and Forecast, 2012-2022
8.5.1. Revenue (US$ Mn) Comparison, By Mode of Payment
8.5.2. Revenue (US$ Mn) Comparison, By End-use Industry
8.6. Nordic Proximity Mobile Payment Market Size and Forecast, 2012-2022
8.6.1. Revenue (US$ Mn) Comparison, By Mode of Payment
8.6.2. Revenue (US$ Mn) Comparison, By End-use Industry
9. Japan Proximity Mobile Payment Market Analysis and Forecast, By Country, 2012-2022
9.1. Japan Proximity Mobile Payment Market Size and Forecast, 2012-2022
9.1.1. Revenue (US$ Mn) Comparison, By Mode of Payment
9.1.2. Revenue (US$ Mn) Comparison, By End-use Industry
10. APEJ Proximity Mobile Payment Market Analysis and Forecast, By Country, 2012-2022
10.1. China Proximity Mobile Payment Market Size and Forecast, 2012-2022
10.1.1. Revenue (US$ Mn) Comparison, By Mode of Payment
10.1.2. Revenue (US$ Mn) Comparison, By End-use Industry
10.2. India Proximity Mobile Payment Market Size and Forecast, 2012-2022
10.2.1. Revenue (US$ Mn) Comparison, By Mode of Payment
10.2.2. Revenue (US$ Mn) Comparison, By End-use Industry
10.3. Malaysia Proximity Mobile Payment Market Size and Forecast, 2012-2022
10.3.1. Revenue (US$ Mn) Comparison, By Mode of Payment
10.3.2. Revenue (US$ Mn) Comparison, By End-use Industry
10.4. Thailand Proximity Mobile Payment Market Size and Forecast, 2012-2022
10.4.1. Revenue (US$ Mn) Comparison, By Mode of Payment
10.4.2. Revenue (US$ Mn) Comparison, By End-use Industry
10.5. Singapore Proximity Mobile Payment Market Size and Forecast, 2012-2022
10.5.1. Revenue (US$ Mn) Comparison, By Mode of Payment
10.5.2. Revenue (US$ Mn) Comparison, By End-use Industry
10.6. Australia Proximity Mobile Payment Market Size and Forecast, 2012-2022
10.6.1. Revenue (US$ Mn) Comparison, By Mode of Payment
10.6.2. Revenue (US$ Mn) Comparison, By End-use Industry
11. MEA Proximity Mobile Payment Market Analysis and Forecast, By Country, 2012-2022
11.1. GCC Countries Proximity Mobile Payment Market Size and Forecast, 2012-2022
11.1.1. Revenue (US$ Mn) Comparison, By Mode of Payment
11.1.2. Revenue (US$ Mn) Comparison, By End-use Industry
11.2. South Africa Proximity Mobile Payment Market Size and Forecast, 2012-2022
11.2.1. Revenue (US$ Mn) Comparison, By Mode of Payment
11.2.2. Revenue (US$ Mn) Comparison, By End-use Industry
11.3. Nigeria Proximity Mobile Payment Market Size and Forecast, 2012-2022
11.3.1. Revenue (US$ Mn) Comparison, By Mode of Payment
11.3.2. Revenue (US$ Mn) Comparison, By End-use Industry
11.4. Israel Proximity Mobile Payment Market Size and Forecast, 2012-2022
11.4.1. Revenue (US$ Mn) Comparison, By Mode of Payment
11.4.2. Revenue (US$ Mn) Comparison, By End-use Industry
12. Global Proximity Mobile Payment Market Company Share, Competition Landscape and Company Profiles
12.1. Company Share Analysis
12.2. Competition Landscape
12.3. Company Profiles
12.3.1. Samsung Electronics Co Ltd
12.3.2. ACI Worldwide, Inc.
12.3.3. Alphabet Inc.
12.3.4. Apple Inc.
12.3.5. Visa Inc.
12.3.6. PayPal Holdings, Inc.
12.3.7. Mastercard Incorporated
12.3.8. Square, Inc.
12.3.9. Starbucks Corporation
12.3.10. CVS Health Corp.
13. Research Methodology
14. Secondary and Primary Sources
15. Assumptions and Acronyms
16. Disclaimer
List of Tables
TABLE 1 Global Proximity Mobile Payment Market Value (US$ Mn), 2012-2016
TABLE 2 Global Proximity Mobile Payment Market Value (US$ Mn), 2017-2022
TABLE 3 Global Proximity Mobile Payment Market Value (US$ Mn) and Y-o-Y, 2015-2022
TABLE 4 Global Near Field Communication Segment Value (US$ Mn), By Region 2012-2016
TABLE 5 Global Near Field Communication Segment Value (US$ Mn), By Region 2017-2022
TABLE 6 Global Near Field Communication Segment Market Share, By Region 2012-2016
TABLE 7 Global Near Field Communication Segment Market Share, By Region 2017-2022
TABLE 8 Global Near Field Communication Segment Y-o-Y, By Region 2015-2022
TABLE 9 Global Barcode Payments Segment Value (US$ Mn), By Region 2012-2016
TABLE 10 Global Barcode Payments Segment Value (US$ Mn), By Region 2017-2022
TABLE 11 Global Barcode Payments Segment Market Share, By Region 2012-2016
TABLE 12 Global Barcode Payments Segment Market Share, By Region 2017-2022
TABLE 13 Global Barcode Payments Segment Y-o-Y, By Region 2015-2022
TABLE 14 Global Retail Segment Value (US$ Mn), By Region 2012-2016
TABLE 15 Global Retail Segment Value (US$ Mn), By Region 2017-2022
TABLE 16 Global Retail Segment Market Share, By Region 2012-2016
TABLE 17 Global Retail Segment Market Share, By Region 2017-2022
TABLE 18 Global Retail Segment Y-o-Y, By Region 2015-2022
TABLE 19 Global Hospitality & Tourism Segment Value (US$ Mn), By Region 2012-2016
TABLE 20 Global Hospitality & Tourism Segment Value (US$ Mn), By Region 2017-2022
TABLE 21 Global Hospitality & Tourism Segment Market Share, By Region 2012-2016
TABLE 22 Global Hospitality & Tourism Segment Market Share, By Region 2017-2022
TABLE 23 Global Hospitality & Tourism Segment Y-o-Y, By Region 2015-2022
TABLE 24 Global IT & Telecommunication Segment Value (US$ Mn), By Region 2012-2016
TABLE 25 Global IT & Telecommunication Segment Value (US$ Mn), By Region 2017-2022
TABLE 26 Global IT & Telecommunication Segment Market Share, By Region 2012-2016
TABLE 27 Global IT & Telecommunication Segment Market Share, By Region 2017-2022
TABLE 28 Global IT & Telecommunication Segment Y-o-Y, By Region 2015-2022
TABLE 29 Global BFSI Segment Value (US$ Mn), By Region 2012-2016
TABLE 30 Global BFSI Segment Value (US$ Mn), By Region 2017-2022
TABLE 31 Global BFSI Segment Market Share, By Region 2012-2016
TABLE 32 Global BFSI Segment Market Share, By Region 2017-2022
TABLE 33 Global BFSI Segment Y-o-Y, By Region 2015-2022
TABLE 34 Global Media & Entertainment Segment Value (US$ Mn), By Region 2012-2016
TABLE 35 Global Media & Entertainment Segment Value (US$ Mn), By Region 2017-2022
TABLE 36 Global Media & Entertainment Segment Market Share, By Region 2012-2016
TABLE 37 Global Media & Entertainment Segment Market Share, By Region 2017-2022
TABLE 38 Global Media & Entertainment Segment Y-o-Y, By Region 2015-2022
TABLE 39 Global Healthcare Segment Value (US$ Mn), By Region 2012-2016
TABLE 40 Global Healthcare Segment Value (US$ Mn), By Region 2017-2022
TABLE 41 Global Healthcare Segment Market Share, By Region 2012-2016
TABLE 42 Global Healthcare Segment Market Share, By Region 2017-2022
TABLE 43 Global Healthcare Segment Y-o-Y, By Region 2015-2022
TABLE 44 Global Airline Segment Value (US$ Mn), By Region 2012-2016
TABLE 45 Global Airline Segment Value (US$ Mn), By Region 2017-2022
TABLE 46 Global Airline Segment Market Share, By Region 2012-2016
TABLE 47 Global Airline Segment Market Share, By Region 2017-2022
TABLE 48 Global Airline Segment Y-o-Y, By Region 2015-2022
TABLE 49 Global Others Segment Value (US$ Mn), By Region 2012-2016
TABLE 50 Global Others Segment Value (US$ Mn), By Region 2017-2022
TABLE 51 Global Others Segment Market Share, By Region 2012-2016
TABLE 52 Global Others Segment Market Share, By Region 2017-2022
TABLE 53 Global Others Segment Y-o-Y, By Region 2015-2022
TABLE 54 North America Proximity Mobile Payment Market Value (US$ Mn), By Mode of Payment 2012-2016
TABLE 55 North America Proximity Mobile Payment Market Value (US$ Mn), By Mode of Payment 2017-2022
TABLE 56 North America Proximity Mobile Payment Market Value (US$ Mn), By End-use Industry 2012-2016
TABLE 57 North America Proximity Mobile Payment Market Value (US$ Mn), By End-use Industry 2017-2022
TABLE 58 Latin America Proximity Mobile Payment Market Value (US$ Mn), By Mode of Payment 2012-2016
TABLE 59 Latin America Proximity Mobile Payment Market Value (US$ Mn), By Mode of Payment 2017-2022
TABLE 60 Latin America Proximity Mobile Payment Market Value (US$ Mn), By End-use Industry 2012-2016
TABLE 61 Latin America Proximity Mobile Payment Market Value (US$ Mn), By End-use Industry 2017-2022
TABLE 62 Europe Proximity Mobile Payment Market Value (US$ Mn), By Mode of Payment 2012-2016
TABLE 63 Europe Proximity Mobile Payment Market Value (US$ Mn), By Mode of Payment 2017-2022
TABLE 64 Europe Proximity Mobile Payment Market Value (US$ Mn), By End-use Industry 2012-2016
TABLE 65 Europe Proximity Mobile Payment Market Value (US$ Mn), By End-use Industry 2017-2022
TABLE 66 Japan Proximity Mobile Payment Market Value (US$ Mn), By Mode of Payment 2012-2016
TABLE 67 Japan Proximity Mobile Payment Market Value (US$ Mn), By Mode of Payment 2017-2022
TABLE 68 Japan Proximity Mobile Payment Market Value (US$ Mn), By End-use Industry 2012-2016
TABLE 69 Japan Proximity Mobile Payment Market Value (US$ Mn), By End-use Industry 2017-2022
TABLE 70 APEJ Proximity Mobile Payment Market Value (US$ Mn), By Mode of Payment 2012-2016
TABLE 71 APEJ Proximity Mobile Payment Market Value (US$ Mn), By Mode of Payment 2017-2022
TABLE 72 APEJ Proximity Mobile Payment Market Value (US$ Mn), By End-use Industry 2012-2016
TABLE 73 APEJ Proximity Mobile Payment Market Value (US$ Mn), By End-use Industry 2017-2022
TABLE 74 MEA Proximity Mobile Payment Market Value (US$ Mn), By Mode of Payment 2012-2016
TABLE 75 MEA Proximity Mobile Payment Market Value (US$ Mn), By Mode of Payment 2017-2022
TABLE 76 MEA Proximity Mobile Payment Market Value (US$ Mn), By End-use Industry 2012-2016
TABLE 77 MEA Proximity Mobile Payment Market Value (US$ Mn), By End-use Industry 2017-2022
TABLE 78 US Proximity Mobile Payment Market Value (US$ Mn), By Mode of Payment 2012-2016
TABLE 79 US Proximity Mobile Payment Market Value (US$ Mn), By Mode of Payment 2017-2022
TABLE 80 US Proximity Mobile Payment Market Value (US$ Mn), By End-use Industry 2012-2016
TABLE 81 US Proximity Mobile Payment Market Value (US$ Mn), By End-use Industry 2017-2022
TABLE 82 Canada Proximity Mobile Payment Market Value (US$ Mn), By Mode of Payment 2012-2016
TABLE 83 Canada Proximity Mobile Payment Market Value (US$ Mn), By Mode of Payment 2017-2022
TABLE 84 Canada Proximity Mobile Payment Market Value (US$ Mn), By End-use Industry 2012-2016
TABLE 85 Canada Proximity Mobile Payment Market Value (US$ Mn), By End-use Industry 2017-2022
TABLE 86 Brazil Proximity Mobile Payment Market Value (US$ Mn), By Mode of Payment 2012-2016
TABLE 87 Brazil Proximity Mobile Payment Market Value (US$ Mn), By Mode of Payment 2017-2022
TABLE 88 Brazil Proximity Mobile Payment Market Value (US$ Mn), By End-use Industry 2012-2016
TABLE 89 Brazil Proximity Mobile Payment Market Value (US$ Mn), By End-use Industry 2017-2022
TABLE 90 Mexico Proximity Mobile Payment Market Value (US$ Mn), By Mode of Payment 2012-2016
TABLE 91 Mexico Proximity Mobile Payment Market Value (US$ Mn), By Mode of Payment 2017-2022
TABLE 92 Mexico Proximity Mobile Payment Market Value (US$ Mn), By End-use Industry 2012-2016
TABLE 93 Mexico Proximity Mobile Payment Market Value (US$ Mn), By End-use Industry 2017-2022
TABLE 94 Argentina Proximity Mobile Payment Market Value (US$ Mn), By Mode of Payment 2012-2016
TABLE 95 Argentina Proximity Mobile Payment Market Value (US$ Mn), By Mode of Payment 2017-2022
TABLE 96 Argentina Proximity Mobile Payment Market Value (US$ Mn), By End-use Industry 2012-2016
TABLE 97 Argentina Proximity Mobile Payment Market Value (US$ Mn), By End-use Industry 2017-2022
TABLE 98 Germany Proximity Mobile Payment Market Value (US$ Mn), By Mode of Payment 2012-2016
TABLE 99 Germany Proximity Mobile Payment Market Value (US$ Mn), By Mode of Payment 2017-2022
TABLE 100 Germany Proximity Mobile Payment Market Value (US$ Mn), By End-use Industry 2012-2016
TABLE 101 Germany Proximity Mobile Payment Market Value (US$ Mn), By End-use Industry 2017-2022
TABLE 102 UK Proximity Mobile Payment Market Value (US$ Mn), By Mode of Payment 2012-2016
TABLE 103 UK Proximity Mobile Payment Market Value (US$ Mn), By Mode of Payment 2017-2022
TABLE 104 UK Proximity Mobile Payment Market Value (US$ Mn), By End-use Industry 2012-2016
TABLE 105 UK Proximity Mobile Payment Market Value (US$ Mn), By End-use Industry 2017-2022
TABLE 106 France Proximity Mobile Payment Market Value (US$ Mn), By Mode of Payment 2012-2016
TABLE 107 France Proximity Mobile Payment Market Value (US$ Mn), By Mode of Payment 2017-2022
TABLE 108 France Proximity Mobile Payment Market Value (US$ Mn), By End-use Industry 2012-2016
TABLE 109 France Proximity Mobile Payment Market Value (US$ Mn), By End-use Industry 2017-2022
TABLE 110 Spain Proximity Mobile Payment Market Value (US$ Mn), By Mode of Payment 2012-2016
TABLE 111 Spain Proximity Mobile Payment Market Value (US$ Mn), By Mode of Payment 2017-2022
TABLE 112 Spain Proximity Mobile Payment Market Value (US$ Mn), By End-use Industry 2012-2016
TABLE 113 Spain Proximity Mobile Payment Market Value (US$ Mn), By End-use Industry 2017-2022
TABLE 114 Italy Proximity Mobile Payment Market Value (US$ Mn), By Mode of Payment 2012-2016
TABLE 115 Italy Proximity Mobile Payment Market Value (US$ Mn), By Mode of Payment 2017-2022
TABLE 116 Italy Proximity Mobile Payment Market Value (US$ Mn), By End-use Industry 2012-2016
TABLE 117 Italy Proximity Mobile Payment Market Value (US$ Mn), By End-use Industry 2017-2022
TABLE 118 Nordic Proximity Mobile Payment Market Value (US$ Mn), By Mode of Payment 2012-2016
TABLE 119 Nordic Proximity Mobile Payment Market Value (US$ Mn), By Mode of Payment 2017-2022
TABLE 120 Nordic Proximity Mobile Payment Market Value (US$ Mn), By End-use Industry 2012-2016
TABLE 121 Nordic Proximity Mobile Payment Market Value (US$ Mn), By End-use Industry 2017-2022
TABLE 122 Japan Proximity Mobile Payment Market Value (US$ Mn), By Mode of Payment 2012-2016
TABLE 123 Japan Proximity Mobile Payment Market Value (US$ Mn), By Mode of Payment 2017-2022
TABLE 124 Japan Proximity Mobile Payment Market Value (US$ Mn), By End-use Industry 2012-2016
TABLE 125 Japan Proximity Mobile Payment Market Value (US$ Mn), By End-use Industry 2017-2022
TABLE 126 China Proximity Mobile Payment Market Value (US$ Mn), By Mode of Payment 2012-2016
TABLE 127 China Proximity Mobile Payment Market Value (US$ Mn), By Mode of Payment 2017-2022
TABLE 128 China Proximity Mobile Payment Market Value (US$ Mn), By End-use Industry 2012-2016
TABLE 129 China Proximity Mobile Payment Market Value (US$ Mn), By End-use Industry 2017-2022
TABLE 130 India Proximity Mobile Payment Market Value (US$ Mn), By Mode of Payment 2012-2016
TABLE 131 India Proximity Mobile Payment Market Value (US$ Mn), By Mode of Payment 2017-2022
TABLE 132 India Proximity Mobile Payment Market Value (US$ Mn), By End-use Industry 2012-2016
TABLE 133 India Proximity Mobile Payment Market Value (US$ Mn), By End-use Industry 2017-2022
TABLE 134 Malaysia Proximity Mobile Payment Market Value (US$ Mn), By Mode of Payment 2012-2016
TABLE 135 Malaysia Proximity Mobile Payment Market Value (US$ Mn), By Mode of Payment 2017-2022
TABLE 136 Malaysia Proximity Mobile Payment Market Value (US$ Mn), By End-use Industry 2012-2016
TABLE 137 Malaysia Proximity Mobile Payment Market Value (US$ Mn), By End-use Industry 2017-2022
TABLE 138 Thailand Proximity Mobile Payment Market Value (US$ Mn), By Mode of Payment 2012-2016
TABLE 139 Thailand Proximity Mobile Payment Market Value (US$ Mn), By Mode of Payment 2017-2022
TABLE 140 Thailand Proximity Mobile Payment Market Value (US$ Mn), By End-use Industry 2012-2016
TABLE 141 Thailand Proximity Mobile Payment Market Value (US$ Mn), By End-use Industry 2017-2022
TABLE 142 Singapore Proximity Mobile Payment Market Value (US$ Mn), By Mode of Payment 2012-2016
TABLE 143 Singapore Proximity Mobile Payment Market Value (US$ Mn), By Mode of Payment 2017-2022
TABLE 144 Singapore Proximity Mobile Payment Market Value (US$ Mn), By End-use Industry 2012-2016
TABLE 145 Singapore Proximity Mobile Payment Market Value (US$ Mn), By End-use Industry 2017-2022
TABLE 146 Australia Proximity Mobile Payment Market Value (US$ Mn), By Mode of Payment 2012-2016
TABLE 147 Australia Proximity Mobile Payment Market Value (US$ Mn), By Mode of Payment 2017-2022
TABLE 148 Australia Proximity Mobile Payment Market Value (US$ Mn), By End-use Industry 2012-2016
TABLE 149 Australia Proximity Mobile Payment Market Value (US$ Mn), By End-use Industry 2017-2022
TABLE 150 GCC Countries Proximity Mobile Payment Market Value (US$ Mn), By Mode of Payment 2012-2016
TABLE 151 GCC Countries Proximity Mobile Payment Market Value (US$ Mn), By Mode of Payment 2017-2022
TABLE 152 GCC Countries Proximity Mobile Payment Market Value (US$ Mn), By End-use Industry 2012-2016
TABLE 153 GCC Countries Proximity Mobile Payment Market Value (US$ Mn), By End-use Industry 2017-2022
TABLE 154 South Africa Proximity Mobile Payment Market Value (US$ Mn), By Mode of Payment 2012-2016
TABLE 155 South Africa Proximity Mobile Payment Market Value (US$ Mn), By Mode of Payment 2017-2022
TABLE 156 South Africa Proximity Mobile Payment Market Value (US$ Mn), By End-use Industry 2012-2016
TABLE 157 South Africa Proximity Mobile Payment Market Value (US$ Mn), By End-use Industry 2017-2022
TABLE 158 Nigeria Proximity Mobile Payment Market Value (US$ Mn), By Mode of Payment 2012-2016
TABLE 159 Nigeria Proximity Mobile Payment Market Value (US$ Mn), By Mode of Payment 2017-2022
TABLE 160 Nigeria Proximity Mobile Payment Market Value (US$ Mn), By End-use Industry 2012-2016
TABLE 161 Nigeria Proximity Mobile Payment Market Value (US$ Mn), By End-use Industry 2017-2022
TABLE 162 Israel Proximity Mobile Payment Market Value (US$ Mn), By Mode of Payment 2012-2016
TABLE 163 Israel Proximity Mobile Payment Market Value (US$ Mn), By Mode of Payment 2017-2022
TABLE 164 Israel Proximity Mobile Payment Market Value (US$ Mn), By End-use Industry 2012-2016
TABLE 165 Israel Proximity Mobile Payment Market Value (US$ Mn), By End-use Industry 2017-2022
List of Figures
FIG. 1 Global Proximity Mobile Payment Market Value (US$ Mn), 2012-2016
FIG. 2 Global Proximity Mobile Payment Market Value (US$ Mn) Forecast, 2017-2022
FIG. 3 Global Proximity Mobile Payment Market Value (US$ Mn) and Y-o-Y, 2015-2022
FIG. 4 Global Near Field Communication Segment Market Value (US$ Mn) By Region, 2012-2016
FIG. 5 Global Near Field Communication Segment Market Value (US$ Mn) By Region, 2017-2022
FIG. 6 Global Near Field Communication Segment Y-o-Y Growth Rate, By Region, 2015-2022
FIG. 7 Global Barcode Payments Segment Market Value (US$ Mn) By Region, 2012-2016
FIG. 8 Global Barcode Payments Segment Market Value (US$ Mn) By Region, 2017-2022
FIG. 9 Global Barcode Payments Segment Y-o-Y Growth Rate, By Region, 2015-2022
FIG. 10 Global Retail Segment Market Value (US$ Mn) By Region, 2012-2016
FIG. 11 Global Retail Segment Market Value (US$ Mn) By Region, 2017-2022
FIG. 12 Global Retail Segment Y-o-Y Growth Rate, By Region, 2015-2022
FIG. 13 Global Hospitality & Tourism Segment Market Value (US$ Mn) By Region, 2012-2016
FIG. 14 Global Hospitality & Tourism Segment Market Value (US$ Mn) By Region, 2017-2022
FIG. 15 Global Hospitality & Tourism Segment Y-o-Y Growth Rate, By Region, 2015-2022
FIG. 16 Global IT & Telecommunication Segment Market Value (US$ Mn) By Region, 2012-2016
FIG. 17 Global IT & Telecommunication Segment Market Value (US$ Mn) By Region, 2017-2022
FIG. 18 Global IT & Telecommunication Segment Y-o-Y Growth Rate, By Region, 2015-2022
FIG. 19 Global BFSI Segment Market Value (US$ Mn) By Region, 2012-2016
FIG. 20 Global BFSI Segment Market Value (US$ Mn) By Region, 2017-2022
FIG. 21 Global BFSI Segment Y-o-Y Growth Rate, By Region, 2015-2022
FIG. 22 Global Media & Entertainment Segment Market Value (US$ Mn) By Region, 2012-2016
FIG. 23 Global Media & Entertainment Segment Market Value (US$ Mn) By Region, 2017-2022
FIG. 24 Global Media & Entertainment Segment Y-o-Y Growth Rate, By Region, 2015-2022
FIG. 25 Global Healthcare Segment Market Value (US$ Mn) By Region, 2012-2016
FIG. 26 Global Healthcare Segment Market Value (US$ Mn) By Region, 2017-2022
FIG. 27 Global Healthcare Segment Y-o-Y Growth Rate, By Region, 2015-2022
FIG. 28 Global Airline Segment Market Value (US$ Mn) By Region, 2012-2016
FIG. 29 Global Airline Segment Market Value (US$ Mn) By Region, 2017-2022
FIG. 30 Global Airline Segment Y-o-Y Growth Rate, By Region, 2015-2022
FIG. 31 Global Others Segment Market Value (US$ Mn) By Region, 2012-2016
FIG. 32 Global Others Segment Market Value (US$ Mn) By Region, 2017-2022
FIG. 33 Global Others Segment Y-o-Y Growth Rate, By Region, 2015-2022
FIG. 34 North America Proximity Mobile Payment Market Value (US$ Mn), By Mode of Payment 2012-2016
FIG. 35 North America Proximity Mobile Payment Market Value (US$ Mn), By Mode of Payment 2017-2022
FIG. 36 North America Proximity Mobile Payment Market Value (US$ Mn), By End-use Industry 2012-2016
FIG. 37 North America Proximity Mobile Payment Market Value (US$ Mn), By End-use Industry 2017-2022
FIG. 38 Latin America Proximity Mobile Payment Market Value (US$ Mn), By Mode of Payment 2012-2016
FIG. 39 Latin America Proximity Mobile Payment Market Value (US$ Mn), By Mode of Payment 2017-2022
FIG. 40 Latin America Proximity Mobile Payment Market Value (US$ Mn), By End-use Industry 2012-2016
FIG. 41 Latin America Proximity Mobile Payment Market Value (US$ Mn), By End-use Industry 2017-2022
FIG. 42 Europe Proximity Mobile Payment Market Value (US$ Mn), By Mode of Payment 2012-2016
FIG. 43 Europe Proximity Mobile Payment Market Value (US$ Mn), By Mode of Payment 2017-2022
FIG. 44 Europe Proximity Mobile Payment Market Value (US$ Mn), By End-use Industry 2012-2016
FIG. 45 Europe Proximity Mobile Payment Market Value (US$ Mn), By End-use Industry 2017-2022
FIG. 46 Japan Proximity Mobile Payment Market Value (US$ Mn), By Mode of Payment 2012-2016
FIG. 47 Japan Proximity Mobile Payment Market Value (US$ Mn), By Mode of Payment 2017-2022
FIG. 48 Japan Proximity Mobile Payment Market Value (US$ Mn), By End-use Industry 2012-2016
FIG. 49 Japan Proximity Mobile Payment Market Value (US$ Mn), By End-use Industry 2017-2022
FIG. 50 APEJ Proximity Mobile Payment Market Value (US$ Mn), By Mode of Payment 2012-2016
FIG. 51 APEJ Proximity Mobile Payment Market Value (US$ Mn), By Mode of Payment 2017-2022
FIG. 52 APEJ Proximity Mobile Payment Market Value (US$ Mn), By End-use Industry 2012-2016
FIG. 53 APEJ Proximity Mobile Payment Market Value (US$ Mn), By End-use Industry 2017-2022
FIG. 54 MEA Proximity Mobile Payment Market Value (US$ Mn), By Mode of Payment 2012-2016
FIG. 55 MEA Proximity Mobile Payment Market Value (US$ Mn), By Mode of Payment 2017-2022
FIG. 56 MEA Proximity Mobile Payment Market Value (US$ Mn), By End-use Industry 2012-2016
FIG. 57 MEA Proximity Mobile Payment Market Value (US$ Mn), By End-use Industry 2017-2022
Copyright © Transparency Market Research, Inc. All Rights reserved
Trust Online

Proximity Mobile Payment Market