
Reports
Reports
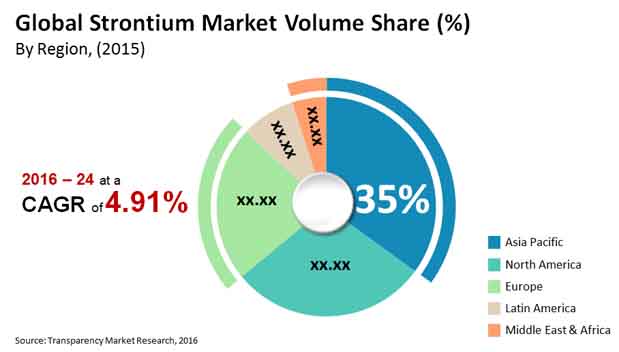
Strontium is an alkaline metal that is found in abundance in the earth’s crust and ranks 15th in its availability quotient. Strontium is found in Celestine and Strontianite in form of isotopes. Strontium possesses thermodynamic and mechanical properties which have boosted its demand in pyrotechnic, medical, electronics, and other sectors. This aspect estimates an excellent growth trajectory of the strontium market. The global strontium market is foreseen to expand at a CAGR of 4.91% during the forecast period of 2016-2024. According to the studies conducted by TMR, the strontium market is expected to reach 372.09-kilo tons by the end of 2024.
The strontium market is projected to show substantial growth in the electronics segment due to its thermodynamic characteristics. The prominent use of strontium in television sets and other electronic items such as cameras, mobile phones, flashlights, motor generators, and many others. The increasing sale of electronic items in the current scenario has led to the growth of the strontium market during the forecast period.
Furthermore, the medical industry is using strontium ranelate for destroying cancer cells. It is also beneficial in bone formation and increases calcium absorption. Additionally, it helps in the prevention of tooth decay as well. These factors are expected to generate growth in the strontium market.
Strontium compounds provide red colorant which helps the in the creation of various shades. Fireworks, usually use red colors to exhibit themselves. In accordance with this, the demand for strontium has increased. Thus, the strontium market is projected to witness an excellent growth curve.
The strontium compound strontium carbonate is used in various applications and is one of the primary compounds used to produce other strontium compounds. Strontium carbonate is produced the d from processing and refining of mineral Celestine. The various applications in which strontium is used are in paints & coating and the medical industry. Strontium carbonate is also used in zinc refining and production of majority master alloys. Strontium ferrite magnets are used in small electric motors, microwave devices, recording media, and the electronics and telecommunication industry. Strontium carbonate is also used in zinc refining and production of majority master alloys. All these aspects are conducive to the growth of the strontiumThe market.
The Asia Pacific is the leading region in the strontium market. Countries such as India and China are major consumers of strontium. The growing rural-to-urban migration across various countries, especially in developing economies and densely populated regions like India and China, may churn substantial growth opportunities for the market. Due to rising urbanization, an increase in residential and commercial buildings is being observed, which is ultimately expanding the demand for paints. As strontium is used in paints, the growth trajectory is expected to be strengthened during the forecast period. In addition, the government bodies of numerous countries are introducing smart city initiatives. These factors may boost the demand for new constructions and infrastructure, eventually propelling the growth opportunities across the strontium market.
The U.S., the U.K., France, and Italy are the major consumers of strontium. North America is the second leading the region in strontium market. Further, North America and the Asia Pacific have lucrative opportunities and hold a major market share. North America held 29.65% of the strontium market share in the year 2015. The strontium market is largely consolidated.
A few well-established players are responsible for a large growth share. Medium or small-sized manufacturers in the strontium market are either acquired or merged with key players for decreasing the competition. Furthermore, R&D activities are crucial for the growth of the strontium market. The key players invest in these activities for propelling novel formulations and strategies.
Some of the leading players in the strontium market are BassTech International, Sakai Chemical Industry Co., Ltd., and Solvay
Strontium Market is expected to reach 372.09-kilo tons by the end of 2024
Strontium Market is estimated to rise at a CAGR of 4.91% during forecast period
Rising demand for strontium in pyrotechnic, medical, electronics, and other sectors is expected to drive the Strontium Market
Asia Pacific is more attractive for vendors in the Strontium Market
Key players of Strontium Market are BassTech International, Sakai Chemical Industry Co., Ltd., and Solvay
1. Preface
1.1. Report Scope and Market Segmentation
1.2. Research Highlights
2.Assumptions and Research Methodology
2.1. Report Assumptions
2.2. Secondary Sources and Acronyms Used
2.3 .Research Methodology
3.Executive Summary
3.1. Market Snapshot
3.2. Market Shares
3.3. Top Trends
4.Market Overview
4.1. Product Overview
4.2. Market Indicators
5.Market Dynamics
5.1. Drivers and Restraints Snapshot Analysis
5.1.1. Drivers
5.1.2. Restraints
5.1.3. Opportunities
5.2. Global Strontium Market Analysis and Forecast
5.3. Porter’s Analysis
5.3.1. Threat of Substitutes
5.3.2. Bargaining Power of Buyers
5.3.3. Bargaining Power of Suppliers
5.3.4. Threat of New Entrants
5.3.5. Degree of Competition
5.4. Value Chain Analysis
5.5. Global Strontium Market Outlook, 2015
6.Strontium Market Analysis, by Product
6.1. Introduction
6.2. Key Findings
6.3. Global Strontium Market Value Share Analysis, by Product
6.4. Global Strontium Market Forecast and Analysis, By Product
6.4.1. Strontium carbonate
6.4.2. Strontium nitrate
6.4.3. Strontium sulphate
6.4.4. Others
6.5. Global Strontium Market Analysis, by Product
6.6. Global Strontium Market Attractiveness Analysis, by Product
6.7. Key Trends
7. Strontium Market Analysis, by Application
7.1. Introduction
7.2. Key Findings
7.3. Global Strontium Market Value Share Analysis, by Application
7.4. Global Strontium Market Forecast and Analysis, by Application
7.4.1. Pyrotechnics
7.4.2. Ferrite magnets
7.4.3. Master alloys
7.4.4. Paints & Coatings
7.4.5. Medical
7.4.6. Zinc refining
7.4.7. Others
7.5. Global Strontium Market Analysis, by Application
7.6. Global Strontium Market Attractiveness Analysis, by Application
7.7. Key Trends
8. Global Strontium Market Analysis by Region
8.1. Global Market Size Growth Scenario, by Region, 2015
8.2. Key Findings
8.3. Global Strontium Market Value Share Analysis, by Region
8.4. Global Strontium Market Forecast, by Region
8.4.1. North America
8.4.2. Latin America
8.4.3. Europe
8.4.4. Asia Pacific
8.4.5. Middle East and Africa
8.5. Global Strontium Content, by Region
8.6. Global Strontium Market Attractiveness Analysis, by Region
8.7. Key Trends
9.North America Strontium Market Analysis
9.1. Key Findings
9.2. North America Strontium Market Overview
9.3 .North America Strontium Market Value Share Analysis, by Product
9.4. North America Strontium Market Forecast, by Product
9.5. North America Strontium Market Value Share Analysis, by Application
9.6. North America Strontium Market Forecast, by Application
9.7. North America Strontium Market Value Share Analysis, by Country
9.8. North America Strontium Market Forecast, by Country
9.8.1. U.S.
9.8.2. Canada
9.9. North America Strontium Content in Product
9.10. North America Strontium Market Attractiveness Analysis
10. Latin America Strontium Market Analysis
10.1. Key Findings
10.2. Latin America Strontium Market Overview
10.3. Latin America Strontium Market Value Share Analysis, by Product
10.4. Latin America Strontium Market Forecast, by Product
10.5. Latin America Strontium Market Value Share Analysis, by Application
10.6. Latin America Strontium Market Forecast, by Application
10.7. Latin America Strontium Market Value Share Analysis, by Country
10.8. Latin America Strontium Market Forecast, by Country
10.8.1. Brazil
10.8.2. Mexico
10.8.3. Rest of Latin America
10.9. Latin America Strontium Content in Product
10.10. Latin America Strontium Market Attractiveness Analysis
11.Europe Strontium Market Analysis
11.1. Key Findings
11.2. Europe Strontium Market Overview
11.3. Europe Strontium Market Value Share Analysis, by Product
11.4. Europe Strontium Market Forecast, by Product
11.5. Europe Strontium Market Value Share Analysis, by Application
11.6. Europe Strontium Market Forecast, by Application
11.7. Europe Strontium Market Value Share Analysis, by Country
11.8. Europe Strontium Market Forecast, by Country
11.8.1. Germany
11.8.2. France
11.8.3. U.K.
11.8.4. Spain
11.8.5. Italy
11.8.6. Rest of Europe
11.9. Europe Strontium Content in Product
11.10. Europe Strontium Market Attractiveness Analysis
12.Asia Pacific Strontium Market Analysis
12.1. Key Findings
12.2. Asia Pacific Strontium Market Overview
12.3. Asia Pacific Strontium Market Value Share Analysis, by Product
12.4. Asia Pacific Strontium Market Forecast, by Product
12.5. Asia Pacific Strontium Market Value Share Analysis, by Application
12.6. Asia Pacific Strontium Market Forecast, by Application
12.7. Asia Pacific Strontium Market Value Share Analysis, by Country
12.8. Asia Pacific Strontium Market Forecast, by Country
12.8.1. China
12.8.2. Japan
12.8.3. India
12.8.4.ASEAN
12.8.5.Rest of Asia Pacific
12.9. Asia Pacific Strontium Content in Product
12.10. Asia Pacific Strontium Market Attractiveness Analysis
13.Middle East and Africa Strontium Market Analysis
13.1. Key Findings
13.2. Middle East and Africa Strontium Market Overview
13.3. Middle East and Africa Strontium Market Value Share Analysis, by Product
13.4. Middle East and Africa Strontium Market Forecast, by Product
13.5. Middle East and Africa Strontium Market Value Share Analysis, by Application
13.6. Middle East and Africa Strontium Market Forecast, by Application
13.7. Middle East and Africa Strontium Market Value Share Analysis, by Country
13.8. Middle East and Africa Strontium Market Forecast, by Country
13.8.1. GCC
13.8.2. South Africa
13.8.3. Rest of MEA
13.9. Middle East and Africa Strontium Content in Product
13.10. Middle East and Africa Strontium Market Attractiveness Analysis
14.Competition Landscape
14.1. Global Strontium Market Share Analysis, by Company (2015)
14.2. Company Competition Matrix
14.3. Company Profiles
14.3.1. Solvay
14.3.1.1. Company Description
14.3.1.2. Business Overview
14.3.1.3. SWOT Analysis
14.3.1.4. Strategic Overview
14.3.2. Sakai Chemical Industry Co., Ltd.
14.3.2.1. Company Description
14.3.2.2. Business Overview
14.3.2.3. SWOT Analysis
14.3.2.4. Strategic Overview
14.3.3. Quimica Del Estroncio, S.A.
14.3.3.1. Company Description
14.3.3.2. Business Overview
14.3.4. Barium & Chemicals, Inc.
14.3.4.1. Company Description
14.3.4.2. Business Overview
14.3.5. BassTech International
14.3.5.1. Company Description
14.3.5.2. Business Overview
14.3.6. Noah Technologies Corporation
14.3.6.1. Company Description
14.3.6.2. Business Overview
14.3.7. Yuxiang Magnetic Materials Ind. Co. Ltd.
14.3.7.1. Company Description
14.3.7.2. Business Overview
14.3.8. Shijiazhuang Zhengding JINSHI Chemical Co., Ltd.
14.3.8.1. Company Description
14.3.8.2. Business Overview
14.3.9. ProChem, Inc® International
14.3.9.1. Company Description
14.3.9.2. Business Overview
14.3.10. ABASSCO.
14.3.10.1. Company Description
14.3.10.2. Business Overview
14.3.11. KBM Affilips
14.3.11.1. Company Description
14.3.11.2. Business Overview
15.Key Takeaways
List of Tables
Table 01: Global Strontium Market Volume (Kilo Tons) and Revenue (US$ Mn) Forecast, by Product, 2015–2024
Table 02a: Global Strontium Market Volume (Kilo Tons) and Revenue (US$ Mn) Forecast, by Application, 2015–2024
Table 02b: Global Strontium Market Volume (Kilo Tons) and Revenue (US$ Mn) Forecast, by Application, 2015–2024
Table 03: Global Strontium Market Volume (Kilo Tons) and Revenue (US$ Mn) Forecast, by Region, 2015–2024
Table 04: Global Strontium Content (Kilo Tons), by Region, 2015–2024
Table 05: North America Strontium Market Volume (Kilo Tons) and Revenue (US$ Mn) Forecast, by Product, 2015–2024
Table 06a: North America Strontium Market Volume (Kilo Tons) and Revenue (US$ Mn) Forecast, by Application, 2015–2024
Table 06b: North America Strontium Market Volume (Kilo Tons) and Revenue (US$ Mn) Forecast, by Application, 2015–2024
Table 07: North America Strontium Market Volume (Kilo Tons) and Revenue (US$ Mn) Forecast, by Country, 2015–2024
Table 08: North America Strontium Content (Kilo Tons) in Product, 2015–2024
Table 09: Latin America Strontium Market Volume (Kilo Tons) and Revenue (US$ Mn) Forecast, by Product, 2015–2024
Table 10a: Latin America Strontium Market Volume (Kilo Tons) and Revenue (US$ Mn) Forecast, by Application, 2015–2024
Table 10b: Latin America Strontium Market Volume (Kilo Tons) and Revenue (US$ Mn) Forecast, by Application, 2015–2024
Table 11: Latin America Strontium Market Volume (Kilo Tons) and Revenue (US$ Mn) Forecast, by Country, 2015–2024
Table 12: Latin America Strontium Content (Kilo Tons) in Product, 2015–2024
Table 13: Europe Strontium Market Volume (Kilo Tons) and Revenue (US$ Mn) Forecast, by Product, 2015–2024
Table 14a: Europe Strontium Market Volume (Kilo Tons) and Revenue (US$ Mn) Forecast, by Application, 2015–2024
Table 14b: Europe Strontium Market Volume (Kilo Tons) and Revenue (US$ Mn) Forecast, by Application, 2015–2024
Table 15a: Europe Strontium Market Volume (Kilo Tons) and Revenue (US$ Mn) Forecast, by Country, 2015–2024
Table 15b: Europe Strontium Market Volume (Kilo Tons) and Revenue (US$ Mn) Forecast, by Country, 2015–2024
Table 16: Europe Strontium Content (Kilo Tons) in Product, 2015–2024
Table 17: Asia Pacific Strontium Market Volume (Kilo Tons) and Revenue (US$ Mn) Forecast, by Product, 2015–2024
Table 18a: Asia Pacific Strontium Market Volume (Kilo Tons) and Revenue (US$ Mn) Forecast, by Application, 2015–2024
Table 18b: Asia Pacific Strontium Market Volume (Kilo Tons) and Revenue (US$ Mn) Forecast, by Application, 2015–2024
Table 19: Asia Pacific Strontium Market Volume (Kilo Tons) and Revenue (US$ Mn) Forecast, by Country, 2015–2024
Table 20: Asia Pacific Strontium Content (Kilo Tons) in Product, 2015–2024
Table 21: Middle East & Africa Strontium Market Volume (Kilo Tons) and Revenue (US$ Mn) Forecast, by Product, 2015–2024
Table 22a: Middle East & Africa Strontium Market Volume (Kilo Tons) and Revenue (US$ Mn) Forecast, by Application, 2015–2024
Table 22b: Middle East & Africa Strontium Market Volume (Kilo Tons) and Revenue (US$ Mn) Forecast, by Application, 2015–2024
Table 23: Middle East & Africa Strontium Market Volume (Kilo Tons) and Revenue (US$ Mn) Forecast, by Country, 2015–2024
Table 24: Middle East & Africa Strontium Content (Kilo Tons) in Product, 2015–2024
List of Figures
Figure 01: Market Snapshot, Indicative Volume (Kilo Tons)
Figure 02: Market Shares
Figure 03: Global Strontium Market Forecast (Kilo Tons) (US$ Mn), 2015–2024
Figure 04: Global Strontium Market Size and Volume Y-o-Y Growth Projection, 2015–2024
Figure 05: Global Strontium Market Share, by Product, 2015
Figure 06: Global Strontium Market Value Share, by Application, 2015
Figure 07: Global Strontium Market Share, by Region, 2015
Figure 08: Global Strontium Market Value Share Analysis, by Product, 2015 and 2024
Figure 09: Global Strontium Carbonate Market Revenue (US$ Mn) and Volume (Kilo Tons) Forecast, 2015–2024
Figure 10: Global Strontium Nitrate Market Revenue (US$ Mn) and Volume (Kilo Tons) Forecast, 2015–2024
Figure 11: Global Strontium Sulphate Market Revenue (US$ Mn) and Volume (Kilo Tons) Forecast, 2015–2024
Figure 12: Global Others Market Revenue (US$ Mn) and Volume (Kilo Tons) Forecast, 2015–2024
Figure 13: Global Strontium Market Attractiveness Analysis, by Product
Figure 14: Global Strontium Market Value Share Analysis, by Application, 2016 and 2024
Figure 15: Global Strontium Market Revenue (US$ Mn) and Volume (Kilo Tons) Forecast for Pyrotechnics, 2015–2024
Figure 16: Global Strontium Market Revenue (US$ Mn) and Volume (Kilo Tons) Forecast for Ferrite Magnets, 2015–2024
Figure 17: Global Strontium Market Revenue (US$ Mn) and Volume (Kilo Tons) Forecast for Master Alloys, 2015–2024
Figure 18: Global Strontium Market Revenue (US$ Mn) and Volume (Kilo Tons) Forecast for Paints & Coatings, 2015–2024
Figure 19: Global Strontium Market Revenue (US$ Mn) and Volume (Kilo Tons) Forecast for Medical, 2015–2024
Figure 20: Global Strontium Market Revenue (US$ Mn) and Volume (Kilo Tons) Forecast for Zn Refining, 2015–2024
Figure 21: Global Strontium Market Revenue (US$ Mn) and Volume (Kilo Tons) Forecast for Others, 2015–2024
Figure 22: Global Strontium Market Attractiveness Analysis, by Application
Figure 23: Global Strontium Market Value Share Analysis, by Region, 2016 and 2024
Figure 24: Global Strontium Content (Kilo Tons), by Region, 2015–2024
Figure 25: Global Strontium Market Attractiveness Analysis, by Region
Figure 26: North America Strontium Market Revenue (US$ Mn) and Volume (Kilo Tons) Forecast, 2015–2024
Figure 27: North America Strontium Market Attractiveness Analysis, by Country
Figure 28: North America Strontium Market Value Share Analysis, by Product, 2015 and 2024
Figure 29: North America Strontium Market Value Share Analysis, by Application, 2015 and 2024
Figure 30: North America Strontium Market Value Share Analysis, by Country, 2015 and 2024
Figure 31: North America Strontium Content (Kilo Tons) in Product, 2015–2024
Figure 32: North America Strontium Market Attractiveness Analysis, by Product
Figure 33: North America Strontium Market Attractiveness Analysis, by Application
Figure 34: Latin America Strontium Market Revenue (US$ Mn) and Volume (Kilo Tons) Forecast, 2015–2024
Figure 35: Latin America Strontium Market Attractiveness Analysis, by Country
Figure 36: Latin America Strontium Market Value Share Analysis, by Product, 2015 and 2024
Figure 37: Latin America Strontium Market Value Share Analysis, by Application, 2015 and 2024
Figure 38: Latin America Strontium Market Value Share Analysis, by Country, 2015 and 2024
Figure 39: Latin America Strontium Content (Kilo Tons) in Product, 2015–2024
Figure 40: Latin America Strontium Market Attractiveness Analysis, by Product
Figure 41: Latin America Strontium Market Attractiveness Analysis, by Application
Figure 42: Europe Strontium Market Revenue (US$ Mn) and Volume (Kilo Tons) Forecast, 2015–2024
Figure 43: Europe Strontium Market Attractiveness Analysis, by Country
Figure 44: Europe Strontium Market Value Share Analysis, by Product, 2015 and 2024
Figure 45: Europe Strontium Market Value Share Analysis, by Application, 2015 and 2024
Figure 46: Europe Strontium Market Value Share Analysis, by Country, 2015 and 2024
Figure 47: Europe Strontium Content (Kilo Tons) in Product, 2015–2024
Figure 48: Europe Strontium Market Attractiveness Analysis, by Product
Figure 49: Europe Strontium Market Attractiveness Analysis, by Application
Figure 50: Asia Pacific Strontium Market Revenue (US$ Mn) and Volume (Kilo Tons) Forecast, 2015–2024
Figure 51: Asia Pacific Strontium Market Attractiveness Analysis, by Country
Figure 52: Asia Pacific Strontium Market Value Share Analysis, by Product, 2015 and 2024
Figure 53: Asia Pacific Strontium Market Value Share Analysis, by Application, 2015 and 2024
Figure 54: Asia Pacific Strontium Market Value Share Analysis, by Country, 2015 and 2024
Figure 55: Asia Pacific Strontium Content (Kilo Tons) in Product, 2015–2024
Figure 56: Asia Pacific Strontium Market Attractiveness Analysis, by Product
Figure 57: Asia Pacific Strontium Market Attractiveness Analysis, by Application
Figure 58: Middle East & Africa Strontium Market Revenue (US$ Mn) and Volume (Kilo Tons) Forecast, 2015–2024
Figure 59: Middle East & Africa Strontium Market Attractiveness Analysis, by Country
Figure 60: Middle East & Africa Strontium Market Value Share Analysis, by Product, 2015 and 2024
Figure 61: Middle East & Africa Strontium Market Value Share Analysis, by Application, 2015 and 2024
Figure 62: Middle East & Africa Strontium Market Value Share Analysis, by Country, 2015 and 2024
Figure 63: Middle East & Africa Strontium Content (Kilo Tons) in Product, 2015–2024
Figure 64: Middle East & Africa Strontium Market Attractiveness Analysis, by Product
Figure 65: Middle East & Africa Strontium Market Attractiveness Analysis, by Application
Figure 66: Global Strontium Market Share Analysis, by Company (2015)
Copyright © Transparency Market Research, Inc. All Rights reserved
Trust Online

Strontium Market Outlook, 2016-2024