
Reports
Reports
Small scale LNG terminals projects have in recent years gained more attention than large-scale terminals for multiple reasons. Saturated demand in large-scale LNG terminals, unmet need for the contractors in developed regions, notably in Europe and North America, and focus toward offloading the infrastructure cost of large-scale LNG terminals have invigorated industry investments in the small-scale LNG terminals market. Having said that, the drivers for both the sectors are similar.
Focus of various new entrants in the energy sector on small scale LNG terminals market stems from the relentless demand for cleaner and inexpensive fuel. The demand for energy security considerations in various countries and stringent implementation of legislations on mitigating the climate impacts of the power generation industry are spurring the prospects of the small-scale LNG terminals market. Stringent requirements put forth by governments in the EU and the U.S. for emissions from the power industry has also bolstered the demand for small scale LNG terminals market.
In developed as well as developing economies, intermittent renewable power generation have picked up enormous pace. The trend is generating huge impetus to the growth of the LNG small scale terminals market. Extensive efforts to introduce renewables in the overall energy mix. The growing demand for small scale LNG terminals in ships and heavy vehicles is a key trend bolstering the prospects of the market. Hence. This has been bolstering the need for expanding the LNG supply options, thereby engendering the opportunities for various market players. The need is remarkably evident in onshore LNG terminals.
The adoption of new strategies on pricing and contracts for LNG sales is working in favor of expansion of the small scale LNG terminals market. Players are increasingly focusing on securing long-term supply contract, which has become a key winning imperative. Moreover, LNG suppliers are focusing on reducing the LNG terminal CAPEX.
LNG is gradually emerging as one of the most preferred fuels globally and is being used by numerous end-user industries. One of the major advantages of utilizing LNG as a fuel is its clean burning nature which significantly lowers emissions as compared to other fossil fuels. However, one of the major constraints of utilizing natural gas as a fuel is its efficient transportation from supply to demand centers. Currently, there is a distinct mismatch in the global natural gas scenario, with major producers exporting a bulk of their production and major consumers being heavily reliant on imports. In such a scenario, there is a rising need for LNG infrastructure across the world since transporting natural gas in liquefied form is often cheaper and most cost effective than constructing pipelines. Although large scale LNG terminals have been preferably constructed across the world till date, the emergence of small demand centers for natural gas within small geographies is gradually shifting the focus towards miniaturizing LNG infrastructure.
The two primary forms of LNG infrastructure are liquefaction terminals and regasification terminals. By a thumb rule, exporters of natural gas in the form of LNG generally require liquefaction infrastructure while importers require regasification infrastructure. With technological advancements, divergence of such liquefaction and regasification terminals on the basis of type has also been observed. Both these terminals can currently be located in both onshore as well as offshore areas. The market for offshore LNG infrastructure is mostly comprised of small scale vessels such as FSRUs and FSLUs. With rapidly growing LNG consumption, the logistical constraints of transporting natural gas from regasification terminals located at ports to distant inland demand centers are increasing rapidly. In numerous cases, it is also highly infeasible to construct inland pipelines for transporting natural gas. In such cases, small scale LNG terminals are expected to be the most preferred form of infrastructure that would be installed in order to increase the volume of natural gas consumption.
For this report, only terminals with tank sizes lesser than 200,000 cubic meters and throughputs lower than 300,000 tons per annum have been considered. The demand for small scale LNG terminals to be expected globally within the forecast period have been taken as a function of various factors such as natural gas production and consumption, presence of stranded gas assets, demand from the industrial and power generation sectors, and growth and emergence of small scale inland demand. The weightage of these factors was analyzed on a regional as well as country level in order to arrive at the possible capacity additions that can be expected in the small scale LNG market within the forecast period. According to our analysis, a strong growth would be observed in the small scale LNG liquefaction terminals market over the forecast period. With the LNG bunkering and surface transportation industries driving capacity additions for small scale liquefaction terminals, year-on-year capacity additions are likely to increase steadily until 2027.
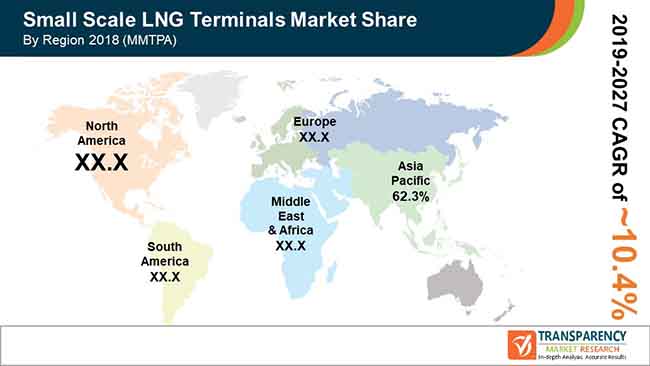
Regionally, Europe and Asia Pacific are likely to emerge as attractive markets for small scale LNG terminals within the forecast period. Countries such as China and Norway already have significantly developed small scale LNG infrastructure. Adoption of LNG as a fuel, especially by the heavy duty vehicles segment is expected to be a major driver for small scale LNG terminal construction across numerous geographies within the forecast period. Highly environment-conscious Europe and North America are expected to lead in the global market for small scale LNG terminals that are to be utilized for LNG bunkering in the future. Numerous attractive business models by market incumbents are expected to be introduced in the future. The small scale LNG market might witness numerous M&A activities in the future with technological expertise and project management competence being critical USPs for market incumbents. Other market niches such as converting fossil fuel users to LNG fuel and natural gas powered drilling are also likely to generate strong demand for small scale LNG infrastructure within the forecast period.
Small Scale LNG Terminals Market is projected to reach US$ 173.85 MMTPA by the end of 2027
Small Scale LNG Terminals Market is expected to grow at a CAGR of 10.4 % during 2019-2027
Adoption of LNG as a fuel, especially by the heavy duty vehicles segment is expected to be a major driver for small scale LNG terminal market
Asia Pacific is a more attractive region for vendors in the Small Scale LNG Terminals Market
Small Scale LNG Terminals Market Technology Analysis, end user, price category, distribution channel, and region
1. Executive Summary: Global Small Scale LNG Terminals Market
2. Market Overview
2.1. Market Segmentation
2.2. Market Definitions
2.3. Market Trends
2.4. Market Dynamics
2.4.1. Drivers
2.4.2. Restraints
2.4.3. Opportunities
2.5. Porter’s Five Forces Analysis
2.6. Value Chain Analysis
2.6.1. List of Service Providers
2.7. Regulatory Landscape
3. Global Small Scale LNG Terminals Market Analysis and Forecast, by Technology
3.1. Key Findings
3.2. Market Definitions
3.3. Global Small Scale LNG Terminals Market Volume (MMTPA), by Technology, 2018–2027
3.3.1. Liquefaction
3.3.2. Regasification
3.4. Global Small Scale LNG Terminals Market Attractiveness Analysis, by Technology
4. Global Small Scale LNG Terminals Market Analysis and Forecast, by Type
4.1. Key Findings
4.2. Market Definitions
4.3. Global Small Scale LNG Terminals Market Volume (MMTPA), by Type, 2018–2027
4.3.1. Onshore
4.3.2. Offshore
4.4. Global Small Scale LNG Terminals Market Attractiveness Analysis, by Type
5. Global Small Scale LNG Terminals Market Analysis and Forecast, by Region
5.1. Global Small Scale LNG Terminals Market Volume (MMTPA), by Region, 2018–2027
5.1.1. North America
5.1.2. Europe
5.1.3. Asia Pacific
5.1.4. South America
5.1.5. Middle East & Africa
5.2. Global Small Scale LNG Terminals Market Attractiveness Analysis, by Region
6. North America Small Scale LNG Terminals Market Analysis and Forecast
6.1. Key Findings
6.2. North America Small Scale LNG Terminals Market Volume (MMTPA), by Technology, 2018–2027
6.3. North America Small Scale LNG Terminals Market Volume (MMTPA), by Type, 2018–2027
6.4. North America Small Scale LNG Terminals Market Volume (MMTPA), by Country/Sub-region, 2018–2027
6.4.1. U.S.
6.4.2. Rest of North America
6.5. U.S. Small Scale LNG Terminals Market Volume (MMTPA), by Technology, 2018–2027
6.6. U.S. Small Scale LNG Terminals Market Volume (MMTPA), by Type, 2018–2027
6.7. Rest of North America Small Scale LNG Terminals Market Volume (MMTPA), by Technology, 2018–2027
6.8. Rest of North America Small Scale LNG Terminals Market Volume (MMTPA), by Type, 2018–2027
6.9. North America Small Scale LNG Terminals Market Share and Attractiveness Analysis, by Technology
6.10. North America Small Scale LNG Terminals Market Share and Attractiveness Analysis, by Type
6.11. North America Small Scale LNG Terminals Market Share and Attractiveness Analysis, by Country/Sub-region
7. Europe Small Scale LNG Terminals Market Analysis and Forecast
7.1. Key Findings
7.2. Europe Small Scale LNG Terminals Market Volume (MMTPA), by Technology, 2018–2027
7.3. Europe Small Scale LNG Terminals Market Volume (MMTPA), by Type, 2018–2027
7.4. Europe Small Scale LNG Terminals Market Volume (MMTPA), by Country/Sub-region, 2018–2027
7.4.1. Norway
7.4.2. Sweden
7.4.3. Rest of Europe
7.5. Norway Small Scale LNG Terminals Market Volume (MMTPA), by Technology, 2018–2027
7.6. Norway Small Scale LNG Terminals Market Volume (MMTPA), by Type, 2018–2027
7.7. Sweden Small Scale LNG Terminals Market Volume (MMTPA), by Technology, 2018–2027
7.8. Sweden Small Scale LNG Terminals Market Volume (MMTPA), by Type, 2018–2027
7.9. Rest of Europe Small Scale LNG Terminals Market Volume (MMTPA), by Technology, 2018–2027
7.10. Rest of Europe Small Scale LNG Terminals Market Volume (MMTPA), by Type, 2018–2027
7.11. Europe Small Scale LNG Terminals Market Share and Attractiveness Analysis, by Technology
7.12. Europe Small Scale LNG Terminals Market Share and Attractiveness Analysis, by Type
7.13. Europe Small Scale LNG Terminals Market Share and Attractiveness Analysis, by Country/Sub-region
8. Asia Pacific Small Scale LNG Terminals Market Analysis and Forecast
8.1. Key Findings
8.2. Asia Pacific Small Scale LNG Terminals Market Volume (MMTPA), by Technology, 2018–2027
8.3. Asia Pacific Small Scale LNG Terminals Market Volume (MMTPA), by Type, 2018–2027
8.4. Asia Pacific Small Scale LNG Terminals Market Volume (MMTPA), by Country/Sub-region, 2018–2027
8.4.1. China
8.4.2. Japan
8.4.3. Indonesia
8.4.4. Rest of Asia Pacific
8.5. China Small Scale LNG Terminals Market Volume (MMTPA), by Technology, 2018–2027
8.6. China Small Scale LNG Terminals Market Volume (MMTPA), by Type, 2018–2027
8.7. Japan Small Scale LNG Terminals Market Volume (MMTPA), by Technology, 2018–2027
8.8. Japan Small Scale LNG Terminals Market Volume (MMTPA), by Type, 2018–2027
8.9. Indonesia Small Scale LNG Terminals Market Volume (MMTPA), by Technology, 2018–2027
8.10. Indonesia Small Scale LNG Terminals Market Volume (MMTPA), by Type, 2018–2027
8.11. Rest of Asia Pacific Small Scale LNG Terminals Market Volume (MMTPA), by Technology, 2018–2027
8.12. Rest of Asia Pacific Small Scale LNG Terminals Market Volume (MMTPA), by Type, 2018–2027
8.13. Asia Pacific Small Scale LNG Terminals Market Share and Attractiveness Analysis, by Technology
8.14. Asia Pacific Small Scale LNG Terminals Market Share and Attractiveness Analysis, by Type
8.15. Asia Pacific Small Scale LNG Terminals Market Share and Attractiveness Analysis, by Country/Sub-region
9. South America Small Scale LNG Terminals Market Analysis and Forecast
9.1. Key Findings
9.2. South America Small Scale LNG Terminals Market Volume (MMTPA), by Technology, 2018–2027
9.3. South America Small Scale LNG Terminals Market Volume (MMTPA), by Type, 2018–2027
9.4. South America Small Scale LNG Terminals Market Volume (MMTPA), by Country/Sub-region, 2018–2027
9.4.1. Brazil
9.4.2. Rest of South America
9.5. Brazil Small Scale LNG Terminals Market Volume (MMTPA), by Technology, 2018–2027
9.6. Brazil Small Scale LNG Terminals Market Volume (MMTPA), by Type, 2018–2027
9.7. Rest of South America Small Scale LNG Terminals Market Volume (MMTPA), by Technology, 2018–2027
9.8. Rest of South America Small Scale LNG Terminals Market Volume (MMTPA), by Type, 2018–2027
9.9. South America Small Scale LNG Terminals Market Share and Attractiveness Analysis, by Technology
9.10. South America Small Scale LNG Terminals Market Share and Attractiveness Analysis, by Type
9.11. South America Small Scale LNG Terminals Market Share and Attractiveness Analysis, by Country/Sub-region
10. Middle East & Africa Small Scale LNG Terminals Market Analysis and Forecast
10.1. Key Findings
10.2. Middle East & Africa Small Scale LNG Terminals Market Volume (MMTPA), by Technology, 2018–2027
10.3. Middle East & Africa Small Scale LNG Terminals Market Volume (MMTPA), by Type, 2018–2027
10.4. Middle East & Africa Small Scale LNG Terminals Market Volume (MMTPA), by Country/Sub-region, 2018–2027
10.4.1. Qatar
10.4.2. Nigeria
10.4.3. Rest of Middle East & Africa
10.5. Qatar Small Scale LNG Terminals Market Volume (MMTPA), by Technology, 2018–2027
10.6. Qatar Small Scale LNG Terminals Market Volume (MMTPA), by Type, 2018–2027
10.7. Nigeria Small Scale LNG Terminals Market Volume (MMTPA), by Technology, 2018–2027
10.8. Nigeria Small Scale LNG Terminals Market Volume (MMTPA), by Type, 2018–2027
10.9. Rest of Middle East & Africa Small Scale LNG Terminals Market Volume (MMTPA), by Technology, 2018–2027
10.10. Rest of Middle East & Africa Small Scale LNG Terminals Market Volume (MMTPA), by Type, 2018–2027
10.11. Middle East & Africa Small Scale LNG Terminals Market Share and Attractiveness Analysis, by Technology
10.12. Middle East & Africa Small Scale LNG Terminals Market Share and Attractiveness Analysis, by Type
10.13. Middle East & Africa Small Scale LNG Terminals Market Share and Attractiveness Analysis, by Country/Sub-region
11. Competition Landscape
11.1. Competition Matrix, by Key Players
11.2. Global Small Scale LNG Terminals Market Share Analysis, by Company, 2018
11.3. Product Mapping
11.4. Company Profiles
11.4.1. Skangass AS
11.4.1.1. Company Overview
11.4.1.2. Financial Overview
11.4.1.3. Business strategy
11.4.1.4. Recent Developments
11.4.2. Emirates Liquefied Natural Gas (LNG) LLC
11.4.2.1. Company Overview
11.4.2.2. Financial Overview
11.4.2.3. Business strategy
11.4.2.4. Recent Developments
11.4.3. PT Donggi Senoro LNG
11.4.3.1. Company Overview
11.4.3.2. Financial Overview
11.4.3.3. Business strategy
11.4.4. Prometheus Energy Company
11.4.4.1. Company Overview
11.4.4.2. Financial Overview
11.4.4.3. Business strategy
11.4.4.4. Recent Developments
11.4.5. Petroliam Nasional Berhad (PETRONAS)
11.4.5.1. Company Overview
11.4.5.2. Financial Overview
11.4.5.3. Business strategy
11.4.5.4. Recent Developments
11.4.6. Linde AG
11.4.6.1. Company Overview
11.4.6.2. Financial Overview
11.4.6.3. Business strategy
11.4.6.4. Recent Developments
11.4.7. Santos Ltd
11.4.7.1. Company Overview
11.4.7.2. Financial Overview
11.4.7.3. Business strategy
11.4.7.4. Recent Developments
11.4.8. Plum Energy, LLC
11.4.8.1. Company Overview
11.4.8.2. Financial Overview
11.4.8.3. Business strategy
11.4.8.4. Recent Developments
11.4.9. EcoEléctrica Inc.
11.4.9.1. Company Overview
11.4.9.2. Financial Overview
11.4.9.3. Business strategy
11.4.9.4. Recent Developments
11.4.10. Nippon Gas Co., Ltd.
11.4.10.1. Company Overview
11.4.10.2. Financial Overview
11.4.10.3. Business strategy
11.4.10.4. Recent Developments
12. Primary Research - Key Insights
13. Appendix
13.1. Research Methodology and Assumptions
List of Tables
Table 1 Global Small-Scale LNG Terminals Market: Snapshot
Table 2 Drivers of Small Scale LNG Terminals Market: Impact Analysis
Table 3 Restraints of Small Scale LNG Terminals Market: Impact Analysis
Table 4 Opportunities of Small Scale LNG Terminals Market: Impact Analysis
Table 5 Global Small Scale Onshore Liquefaction Terminals Market Capacity and Forecast, by Region, 2018 - 2027 (MMTPA)
Table 6 Global Small Scale Offshore Liquefaction Terminals Market Capacity and Forecast, by Region, 2018 - 2027 (MMTPA)
Table 7 Global Small Scale Liquefaction Terminals Market Capacity and Forecast, by Region, 2018 - 2027 (MMTPA)
Table 8 Global Small Scale Onshore Regasification Terminals Market Capacity and Forecast, by Region, 2018 - 2027 (MMTPA)
Table 9 Global Small Scale Offshore Regasification Terminals Market Capacity and Forecast, by Region, 2018 - 2027 (MMTPA)
Table 10 Global Small Scale Regasification Terminals Market Capacity and Forecast, by Region, 2018 - 2027 (MMTPA)
Table 11 U.S. LNG Liquefaction Terminals Market Capacity and Forecast, by Type, 2018 - 2027 (MMTPA)
Table 12 U.S. LNG Regasification Terminals Market Capacity and Forecast, by Type, 2018 - 2027 (MMTPA)
Table 13 U.S. Small Scale LNG Terminals Market Capacity and Forecast, by Technology, 2018 - 2027 (MMTPA)
Table 14 Rest of North America LNG Liquefaction Terminals Market Capacity and Forecast, by Type, 2018 - 2027 (MMTPA)
Table 15 Rest of North America LNG Regasification Terminals Market Capacity and Forecast, by Type, 2018 - 2027 (MMTPA)
Table 16 Rest of North America Small Scale LNG Terminals Market Capacity and Forecast, by Technology, 2018 - 2027 (MMTPA)
Table 17 North America Small Scale LNG Terminals Market Capacity and Forecast, by Technology, 2018 - 2027 (MMTPA)
Table 18 North America Small Scale LNG Liquefaction Terminals Market Capacity and Forecast, by Technology, 2018 - 2027 (MMTPA)
Table 19 North America Small Scale LNG Regasification Terminals Market Capacity and Forecast, by Technology, 2018 - 2027 (MMTPA)
Table 20 Norway LNG Liquefaction Terminals Market Capacity and Forecast, by Type, 2018 - 2027 (MMTPA)
Table 21 Norway LNG Regasification Terminals Market Capacity and Forecast, by Type, 2018 - 2027 (MMTPA)
Table 22 Norway Small Scale LNG Terminals Market Capacity and Forecast, by Technology, 2018 - 2027 (MMTPA)
Table 23 Spain LNG Liquefaction Terminals Market Capacity and Forecast, by Type, 2018 - 2027 (MMTPA)
Table 24 Spain LNG Regasification Terminals Market Capacity and Forecast, by Type, 2018 - 2027 (MMTPA)
Table 25 Spain Small Scale LNG Terminals Market Capacity and Forecast, by Technology, 2018 - 2027 (MMTPA)
Table 26 Rest of Europe LNG Liquefaction Terminals Market Capacity and Forecast, by Type, 2018 - 2027 (MMTPA)
Table 27 Rest of Europe LNG Regasification Terminals Market Capacity and Forecast, by Type, 2018 - 2027 (MMTPA)
Table 28 Rest of Europe Small Scale LNG Terminals Market Capacity and Forecast, by Technology, 2018 - 2027 (MMTPA)
Table 29 Europe Small Scale LNG Terminals Market Capacity and Forecast, by Technology, 2018 - 2027 (MMTPA)
Table 30 Europe Small Scale LNG Liquefaction Terminals Market Capacity and Forecast, by Technology, 2018 - 2027 (MMTPA)
Table 31 Europe Small Scale LNG Regasification Terminals Market Capacity and Forecast, by Technology, 2018 - 2027 (MMTPA)
Table 32 China LNG Liquefaction Terminals Market Capacity and Forecast, by Type, 2018 - 2027 (MMTPA)
Table 33 China LNG Regasification Terminals Market Capacity and Forecast, by Type, 2018 - 2027 (MMTPA)
Table 34 China Small Scale LNG Terminals Market Capacity and Forecast, by Technology, 2018 - 2027 (MMTPA)
Table 35 Japan LNG Liquefaction Terminals Market Capacity and Forecast, by Type, 2018 - 2027 (MMTPA)
Table 36 Japan LNG Regasification Terminals Market Capacity and Forecast, by Type, 2018 - 2027 (MMTPA)
Table 37 Japan Small Scale LNG Terminals Market Capacity and Forecast, by Technology, 2018 - 2027 (MMTPA)
Table 38 Indonesia LNG Liquefaction Terminals Market Capacity and Forecast, by Type, 2018 - 2027 (MMTPA)
Table 39 Indonesia LNG Regasification Terminals Market Capacity and Forecast, by Type, 2018 - 2027 (MMTPA)
Table 40 Indonesia Small Scale LNG Terminals Market Capacity and Forecast, by Technology, 2018 - 2027 (MMTPA)
Table 41 Rest of Asia Pacific LNG Liquefaction Terminals Market Capacity and Forecast, by Type, 2018 - 2027 (MMTPA)
Table 42 Rest of Asia Pacific LNG Regasification Terminals Market Capacity and Forecast, by Type, 2018 - 2027 (MMTPA)
Table 43 Rest of Asia Pacific Small Scale LNG Terminals Market Capacity and Forecast, by Technology, 2018 - 2027 (MMTPA)
Table 44 Asia Pacific Small Scale LNG Terminals Market Capacity and Forecast, by Technology, 2018 - 2027 (MMTPA)
Table 45 Asia Pacific Small Scale LNG Liquefaction Terminals Market Capacity and Forecast, by Type, 2018 - 2027 (MMTPA)
Table 46 Asia Pacific Small Scale LNG Regasification Terminals Market Capacity and Forecast, by Type, 2018 - 2027 (MMTPA)
Table 47 Brazil LNG Liquefaction Terminals Market Capacity and Forecast, by Type, 2018 - 2027 (MMTPA)
Table 48 Brazil LNG Regasification Terminals Market Capacity and Forecast, by Type, 2018 - 2027 (MMTPA)
Table 49 Brazil Small Scale LNG Terminals Market Capacity and Forecast, by Technology, 2018 - 2027 (MMTPA)
Table 50 Rest of South America LNG Liquefaction Terminals Market Capacity and Forecast, by Type, 2018 - 2027 (MMTPA)
Table 51 Rest of South America LNG Regasification Terminals Market Capacity and Forecast, by Type, 2018 - 2027 (MMTPA)
Table 52 Rest of South America Small Scale LNG Terminals Market Capacity and Forecast, by Technology, 2018 - 2027 (MMTPA)
Table 53 South America Small Scale LNG Terminals Market Capacity and Forecast, by Technology, 2018 - 2027 (MMTPA)
Table 54 South America Small Scale LNG Liquefaction Terminals Market Capacity and Forecast, by Technology, 2018 - 2027 (MMTPA)
Table 55 South America Small Scale LNG Regasification Terminals Market Capacity and Forecast, by Technology, 2018 - 2027 (MMTPA)
Table 56 Qatar LNG Liquefaction Terminals Market Capacity and Forecast, by Type, 2018 - 2027 (MMTPA)
Table 57 Qatar LNG Regasification Terminals Market Capacity and Forecast, by Type, 2018 - 2027 (MMTPA)
Table 58 Qatar Small Scale LNG Terminals Market Capacity and Forecast, by Technology, 2018 - 2027 (MMTPA)
Table 59 Nigeria LNG Liquefaction Terminals Market Capacity and Forecast, by Type, 2018 - 2027 (MMTPA)
Table 60 Nigeria LNG Regasification Terminals Market Capacity and Forecast, by Type, 2018 - 2027 (MMTPA)
Table 61 Nigeria Small Scale LNG Terminals Market Capacity and Forecast, by Technology, 2018 - 2027 (MMTPA)
Table 62 Rest of Middle East and Africa LNG Liquefaction Terminals Market Capacity and Forecast, by Type, 2018 - 2027 (MMTPA)
Table 63 Rest of Middle East and Africa LNG Regasification Terminals Market Capacity and Forecast, by Type, 2018 - 2027 (MMTPA)
Table 64 Rest of Middle East and Africa Small Scale LNG Terminals Market Capacity and Forecast, by Technology, 2018 - 2027 (MMTPA)
Table 65 Middle East and Africa Small Scale LNG Terminals Market Capacity and Forecast, by Technology, 2018 - 2027 (MMTPA)
Table 66 Middle East and Africa Small Scale LNG Liquefaction Terminals Market Capacity and Forecast, by Technology, 2018 - 2027 (MMTPA)
Table 67 Middle East and Africa Small Scale LNG Regasification Terminals Market Capacity and Forecast, by Technology, 2018 - 2027 (MMTPA)
List of Figures
FIG. 1 Small Scale LNG Terminals Market: Market segmentation
FIG. 2 Global Small-Scale LNG Terminals Market, By Capacity, 2018 – 2027 (MMTPA)
FIG. 3 Value chain analysis of Small Scale LNG Terminals Market
FIG. 4 Global Offshore Oil and Gas Production Estimates and Forecast, by Region, 2018 – 2027 (Million Barrels/ Day)
FIG. 5 Porter’s five forces analysis: LNG Terminals Market
FIG. 5 Market Attractiveness Analysis of Global Small Scale LNG Terminals Market, by Region, 2018
FIG. 6 Global Small Scale LNG Terminals Market Estimates and Forecast, by Technology, 2018 & 2027 (MMTPA)
FIG. 7 Global Small Scale Liquefaction Terminals Capacity, 2018 – 2027 (MMTPA)
FIG. 8 Global Small Scale Liquefaction Terminals Capacity, 2018 – 2027 (Y-o-Y Growth) (MMTPA)
FIG. 9 Global Small Scale LNG Liquefaction Terminals Market Estimates and Forecast, by Type, 2018 & 2027 (MMTPA)
FIG. 10 Global Small Scale Onshore Liquefaction Terminals Capacity, 2018 – 2027 (MMTPA)
FIG. 11 Global Small Scale Onshore Liquefaction Terminals Capacity, 2018 – 2027 (Y-o-Y Growth) (MMTPA)
FIG. 12 Global Small Scale Onshore Liquefaction Terminals Market Capacity and Forecast, by Region, 2018 - 2027 (MMTPA as %)
FIG. 13 Global Small Scale Offshore Liquefaction Terminals Capacity, 2018 – 2027 (MMTPA)
FIG. 14 Global Small Scale Offshore Liquefaction Terminals Capacity, 2018 – 2027 (Y-o-Y Growth) (MMTPA)
FIG. 15 Global Small Scale Offshore Liquefaction Terminals Market Capacity and Forecast, by Region, 2018 - 2027 (MMTPA as %)
FIG. 16 Global Small Scale Liquefaction Terminals Market Capacity and Forecast, by Region, 2018 - 2027 (MMTPA as %)
FIG. 17 Global Small Scale Regasification Terminals Capacity, 2018 – 2027 (MMTPA)
FIG. 18 Global Small Scale Regasification Terminals Capacity, 2018 – 2027 (Y-o-Y Growth) (MMTPA)
FIG. 19 Global Small Scale LNG Regasification Terminals Market Estimates and Forecast, by Type, 2018 & 2027 (MMTPA)
FIG. 20 Global Small Scale Onshore Regasification Terminals Capacity, 2018 – 2027 (MMTPA)
FIG. 21 Global Small Scale Onshore Regasification Terminals Capacity, 2018 – 2027 (Y-o-Y Growth) (MMTPA)
FIG. 22 Global Small Scale Onshore Regasification Terminals Market Capacity and Forecast, by Region, 2018 - 2027 (MMTPA as %)
FIG. 23 Global Small Scale Offshore Regasification Terminals Capacity, 2018 – 2027 (MMTPA)
FIG. 24 Global Small Scale Offshore Regasification Terminals Capacity, 2018 – 2027 (Y-o-Y Growth) (MMTPA)
FIG. 25 Global Small Scale Offshore Regasification Terminals Market Capacity and Forecast, by Region, 2018 - 2027 (MMTPA as %)
FIG. 26 Global Small Scale Regasification Terminals Market Capacity and Forecast, by Region, 2018 - 2027 (MMTPA as %)
FIG. 27 Global Small Scale LNG Terminals Market Estimates and Forecast, by Region, 2018 & 2027 (MMTPA)
FIG. 28 North America Small Scale LNG Terminals Market Estimates and Forecast, by Country, 2018 & 2027 (MMTPA)
FIG. 29 North America Small Scale LNG Terminals Market Capacity, 2018 – 2027 (MMTPA)
FIG. 30 North America Small Scale LNG Terminals Market Capacity, 2018 – 2027 (Y-o-Y Growth) (MMTPA)
FIG. 31 U.S. Small Scale LNG Terminals Market Capacity, 2018 – 2027 (MMTPA)
FIG. 32 U.S. Small Scale LNG Terminals Market Capacity, 2018 – 2027 (Y-o-Y Growth) (MMTPA)
FIG. 33 U.S. LNG Liquefaction Terminals Market Capacity and Forecast, by Type, 2018 - 2027 (MMTPA as %)
FIG. 34 The U.S. LNG Regasification Terminals Market Capacity and Forecast, by Type, 2018 - 2027 (MMTPA as %)
FIG. 35 U.S. Small Scale LNG Terminals Market Capacity and Forecast, by Technology, 2018 - 2027 (MMTPA as %)
FIG. 36 Rest of North America Small Scale LNG Terminals Market Capacity, 2018 – 2027 (MMTPA)
FIG. 37 Rest of North America Small Scale LNG Terminals Market Capacity, 2018 – 2027 (Y-o-Y Growth) (MMTPA)
FIG. 38 Rest of North America LNG Liquefaction Terminals Market Capacity and Forecast, by Type, 2018 - 2027 (MMTPA as %)
FIG. 39 Rest of North America LNG Regasification Terminals Market Capacity and Forecast, by Type, 2018 - 2027 (MMTPA as %)
FIG. 40 Rest of North America Small Scale LNG Terminals Market Capacity and Forecast, by Technology, 2018 - 2027 (MMTPA as %)
FIG. 41 North America Small Scale LNG Terminals Market Capacity and Forecast, by Technology, 2018 - 2027 (MMTPA as %)
FIG. 42 North America Small Scale LNG Liquefaction Terminals Market Capacity and Forecast, by Type, 2018 - 2027 (MMTPA as %)
FIG. 43 North America Small Scale LNG Regasification Terminals Market Capacity and Forecast, by Type, 2018 - 2027 (MMTPA as %)
FIG. 44 Europe Small Scale LNG Terminals Market Estimates and Forecast, by Country, 2018 & 2027 (MMTPA)
FIG. 45 Europe Small Scale LNG Terminals Market Capacity, 2018 – 2027 (MMTPA)
FIG. 46 Europe Small Scale LNG Terminals Market Capacity, 2018 – 2027 (Y-o-Y Growth) (MMTPA)
FIG. 47 Norway Small Scale LNG Terminals Market Capacity, 2018 – 2027 (MMTPA)
FIG. 48 Norway Small Scale LNG Terminals Market Capacity, 2018 – 2027 (Y-o-Y Growth) (MMTPA)
FIG. 49 Norway LNG Liquefaction Terminals Market Capacity and Forecast, by Type, 2018 - 2027 (MMTPA as %)
FIG. 50 Norway LNG Regasification Terminals Market Capacity and Forecast, by Type, 2018 - 2027 (MMTPA as %)
FIG. 51 Norway Small Scale LNG Terminals Market Capacity and Forecast, by Technology, 2018 - 2027 (MMTPA as %)
FIG. 52 Spain Small Scale LNG Terminals Market Capacity, 2018 – 2027 (MMTPA)
FIG. 53 Spain Small Scale LNG Terminals Market Capacity, 2018 – 2027 (Y-o-Y Growth) (MMTPA)
FIG. 54 Spain LNG Liquefaction Terminals Market Capacity and Forecast, by Type, 2018 - 2027 (MMTPA as %)
FIG. 55 Spain LNG Regasification Terminals Market Capacity and Forecast, by Type, 2018 - 2027 (MMTPA as %)
FIG. 56 Spain Small Scale LNG Terminals Market Capacity and Forecast, by Technology, 2018 - 2027 (MMTPA as %)
FIG. 57 Rest of Europe Small Scale LNG Terminals Market Capacity, 2018 – 2027 (MMTPA)
FIG. 58 Rest of Europe Small Scale LNG Terminals Market Capacity, 2018 – 2027 (Y-o-Y Growth) (MMTPA)
FIG. 59 Rest of Europe LNG Liquefaction Terminals Market Capacity and Forecast, by Type, 2018 - 2027 (MMTPA as %)
FIG. 60 Rest of Europe LNG Regasification Terminals Market Capacity and Forecast, by Type, 2018 - 2027 (MMTPA as %)
FIG. 61 Rest of Europe Small Scale LNG Terminals Market Capacity and Forecast, by Technology, 2018 - 2027 (MMTPA as %)
FIG. 62 Europe Small Scale LNG Terminals Market Capacity and Forecast, by Technology, 2018 - 2027 (MMTPA as %)
FIG. 63 Europe Small Scale LNG Liquefaction Terminals Market Capacity and Forecast, by Type, 2018 - 2027 (MMTPA as %)
FIG. 64 Europe Small Scale LNG Regasification Terminals Market Capacity and Forecast, by Type, 2018 - 2027 (MMTPA as %)
FIG. 65 Asia Pacific Small Scale LNG Terminals Market Estimates and Forecast, by Country, 2018 & 2027 (MMTPA)
FIG. 66 Asia Pacific Small Scale LNG Terminals Market Capacity, 2018 – 2027 (MMTPA)
FIG. 67 Asia Pacific Small Scale LNG Terminals Market Capacity, 2018 – 2027 (Y-o-Y Growth) (MMTPA)
FIG. 68 China Small Scale LNG Terminals Market Capacity, 2018 – 2027 (MMTPA)
FIG. 69 China Small Scale LNG Terminals Market Capacity, 2018 – 2027 (Y-o-Y Growth) (MMTPA)
FIG. 70 China LNG Liquefaction Terminals Market Capacity and Forecast, by Type, 2018 - 2027 (MMTPA as %)
FIG. 71 China LNG Regasification Terminals Market Capacity and Forecast, by Type, 2018 - 2027 (MMTPA as %)
FIG. 72 China Small Scale LNG Terminals Market Capacity and Forecast, by Technology, 2018 - 2027 (MMTPA as %)
FIG. 73 Japan Small Scale LNG Terminals Market Capacity, 2018 – 2027 (MMTPA)
FIG. 74 Japan Small Scale LNG Terminals Market Capacity, 2018 – 2027 (Y-o-Y Growth) (MMTPA)
FIG. 75 Japan LNG Liquefaction Terminals Market Capacity and Forecast, by Type, 2018 - 2027 (MMTPA as %)
FIG. 76 Japan LNG Regasification Terminals Market Capacity and Forecast, by Type, 2018 - 2027 (MMTPA as %)
FIG. 77 Japan Small Scale LNG Terminals Market Capacity and Forecast, by Technology, 2018 - 2027 (MMTPA as %)
FIG. 78 Indonesia Small Scale LNG Terminals Market Capacity, 2018 – 2027 (MMTPA)
FIG. 79 Indonesia Small Scale LNG Terminals Market Capacity, 2018 – 2027 (Y-o-Y Growth) (MMTPA)
FIG. 80 Indonesia LNG Liquefaction Terminals Market Capacity and Forecast, by Type, 2018 - 2027 (MMTPA as %)
FIG. 81 Indonesia LNG Regasification Terminals Market Capacity and Forecast, by Type, 2018 - 2027 (MMTPA as %)
FIG. 82 Indonesia Small Scale LNG Terminals Market Capacity and Forecast, by Technology, 2018 - 2027 (MMTPA as %)
FIG. 83 Rest of Asia Pacific Small Scale LNG Terminals Market Capacity, 2018 – 2027 (MMTPA)
FIG. 84 Rest of Asia Pacific Small Scale LNG Terminals Market Capacity, 2018 – 2027 (Y-o-Y Growth) (MMTPA)
FIG. 85 Rest of Asia Pacific LNG Liquefaction Terminals Market Capacity and Forecast, by Type, 2018 - 2027 (MMTPA as %)
FIG. 86 Rest of Asia Pacific LNG Regasification Terminals Market Capacity and Forecast, by Type, 2018 - 2027 (MMTPA as %)
FIG. 87 Rest of Asia Pacific Small Scale LNG Terminals Market Capacity and Forecast, by Technology, 2018 - 2027 (MMTPA as %)
FIG. 88 Asia Pacific Small Scale LNG Terminals Market Capacity and Forecast, by Technology, 2018 - 2027 (MMTPA as %)
FIG. 89 Asia Pacific Small Scale LNG Liquefaction Terminals Market Capacity and Forecast, by Type, 2018 - 2027 (MMTPA as %)
FIG. 90 Asia Pacific Small Scale LNG Regasification Terminals Market Capacity and Forecast, by Type, 2018 - 2027 (MMTPA as %)
FIG. 91 South America Small Scale LNG Terminals Market Estimates and Forecast, by Country, 2018 & 2027 (MMTPA)
FIG. 92 South America Small Scale LNG Terminals Market Capacity, 2018 – 2027 (MMTPA)
FIG. 93 South America Small Scale LNG Terminals Market Capacity, 2018 – 2027 (Y-o-Y Growth) (MMTPA)
FIG. 94 Brazil Small Scale LNG Terminals Market Capacity, 2018 – 2027 (MMTPA)
FIG. 95 Brazil Small Scale LNG Terminals Market Capacity, 2018 – 2027 (Y-o-Y Growth) (MMTPA)
FIG. 96 Brazil LNG Liquefaction Terminals Market Capacity and Forecast, by Type, 2018 - 2027 (MMTPA as %)
FIG. 97 Brazil LNG Regasification Terminals Market Capacity and Forecast, by Type, 2018 - 2027 (MMTPA as %)
FIG. 98 Brazil Small Scale LNG Terminals Market Capacity and Forecast, by Technology, 2018 - 2027 (MMTPA as %)
FIG. 99 Rest of South America Small Scale LNG Terminals Market Capacity, 2018 – 2027 (MMTPA)
FIG. 100 Rest of South America Small Scale LNG Terminals Market Capacity, 2018 – 2027 (Y-o-Y Growth) (MMTPA)
FIG. 101 Rest of South America LNG Liquefaction Terminals Market Capacity and Forecast, by Type, 2018 - 2027 (MMTPA as %)
FIG. 102 Rest of South America LNG Regasification Terminals Market Capacity and Forecast, by Type, 2018 - 2027 (MMTPA as %)
FIG. 103 Rest of South America Small Scale LNG Terminals Market Capacity and Forecast, by Technology, 2018 - 2027 (MMTPA as %)
FIG. 104 South America Small Scale LNG Terminals Market Capacity and Forecast, by Technology, 2018 - 2027 (MMTPA as %)
FIG. 105 South America Small Scale LNG Liquefaction Terminals Market Capacity and Forecast, by Type, 2018 - 2027 (MMTPA as %)
FIG. 106 South America Small Scale LNG Regasification Terminals Market Capacity and Forecast, by Type, 2018 - 2027 (MMTPA as %)
FIG. 107 Middle East and Africa Small Scale LNG Terminals Market Estimates and Forecast, by Country, 2018 & 2027 (MMTPA)
FIG. 108 Middle East and Africa Small Scale LNG Terminals Market Capacity, 2018 – 2027 (MMTPA)
FIG. 109 Middle East and Africa Small Scale LNG Terminals Market Capacity, 2018 – 2027 (Y-o-Y Growth) (MMTPA)
FIG. 110 Qatar Small Scale LNG Terminals Market Capacity, 2018 – 2027 (MMTPA)
FIG. 111 Qatar Small Scale LNG Terminals Market Capacity, 2018 – 2027 (Y-o-Y Growth) (MMTPA)
FIG. 112 Qatar LNG Liquefaction Terminals Market Capacity and Forecast, by Type, 2018 - 2027 (MMTPA as %)
FIG. 113 Qatar Small Scale LNG Terminals Market Capacity and Forecast, by Technology, 2018 - 2027 (MMTPA as %)
FIG. 114 Nigeria Small Scale LNG Terminals Market Capacity, 2018 – 2027 (MMTPA)
FIG. 115 Nigeria Small Scale LNG Terminals Market Capacity, 2018 – 2027 (Y-o-Y Growth) (MMTPA)
FIG. 116 Nigeria LNG Liquefaction Terminals Market Capacity and Forecast, by Type, 2018 - 2027 (MMTPA as %)
FIG. 117 Nigeria LNG Regasification Terminals Market Capacity and Forecast, by Type, 2018 - 2027 (MMTPA as %)
FIG. 118 Nigeria Small Scale LNG Terminals Market Capacity and Forecast, by Technology, 2018 - 2027 (MMTPA as %)
FIG. 119 Rest of Middle East and Africa Small Scale LNG Terminals Market Capacity, 2018 – 2027 (MMTPA)
FIG. 120 Rest of Middle East and Africa Small Scale LNG Terminals Market Capacity, 2018 – 2027 (Y-o-Y Growth) (MMTPA)
FIG. 121 Rest of Middle East and Africa LNG Liquefaction Terminals Market Capacity and Forecast, by Type, 2018 - 2027 (MMTPA as %)
FIG. 122 Rest of Middle East and Africa LNG Regasification Terminals Market Capacity and Forecast, by Type, 2018 - 2027 (MMTPA as %)
FIG. 123 Rest of Middle East and Africa Small Scale LNG Terminals Market Capacity and Forecast, by Technology, 2018 - 2027 (MMTPA as %)
FIG. 124 Middle East and Africa Small Scale LNG Terminals Market Capacity and Forecast, by Technology, 2018 - 2027 (MMTPA as %)
FIG. 125 Middle East and Africa Small Scale LNG Liquefaction Terminals Market Capacity and Forecast, by Type, 2018 - 2027 (MMTPA as %)
FIG. 126 Middle East and Africa Small Scale LNG Regasification Terminals Market Capacity and Forecast, by Type, 2018 - 2027 (MMTPA as %)
Copyright © Transparency Market Research, Inc. All Rights reserved
Trust Online

Small Scale LNG Terminals Market