
Reports
Reports
Analysts’ Viewpoint on Sand Control Systems Market Scenario
The market for sand control systems is expanding due to rise in shale development activities and increased production from new wells. Growth in population, emerging economies across the world, and rise in demand for petroleum products in developing countries are key factors that are expected to increase the exploration and production activities in the oil & gas industry. Therefore, it has become necessary for oil producers to recover oil & gas from wells efficiently and achieve maximum yield. This can be achieved with the help of sand control systems. Sand control equipment limits the sand ingress into the oil wells, which hinders the oil recovery. Rise in offshore production and exploration operations is anticipated to boost the demand for sand control solutions. Leading oilfield service providers are focusing on new developments in sand control solutions to gain more revenue opportunities.
Sand production is a phenomenon witnessed during the production of hydrocarbons from oil & gas reservoirs. Sand accumulated from wells obstructs the production process and hampers the extraction of natural gas and oil, which significantly affects field economics. Geological formations that are shallow with very low adherence to hold the individual sand grains together are normally prone to sand production. Areas at very high depths may also encounter sand production. During the process, the sand grains around the cavity deposit and accumulate on production equipment, which hinders the efficient production of the well. Sand control systems and methods minimize the production of sand from wells and ensure smoother oil production. There are various techniques to control and inhibit the production of sand from wells. Ongoing research and development activities for enhanced oil recovery have proven to be an important factor in the growth in demand for sand control solutions.
The number of rig counts has declined in the last few years due to the global crude oil crisis. This has impacted drilling & exploration activities. Operating rigs in global oil fields are becoming more and more efficient to offset the challenging market environment. This is due to the improvement in drilling and sand control techniques, longer laterals, and more fracking stages. Enhanced oil production is a process of extracting oil that cannot be retrieved through primary or secondary oil recovery techniques. Therefore, it is also known as tertiary recovery. Oil producers across the globe are expected to incorporate advanced manufacturing practices such as sand control techniques to optimize rig operations. This, in turn, is estimated to fuel the future market demand for sand control systems and equipment to offset the declining crude oil prices.
Reserves in a large number of onshore oilfields are depleting. Hence, oil and gas exploration companies are exploring options to tap into offshore deepwater reserves. Offshore reserves are highly prone to sand contamination. Special sand control systems have been developed for offshore environments, which help exploration and production companies to carry out drilling processes with ease. Increased costs, deeper water depths, and complex reservoir characteristics have led oil well operators to opt for sand control systems as a preventive, rather than remedial measure in order to avoid flow assurance problems. Continuous advancements in sand control systems introduced by major players are enabling oil producers to counter the deep water challenges. This, in turn, is expected to drive the sand control systems market in the next few years.
Many countries such as Venezuela, Saudi Arabia, Libya, and Iraq have huge oil reserves that are unexplored. These countries have prominent oil reserves that can produce and cater to the ever-increasing demand for petroleum products. These proven oil reserves are likely to augment drilling and completion activities for oil exploration in the near future. This, in turn, is expected to create potential growth opportunities for oilfield service providers and sand control equipment manufacturing companies.
Existence of unexplored and untapped oil reserves offers opportunities for oil companies to explore and produce oil frequently. Increase in demand for petroleum products in developing countries is influencing the rate of drilling activities. New crude oil and natural gas discoveries and high potential reserves create opportunities for companies operating in the sand control systems market. These new oil & gas discoveries require sand control systems to manage and prevent wells from producing sand. Therefore, newly discovered and potential oil & gas reserves are estimated to create future market demand in sand control systems market.
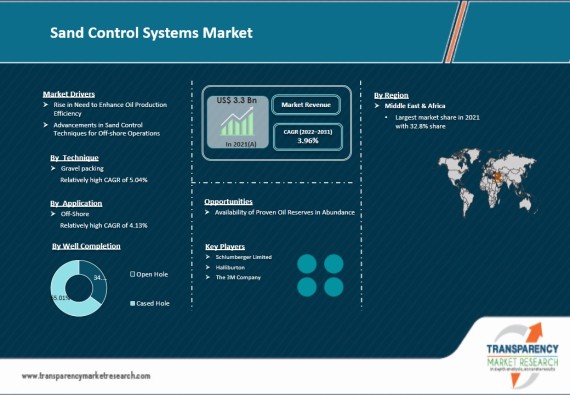
Based on technique, the global sand control systems market has been segmented into gravel packing, stand alone screens, resin coated gravel, plastic consolidation, and others. Gravel packing is the most widely employed technique for controlling sand. The gravel packing segment dominated the global sand control systems market and held 43.9% share in 2021. The gravel packing technique creates a down-hole filter that restricts the entry and production of sand in the well. It is a widely used technique due to its flexibility. Any type of well of any deviation can be easily accommodated and gravel packed. Large numbers of petroleum companies are using this sand control technique in several wells across the globe.
In terms of application, the global sand control systems market has been bifurcated into onshore and offshore. The onshore segment held 59.1% share of the global sand control systems market in 2021. The segment is expected to maintain its leading position in the market during the forecast period. Offshore exploration and drilling activities are also increasing across the globe. Offshore drilling usually costs higher than onshore drilling. Sand control is used at the beginning of drilling itself to ensure no production of sand in offshore drilling.
Based on well completion, the global sand control systems market has been segmented into open hole and cased hole. The cased hole segment held the major share of 65.0% in 2021 and was the largest revenue generator in sand control systems market. The segment is expected to maintain its leading position in the market during the forecast period. Cased hole wells are properly cemented, which inherently reduces the inflow of sand, water, gas, and other formation fluids. Therefore, it requires lesser sand control. Gravel packing and stand-alone screens are commonly employed techniques for sand control in open hole well completions. The open hole well segment in offshore and deep water explorations is expected to witness rapid growth in global sand control market during the forecast period.
In terms of value, Middle East & Africa held 32.8% share of the global sand control systems market in 2021. It is expected to dominate the global sand control systems market during the forecast period. Middle East & Africa is the largest producer of crude oil in the world. This factor is driving the sand control systems market in the region. The sand control systems market in Asia Pacific is estimated to grow at a considerable pace during the forecast period. The region is the fastest growing market for sand control systems. Growth in population and rapid industrialization in growing economies, such as India and China, is boosting the demand for fuel in the region. Increase in number of drilling and completion activities, especially in Australia, Indonesia, Malaysia, and Myanmar, is likely to boost the market in the region during the forecast period.
The global sand control systems market is partially consolidated, with a few large-scale oilfield service-providing companies that control majority of the share. Most of the companies are investing significantly in comprehensive research and development activities, primarily to develop advanced systems. Expansion of product portfolios and mergers and acquisitions are prominent strategies adopted by key players. Key oilfield service providers cater to the leading oil producers who are extensively involved in a large number of drilling and completion activities carried out worldwide. Schlumberger Limited, Halliburton Company, Baker Hughes, Inc., and Weatherford International are the leading players in sand control systems market.
Each of these players has been profiled in the global sand control systems market report based on parameters such as company overview, financial overview, business strategies, product portfolio, business segments, and recent developments.
|
Attribute |
Detail |
|
Market Size Value in 2021 |
US$ 3.3 Bn |
|
Market Forecast Value in 2031 |
US$ 4.9 Bn |
|
Growth Rate (CAGR) |
3.96% |
|
Forecast Period |
2022–2031 |
|
Historical Data Available for |
2020 |
|
Quantitative Units |
US$ Bn for Value |
|
Market Analysis |
It includes cross segment analysis at global as well as country level. Furthermore, qualitative analysis includes drivers, restraints, opportunities, key trends, Porter’s Five Forces analysis, value chain analysis, and key trend analysis. |
|
Competition Landscape |
|
|
Format |
Electronic (PDF) + Excel |
|
Market Segmentation |
|
|
Regions Covered |
|
|
Countries Covered |
|
|
Companies Profiled |
|
|
Customization Scope |
Available upon request |
|
Pricing |
Available upon request |
The global sand control systems market stood at US$ 3.35 Bn in 2021
The global sand control systems market is expected to grow at a CAGR of 3.96% from 2022 to 2031
Rise in need to enhance oil production efficiency and advancements in sand control techniques for offshore operations
Gravel packing was the largest segment based on technique that held 43.9% share of the global sand control systems market in 2021
Middle East & Africa was the most lucrative region that held 32.8% share of the global sand control systems market in 2021
Schlumberger Limited, Halliburton, Baker Hughes, Grit Industries, Inc., and the 3M Company
1. Executive Summary
1.1. Sand Control Systems Market Snapshot
1.2. Key Market Trends
1.3. Current Market and Future Potential
1.4. TMR’s Growth Opportunity Wheel
2. Market Overview
2.1. Market Segmentation
2.2. Market Indicators
2.3. Market Definitions
2.4. Market Dynamics
2.4.1. Drivers
2.4.2. Restraints
2.4.3. Opportunities
2.5. Porter’s Five Forces Analysis
2.6. Value Chain Analysis
2.6.1. List of Service Providers
2.6.2. List of Potential Customers
3. COVID-19 Impact Analysis
4. Global Sand Control Systems Market Analysis and Forecast, by Technique, 2020–2031
4.1. Introduction and Definitions
4.2. Global Sand Control Systems Market Value (US$ Bn) Forecast, by Technique, 2020–2031
4.2.1. Gravel Packing
4.2.2. Stand Alone Screens
4.2.3. Resin Coated Gravel
4.2.4. Plastic Consolidation
4.2.5. Others
4.3. Global Sand Control Systems Market Attractiveness, by Technique
5. Global Sand Control Systems Market Analysis and Forecast, by Application, 2020–2031
5.1. Introduction and Definitions
5.2. Global Sand Control Systems Market Value (US$ Bn) Forecast, by Application, 2020–2031
5.2.1. Onshore
5.2.2. Offshore
5.3. Global Sand Control Systems Market Attractiveness, by Application
6. Global Sand Control Systems Market Analysis and Forecast, by Well Completion, 2020–2031
6.1. Key Findings
6.2. Global Sand Control Systems Market Value (US$ Bn) Forecast, by Well Completion, 2020–2031
6.2.1. Open Hole
6.2.2. Cased Hole
6.3. Global Sand Control Systems Market Attractiveness, by Well Completion.
7. Global Sand Control Systems Market Analysis and Forecast, by Region, 2020–2031
7.1. Key Findings
7.2. Global Sand Control Systems Market Value (US$ Bn) Forecast, by Region, 2020–2031
7.2.1. North America
7.2.2. Europe
7.2.3. Asia Pacific
7.2.4. Latin America
7.2.5. Middle East & Africa
7.3. Global Sand Control Systems Market Attractiveness, by Region
8. North America Sand Control Systems Market Analysis and Forecast, 2020–2031
8.1. Key Findings
8.2. North America Sand Control Systems Market Value (US$ Bn) Forecast, by Technique, 2020–2031
8.3. North America Sand Control Systems Market Value (US$ Bn) Forecast, by Application, 2020–2031
8.4. North America Sand Control Systems Market Value (US$ Bn) Forecast, by Well Completion, 2020–2031
8.5. North America Sand Control Systems Market Value (US$ Bn) Forecast, by Country, 2020–2031
8.5.1. U.S. Sand Control Systems Market Value (US$ Bn) Forecast, by Technique, 2020–2031
8.5.2. U.S. Sand Control Systems Market Value (US$ Bn) Forecast, by Application, 2020–2031
8.5.3. U.S. Sand Control Systems Market Value (US$ Bn) Forecast, by Well Completion, 2020–2031
8.5.4. Canada Sand Control Systems Market Value (US$ Bn) Forecast, by Technique, 2020–2031
8.5.5. Canada Sand Control Systems Market Value (US$ Bn) Forecast, by Application, 2020–2031
8.5.6. Canada Sand Control Systems Market Value (US$ Bn) Forecast, by Well Completion, 2020–2031
8.6. North America Sand Control Systems Market Attractiveness Analysis
9. Europe Sand Control Systems Market Analysis and Forecast, 2020–2031
9.1. Key Findings
9.2. Europe Sand Control Systems Market Value (US$ Bn) Forecast, by Technique, 2020–2031
9.3. Europe Sand Control Systems Market Value (US$ Bn) Forecast, by Application, 2020–2031
9.4. Europe Sand Control Systems Market Value (US$ Bn) Forecast, by Well Completion, 2020–2031
9.5. Europe Sand Control Systems Market Value (US$ Bn) Forecast, by Country and Sub-region, 2020-2031
9.5.1. U.K. Sand Control Systems Market Value (US$ Bn) Forecast, by Technique, 2020–2031
9.5.2. U.K. Sand Control Systems Market Value (US$ Bn) Forecast, by Application, 2020–2031
9.5.3. U.K. Sand Control Systems Market Value (US$ Bn) Forecast, by Well Completion, 2020–2031
9.5.4. Norway Sand Control Systems Market Value (US$ Bn) Forecast, by Technique, 2020–2031
9.5.5. Norway Sand Control Systems Market Value (US$ Bn) Forecast, by Application, 2020–2031
9.5.6. Norway Sand Control Systems Market Value (US$ Bn) Forecast, by Well Completion, 2020–2031
9.5.7. Russia & CIS Sand Control Systems Market Value (US$ Bn) Forecast, by Technique, 2020–2031
9.5.8. Russia & CIS Sand Control Systems Market Value (US$ Bn) Forecast, by Application, 2020–2031
9.5.9. Russia & CIS Sand Control Systems Market Value (US$ Bn) Forecast, by Well Completion, 2020–2031
9.5.10. Rest of Europe Sand Control Systems Market Value (US$ Bn) Forecast, by Technique, 2020–2031
9.5.11. Rest of Europe Sand Control Systems Market Value (US$ Bn) Forecast, by Application, 2020–2031
9.5.12. Rest of Europe Sand Control Systems Market Value (US$ Bn) Forecast, by Well Completion, 2020–2031
9.6. Europe Sand Control Systems Market Attractiveness Analysis
10. Asia Pacific Sand Control Systems Market Analysis and Forecast, 2020–2031
10.1. Key Findings
10.2. Asia Pacific Sand Control Systems Market Value (US$ Bn) Forecast, by Technique, 2020-2031
10.3. Asia Pacific Sand Control Systems Market Value (US$ Bn) Forecast, by Application, 2020–2031
10.4. Asia Pacific Sand Control Systems Market Value (US$ Bn) Forecast, by Well Completion, 2020-2031
10.5. Asia Pacific Sand Control Systems Market Value (US$ Bn) Forecast, by Country and Sub-region, 2020-2031
10.5.1. China Sand Control Systems Market Value (US$ Bn) Forecast, by Technique, 2020–2031
10.5.2. China Sand Control Systems Market Value (US$ Bn) Forecast, by Application, 2020–2031
10.5.3. China Sand Control Systems Market Value (US$ Bn) Forecast, by Well Completion, 2020–2031
10.5.4. Japan Sand Control Systems Market Value (US$ Bn) Forecast, by Technique, 2020–2031
10.5.5. Japan Sand Control Systems Market Value (US$ Bn) Forecast, by Application, 2020–2031
10.5.6. Japan Sand Control Systems Market Value (US$ Bn) Forecast, by Well Completion, 2020–2031
10.5.7. India Sand Control Systems Market Value (US$ Bn) Forecast, by Technique, 2020–2031
10.5.8. India Sand Control Systems Market Value (US$ Bn) Forecast, by Application, 2020–2031
10.5.9. India Sand Control Systems Market Value (US$ Bn) Forecast, by Well Completion, 2020–2031
10.5.10. Australia Sand Control Systems Market Value (US$ Bn) Forecast, by Technique, 2020–2031
10.5.11. Australia Sand Control Systems Market Value (US$ Bn) Forecast, by Application, 2020–2031
10.5.12. Australia Sand Control Systems Market Value (US$ Bn) Forecast, by Well Completion, 2020–2031
10.5.13. Rest of Asia Pacific Sand Control Systems Market Value (US$ Bn) Forecast, by Technique, 2020–2031
10.5.14. Rest of Asia Pacific Sand Control Systems Market Value (US$ Bn) Forecast, by Application, 2020–2031
10.5.15. Rest of Asia Pacific Sand Control Systems Market Value (US$ Bn) Forecast, by Well Completion, 2020–2031
10.6. Asia Pacific Sand Control Systems Market Attractiveness Analysis
11. Latin America Sand Control Systems Market Analysis and Forecast, 2020–2031
11.1. Key Findings
11.2. Latin America Sand Control Systems Market Value (US$ Bn) Forecast, by Technique, 2020–2031
11.3. Latin America Sand Control Systems Market Value (US$ Bn) Forecast, by Application, 2020–2031
11.4. Latin America Sand Control Systems Market Value (US$ Bn) Forecast, by Well Completion, 2020–2031
11.5. Latin America Sand Control Systems Market Value (US$ Bn) Forecast, by Country and Sub-region, 2020-2031
11.5.1. Brazil Sand Control Systems Market Value (US$ Bn) Forecast, by Technique, 2020–2031
11.5.2. Brazil Sand Control Systems Market Value (US$ Bn) Forecast, by Application, 2020–2031
11.5.3. Brazil Sand Control Systems Market Value (US$ Bn) Forecast, by Well Completion, 2020–2031
11.5.4. Mexico Sand Control Systems Market Value (US$ Bn) Forecast, by Technique, 2020–2031
11.5.5. Mexico Sand Control Systems Market Value (US$ Bn) Forecast, by Application, 2020–2031
11.5.6. Mexico Sand Control Systems Market Value (US$ Bn) Forecast, by Well Completion, 2020–2031
11.5.7. Argentina Sand Control Systems Market Value (US$ Bn) Forecast, by Technique, 2020–2031
11.5.8. Argentina Sand Control Systems Market Value (US$ Bn) Forecast, by Application, 2020–2031
11.5.9. Argentina Sand Control Systems Market Value (US$ Bn) Forecast, by Well Completion, 2020–2031
11.5.10. Venezuela Sand Control Systems Market Value (US$ Bn) Forecast, by Technique, 2020–2031
11.5.11. Venezuela Sand Control Systems Market Value (US$ Bn) Forecast, by Application, 2020–2031
11.5.12. Venezuela Sand Control Systems Market Value (US$ Bn) Forecast, by Well Completion, 2020–2031
11.5.13. Rest of Latin America Sand Control Systems Market Value (US$ Bn) Forecast, by Technique, 2020–2031
11.5.14. Rest of Latin America Sand Control Systems Market Value (US$ Bn) Forecast, by Application, 2020–2031
11.5.15. Rest of Latin America Sand Control Systems Market Value (US$ Bn) Forecast, by Well Completion, 2020–2031
11.6. Latin America Sand Control Systems Market Attractiveness Analysis
12. Middle East & Africa Sand Control Systems Market Analysis and Forecast, 2020–2031
12.1. Key Findings
12.2. Middle East & Africa Sand Control Systems Market Value (US$ Bn) Forecast, by Technique, 2020–2031
12.3. Middle East & Africa Sand Control Systems Market Value (US$ Bn) Forecast, by Application, 2020–2031
12.4. Middle East & Africa Sand Control Systems Market Value (US$ Bn) Forecast, by Well Completion, 2020–2031
12.5. Middle East & Africa Sand Control Systems Market Value (US$ Bn) Forecast, by Country and Sub-region, 2020-2031
12.5.1. Saudi Arabia Sand Control Systems Market Value (US$ Bn) Forecast, by Technique, 2020–2031
12.5.2. Saudi Arabia Sand Control Systems Market Value (US$ Bn) Forecast, by Application, 2020–2031
12.5.3. Saudi Arabia Sand Control Systems Market Value (US$ Bn) Forecast, by Well Completion, 2020–2031
12.5.4. Oman Sand Control Systems Market Value (US$ Bn) Forecast, by Technique, 2020–2031
12.5.5. Oman Sand Control Systems Market Value (US$ Bn) Forecast, by Application, 2020–2031
12.5.6. Oman Sand Control Systems Market Value (US$ Bn) Forecast, by Well Completion, 2020–2031
12.5.7. Kuwait Sand Control Systems Market Value (US$ Bn) Forecast, by Technique, 2020–2031
12.5.8. Kuwait Sand Control Systems Market Value (US$ Bn) Forecast, by Application, 2020–2031
12.5.9. Kuwait Sand Control Systems Market Value (US$ Bn) Forecast, by Well Completion, 2020–2031
12.5.10. UAE Sand Control Systems Market Value (US$ Bn) Forecast, by Technique, 2020–2031
12.5.11. UAE Sand Control Systems Market Value (US$ Bn) Forecast, by Application, 2020–2031
12.5.12. UAE Sand Control Systems Market Value (US$ Bn) Forecast, by Well Completion, 2020–2031
12.5.13. Algeria Sand Control Systems Market Value (US$ Bn) Forecast, by Technique, 2020–2031
12.5.14. Algeria Sand Control Systems Market Value (US$ Bn) Forecast, by Application, 2020–2031
12.5.15. Algeria Sand Control Systems Market Value (US$ Bn) Forecast, by Well Completion, 2020–2031
12.5.16. Rest of Middle East & Africa Sand Control Systems Market Value (US$ Bn) Forecast, by Technique, 2020–2031
12.5.17. Rest of Middle East & Africa Sand Control Systems Market Value (US$ Bn) Forecast, by Application, 2020–2031
12.5.18. Rest of Middle East & Africa Sand Control Systems Market Value (US$ Bn) Forecast, by Well Completion, 2020–2031
12.6. Middle East & Africa Sand Control Systems Market Attractiveness Analysis
13. Global Sand Control Systems Company Market Share Analysis, 2021
13.1. Competition Matrix
13.2. Market Footprint Analysis
13.2.1. By Technique
13.2.2. By Application
13.3. Company Profiles (Details – Overview, Financials, Recent Developments, and Strategy)
13.3.1. Schlumberger Limited
13.3.1.1. Company Description
13.3.1.2. Business Overview
13.3.1.3. Financial Details
13.3.1.4. Strategic Overview
13.3.2. Halliburton
13.3.2.1. Company Description
13.3.2.2. Business Overview
13.3.2.3. Financial Details
13.3.2.4. Strategic Overview
13.3.3. Baker Hughes
13.3.3.1. Company Description
13.3.3.2. Business Overview
13.3.3.3. Financial Details
13.3.3.4. Strategic Overview
13.3.4. Weatherford International plc
13.3.4.1. Company Description
13.3.4.2. Business Overview
13.3.4.3. Financial Details
13.3.4.4. Strategic Overview
13.3.5. Grit Industries, Inc.
13.3.5.1. Company Description
13.3.5.2. Business Overview
13.3.5.3. Financial Details
13.3.5.4. Strategic Overview
13.3.6. RPC, Inc.
13.3.6.1. Company Description
13.3.6.2. Business Overview
13.3.6.3. Financial Details
13.3.6.4. Strategic Overview
13.3.7. Superior Energy Services, Inc.
13.3.7.1. Company Description
13.3.7.2. Business Overview
13.3.7.3. Financial Details
13.3.7.4. Strategic Overview
13.3.8. Variperm Canada Limited
13.3.8.1. Company Description
13.3.8.2. Business Overview
13.3.8.3. Financial Details
13.3.8.4. Strategic Overview
13.3.9. The 3M Company
13.3.9.1. Company Description
13.3.9.2. Business Overview
13.3.9.3. Financial Details
13.3.9.4. Strategic Overview
14. Primary Research: Key Insights
15. Appendix
List of Tables
Table 01: Global Sand Control Systems Market Revenue (US$ Mn) Forecast, by Technique, 2020 -2031
Table 02: Global Sand Control Systems Market Revenue (US$ Mn) Forecast, by Application, 2020 -2031
Table 03: Global Sand Control Systems Market Revenue (US$ Mn) Forecast, by Well Completion, 2020 -2031
Table 04: Global Sand Control Systems Market Value (US$ Bn) Forecast, by Region, 2020 -2031
Table 05: North America Sand Control Systems Market Value (US$ Bn) Forecast, by Technique, 2020 -2031
Table 06: North America Sand Control Systems Market Value (US$ Bn) Forecast, by Application, 2020 -2031
Table 07: North America Sand Control Systems Market Value (US$ Bn) Forecast, by Well Completion, 2020 -2031
Table 08: North America Sand Control Systems Market Value (US$ Bn) Forecast, by Country, 2020 -2031
Table 09: U.S. Sand Control Systems Market Value (US$ Bn) Forecast, by Technique, 2020 -2031
Table 10: U.S. Sand Control Systems Market Value (US$ Bn) Forecast, by Application, 2020 -2031
Table 11: U.S. Sand Control Systems Market Value (US$ Bn) Forecast, by Well Completion, 2020 -2031
Table 12: Canada Sand Control Systems Market Value (US$ Bn) Forecast, by Technique, 2020 -2031
Table 13: Canada Sand Control Systems Market Value (US$ Bn) Forecast, by Application, 2020 -2031
Table 14: Canada Sand Control Systems Market Value (US$ Bn) Forecast, by Well Completion, 2020 -2031
Table 15: Europe Sand Control Systems Market Value (US$ Bn) Forecast, by Technique, 2020 -2031
Table 16: Europe Sand Control Systems Market Value (US$ Bn) Forecast, by Application, 2020 -2031
Table 17: Europe Sand Control Systems Market Value (US$ Bn) Forecast, by Well Completion, 2020 -2031
Table 18: Europe Sand Control Systems Market Value (US$ Bn) Forecast, by Country and Sub-region, 2020 -2031
Table 19: Russia Sand Control Systems Market Value (US$ Bn) Forecast, by Technique, 2020 -2031
Table 20: Russia Sand Control Systems Market Value (US$ Bn) Forecast, by Application, 2020 -2031
Table 21: Russia Sand Control Systems Market Value (US$ Bn) Forecast, by Well Completion, 2020 -2031
Table 22: U.K. Sand Control Systems Market Value (US$ Bn) Forecast, by Technique, 2020 -2031
Table 23: U.K. Sand Control Systems Market Value (US$ Bn) Forecast, by Application, 2020 -2031
Table 24: U.K. Sand Control Systems Market Value (US$ Bn) Forecast, by Well Completion, 2020 -2031
Table 25: Norway Sand Control Systems Market Value (US$ Bn) Forecast, by Technique, 2020 -2031
Table 26: Norway Sand Control Systems Market Value (US$ Bn) Forecast, by Application, 2020 -2031
Table 27: Norway Sand Control Systems Market Value (US$ Bn) Forecast, by Well Completion, 2020 -2031
Table 28: Rest of Europe Sand Control Systems Market Value (US$ Bn) Forecast, by Technique, 2020 -2031
Table 29: Rest of Europe Sand Control Systems Market Value (US$ Bn) Forecast, by Application, 2020 -2031
Table 30: Rest of Europe Sand Control Systems Market Value (US$ Bn) Forecast, by Well Completion, 2020 -2031
Table 31: Asia Pacific Sand Control Systems Market Value (US$ Bn) Forecast, by Technique, 2020 -2031
Table 32: Asia Pacific Sand Control Systems Market Value (US$ Bn) Forecast, by Application, 2020 -2031
Table 33: Asia Pacific Sand Control Systems Market Value (US$ Bn) Forecast, by Well Completion, 2020 -2031
Table 34: Asia Pacific Sand Control Systems Market Value (US$ Bn) Forecast, by Country & Sub-region, 2020 -2031
Table 35: China Sand Control Systems Market Value (US$ Bn) Forecast, by Technique, 2020 -2031
Table 36: China Sand Control Systems Market Value (US$ Bn) Forecast, by Application, 2020 -2031
Table 37: China Sand Control Systems Market Value (US$ Bn) Forecast, by Well Completion, 2020 -2031
Table 38: India Sand Control Systems Market Value (US$ Bn) Forecast, by Technique, 2020 -2031
Table 39: India Sand Control Systems Market Value (US$ Bn) Forecast, by Application, 2020 -2031
Table 40: India Sand Control Systems Market Value (US$ Bn) Forecast, by Well Completion, 2020 -2031
Table 41: Australia Sand Control Systems Market Value (US$ Bn) Forecast, by Technique, 2020 -2031
Table 42: Australia Sand Control Systems Market Value (US$ Bn) Forecast, by Application, 2020 -2031
Table 43: Australia Sand Control Systems Market Value (US$ Bn) Forecast, by Well Completion, 2020 -2031
Table 44: Rest of Asia Pacific Sand Control Systems Market Value (US$ Bn) Forecast, by Technique, 2020 -2031
Table 45: Rest of Asia Pacific Sand Control Systems Market Value (US$ Bn) Forecast, by Application, 2020 -2031
Table 46: Rest of Asia Pacific Sand Control Systems Market Value (US$ Bn) Forecast, by Well Completion, 2020 -2031
Table 47: Latin America Sand Control Systems Market Value (US$ Bn) Forecast, by Technique, 2020 -2031
Table 48: Latin America Sand Control Systems Market Value (US$ Bn) Forecast, by Application, 2020 -2031
Table 49: Latin America Sand Control Systems Market Value (US$ Bn) Forecast, by Well Completion, 2020 -2031
Table 50: Latin America Sand Control Systems Market Value (US$ Bn) Forecast, by Country and Sub-region, 2020 -2031
Table 51: Mexico Sand Control Systems Market Value (US$ Bn) Forecast, by Technique, 2020 -2031
Table 52: Mexico Sand Control Systems Market Value (US$ Bn) Forecast, by Application, 2020 -2031
Table 53: Mexico Sand Control Systems Market Value (US$ Bn) Forecast, by Well Completion, 2020 -2031
Table 54: Brazil Sand Control Systems Market Value (US$ Bn) Forecast, by Technique, 2020 -2031
Table 55: Brazil Sand Control Systems Market Value (US$ Bn) Forecast, by Application, 2020 -2031
Table 56: Brazil Sand Control Systems Market Value (US$ Bn) Forecast, by Well Completion, 2020 -2031
Table 57: Argentina Sand Control Systems Market Value (US$ Bn) Forecast, by Technique, 2020 -2031
Table 58: Argentina Sand Control Systems Market Value (US$ Bn) Forecast, by Application, 2020 -2031
Table 59: Argentina Sand Control Systems Market Value (US$ Bn) Forecast, by Well Completion, 2020 -2031
Table 60: Venezuela Sand Control Systems Market Value (US$ Bn) Forecast, by Technique, 2020 -2031
Table 61: Venezuela Sand Control Systems Market Value (US$ Bn) Forecast, by Application, 2020 -2031
Table 62: Venezuela Sand Control Systems Market Value (US$ Bn) Forecast, by Well Completion, 2020 -2031
Table 63: Rest of Latin America Sand Control Systems Market Value (US$ Bn) Forecast, by Technique, 2020 -2031
Table 64: Rest of Latin America Sand Control Systems Market Value (US$ Bn) Forecast, by Application, 2020 -2031
Table 65: Rest of Latin America Sand Control Systems Market Value (US$ Bn) Forecast, by Well Completion, 2020 -2031
Table 66: Middle East & Africa Sand Control Systems Market Value (US$ Bn) Forecast, by Technique, 2020 -2031
Table 67: Middle East & Africa Sand Control Systems Market Value (US$ Bn) Forecast, by Application, 2020 -2031
Table 68: Middle East & Africa Sand Control Systems Market Value (US$ Bn) Forecast, by Well Completion, 2020 -2031
Table 69: Middle East & Africa Sand Control Systems Market Value (US$ Bn) Forecast, by Country and Sub-region,2020 -2031
Table 70: UAE Sand Control Systems Market Value (US$ Bn) Forecast, by Technique, 2020 -2031
Table 71: UAE Sand Control Systems Market Value (US$ Bn) Forecast, by Application, 2020 -2031
Table 72: UAE Sand Control Systems Market Value (US$ Bn) Forecast, by Well Completion, 2020 -2031
Table 73: Saudi Arabia Sand Control Systems Market Value (US$ Bn) Forecast, by Technique, 2020 -2031
Table 74: Saudi Arabia Sand Control Systems Market Value (US$ Bn) Forecast, by Application, 2020 -2031
Table 75: Saudi Arabia Sand Control Systems Market Value (US$ Bn) Forecast, by Well Completion, 2020 -2031
Table 76: Oman Sand Control Systems Market Value (US$ Bn) Forecast, by Technique, 2020 -2031
Table 77: Oman Sand Control Systems Market Value (US$ Bn) Forecast, by Application, 2020 -2031
Table 78: Oman Sand Control Systems Market Value (US$ Bn) Forecast, by Well Completion, 2020 -2031
Table 79: Algeria Sand Control Systems Market Value (US$ Bn) Forecast, by Technique, 2020 -2031
Table 80: Algeria Sand Control Systems Market Value (US$ Bn) Forecast, by Application, 2020 -2031
Table 81: Algeria Sand Control Systems Market Value (US$ Bn) Forecast, by Well Completion, 2020 -2031
Table 82: Kuwait Sand Control Systems Market Value (US$ Bn) Forecast, by Technique, 2020 -2031
Table 83: Kuwait Sand Control Systems Market Value (US$ Bn) Forecast, by Application, 2020 -2031
Table 84: Kuwait Sand Control Systems Market Value (US$ Bn) Forecast, by Well Completion, 2020 -2031
Table 85: Rest of Middle East & Africa Sand Control Systems Market Value (US$ Bn) Forecast, by Technique, 2020 -2031
Table 86: Rest of Middle East & Africa Sand Control Systems Market Value (US$ Bn) Forecast, by Application, 2020 -2031
Table 87: Rest of Middle East & Africa Sand Control Systems Market Value (US$ Bn) Forecast, by Well Completion,2020 -2031
List of Figures
Figure 01: Global Sand Control Systems Market
Figure 02: Global Sand Control Systems Market Value Share Analysis by Technique, 2021, 2025 and 2031
Figure 03: Global Sand Control Systems Market Attractiveness Analysis by Technique, 2021
Figure 04: Global Sand Control Systems Market Value Share Analysis, by Application, 2021, 2025 and 2031
Figure 05: Global Sand Control Systems Market Attractiveness Analysis, by Application, 2021
Figure 06: Global Sand Control Systems Market Value Share Analysis, by Well Completion, 2021, 2025 and 2031
Figure 07: Global Sand Control Systems Market Attractiveness Analysis, by Well Completion, 2021
Figure 08: Global Sand Control Systems Market Value Share, by Region, 2021, 2025 and 2031
Figure 09: Global Sand Control Systems Market Attractiveness, by Region
Figure 10: North America Sand Control Systems Market Value (US$ Bn) Forecast, 2020 -2031
Figure 11: North America Sand Control Systems Market Attractiveness, by Country
Figure 12: North America Sand Control Systems Market Value Share, by Technique, 2021, 2025 and 2031
Figure 13: North America Sand Control Systems Market Value Share, by Application, 2021, 2025 and 2031
Figure 14: North America Sand Control Systems Market Value Share, by Well Completion, 2021, 2025 and 2031
Figure 15: North America Sand Control Systems Market Value Share, by Country, 2021, 2025 and 2031
Figure 16: North America Sand Control Systems Market Attractiveness, by Technique, 2022 - 2031
Figure 17: North America Sand Control Systems Market Attractiveness, by Application, 2022 - 2031
Figure 18: North America Sand Control Systems Market Attractiveness, by Well Completion, 2022 - 2031
Figure 19: Europe Sand Control Systems Market Value (US$ Bn) Forecast, 2020 -2031
Figure 20: Europe Sand Control Systems Market Attractiveness, by Country and Sub-region
Figure 21: Europe Sand Control Systems Market Value Share, by Technique, 2021, 2025 and 2031
Figure 22: Europe Sand Control Systems Market Value Share, by Application, 2021, 2025 and 2031
Figure 23: Europe Sand Control Systems Market Value Share, by Well Completion, 2021, 2025 and 2031
Figure 24: Europe Sand Control Systems Market Value Share, by Country & Sub-region, 2021, 2025 and 2031
Figure 25: Europe Sand Control Systems Market Attractiveness, by Technique, 2022 - 2031
Figure 26: Europe Sand Control Systems Market Attractiveness, by Application, 2022 - 2031
Figure 27: Europe Sand Control Systems Market Attractiveness, by Well Completion, 2022 - 2031
Figure 28: Asia Pacific Sand Control Systems Market Value (US$ Bn) Forecast, 2020 -2031
Figure 29: Asia Pacific Sand Control Systems Market Attractiveness, by Country & Sub-region
Figure 30: Asia Pacific Sand Control Systems Market Value Share, by Technique, 2021, 2025 and 2031
Figure 31: Asia Pacific Sand Control Systems Market Value Share, by Application, 2021, 2025 and 2031
Figure 32: Asia Pacific Sand Control Systems Market Value Share, by Well Completion, 2021, 2025 and 2031
Figure 33: Asia Pacific Sand Control Systems Market Value Share, by Country & Sub-region, 2021, 2025 and 2031
Figure 34: Asia Pacific Sand Control Systems Market Attractiveness, by Technique, 2022 - 2031
Figure 35: Asia Pacific Sand Control Systems Market Attractiveness, by Application, 2022 - 2031
Figure 36: Asia Pacific Sand Control Systems Market Attractiveness, by Well Completion, 2022 - 2031
Figure 37: Latin America Sand Control Systems Market Value (US$ Bn) Forecast, 2020 -2031
Figure 38: Latin America Sand Control Systems Market Attractiveness, by Country and Sub-region
Figure 39: Latin America Sand Control Systems Market Value Share, by Technique, 2021, 2025 and 2031
Figure 40: Latin America Sand Control Systems Market Value Share, by Application, 2021, 2025 and 2031
Figure 41: Latin America Sand Control Systems Market Value Share, by Well Completion, 2021, 2025 and 2031
Figure 42: Latin America Sand Control Systems Market Value Share, by Country & Sub-region, 2021, 2025 and 2031
Figure 43: Latin America Sand Control Systems Market Attractiveness, by Technique, 2022 - 2031
Figure 44: Latin America Sand Control Systems Market Attractiveness, by Application, 2022 - 2031
Figure 45: Latin America Sand Control Systems Market Attractiveness, by Well Completion, 2022 - 2031
Figure 46: Middle East & Africa Sand Control Systems Market Value (US$ Bn) Forecast, 2020 -2031
Figure 47: Middle East & Africa Sand Control Systems Market Attractiveness, by Country & Sub-region
Figure 48: Middle East & Africa Sand Control Systems Market Value Share, by Technique, 2021, 2025 and 2031
Figure 49: Middle East & Africa Sand Control Systems Market Value Share, by Application, 2021, 2025 and 2031
Figure 50: Middle East & Africa Sand Control Systems Market Value Share, by Well Completion, 2021, 2025 and 2031
Figure 51: Middle East & Africa Sand Control Systems Market Value Share, by Country & Sub-region, 2021, 2025 and 2031
Figure 52: Middle East & Africa Sand Control Systems Market Attractiveness, by Technique, 2022 - 2031
Figure 53: Middle East & Africa Sand Control Systems Market Attractiveness, by Application, 2022 - 2031
Figure 54: Middle East & Africa Sand Control Systems Market Attractiveness, by Well Completion, 2022 - 2031
Figure 55: Company Market Share Analysis, 2021
Figure 56: Company Market Share Analysis, 2021
Copyright © Transparency Market Research, Inc. All Rights reserved
Trust Online

Sand Control Systems Market