
Reports
Reports
Positive displacement (PD) sanitary pumps find a wide set of applications across a number of industries owing to their ability to effectively handle high differential pressure and high-viscosity fluids. The rising consumer preference to processed foods across developed as well as developing economies and improved awareness regarding the adherence of sanitation practices among consumers as well as companies operating in the food sector are driving the increased adoption of these pumps in the food and beverages industry. The market is also seeing favorable growth owing to the stringent regulations compelling companies to adhere to better sanitation and standards is also a key factor driving the market.
Moreover, the increased adoption of advanced pump systems capable of providing real-time feedback of system performance of machineries has also helped in bolstering the demand for PD sanitary pumps across industries such as pharmaceuticals and biotechnology. Transparency Market Research states that the global PD sanitary pumps market will exhibit a strong 10% CAGR over the period between 2016 and 2024. This will allow the market, which held an opportunity worth US$4.55 bn in 2015, to rise to a valuation of US$10.65 bn by 2024.
Rotary and Reciprocating PD Sanitary Pumps
PD sanitary pumps are chiefly available in two varieties based on the motion of the internal machinery to move fluids: rotary and reciprocating pumps. Of the key varieties of rotary PD sanitary pumps available in the market, the segment of gear pumps is presently the most preferred one. Gear pumps accounted for a share of nearly 32% of the overall revenues of the rotary PD sanitary pumps market in 2015. The versatility and flexibility offered by gear pumps, along with their economic nature are expected to lead to their sustainable demand across key end-use industry in the next few years. However, the segment is expected to lose prominence to the twin screw pumps variety and see a substantial decline in their share in the rotary pumps market revenues in the next few years.
Of the key varieties of reciprocating PD sanitary pumps studied in the report, the segment of diaphragm pumps led with a 54% share of the reciprocating PD sanitary pumps market in 2015. This segment is also expected to remain the foremost contributor to the reciprocating PD sanitary pumps market’s overall revenues over the period between 2016 and 2024. The majority of demand for these diaphragm pumps will be driven by the electronics industry where they can be conveniently used for handling harmful chemicals used during the production of semiconductors and semiconductor parts.
Increased Focus on Sanitation in Industries across Emerging Economies to Act as High-impact Driver
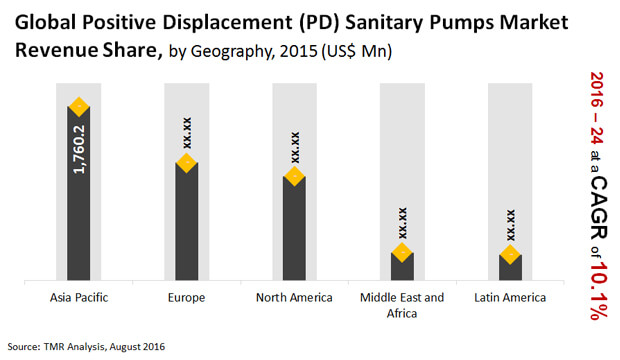
Asia Pacific is presently the leading regional market for PD sanitary pumps, accounting for a share of nearly 39% in the global market in 2015. The region is expected to retain its command on the global market over the period between 2016 and 2024 as well and witness a slight increase in its share in the global market by 2024. Excellent growth of the region’s construction and manufacturing sectors over the past several years and sizeable rise in awareness regarding the necessity of adhering to sanitation practices among both, consumers as well as industries, are expected to be the chief factors driving the market in the near future. The market for PD sanitary pumps in Asia Pacific is expected to rise at a swift pace of 10.8% CAGR from 2016 and 2024 compared to other key regional markets for PD sanitary pumps.
The Middle East and Africa market for PD sanitary pumps is expected to be the one with the next most promising growth opportunities over the said period. Middle East and Africa accounted for only 6.3% of the global market in 2015. However, it is expected to expand at an 9.8% CAGR from 2016 and 2024. The promising rise in manufacturing activities and continuous rise in population have led to a substantial rise in demand for desalination plants in the region, thus driving the market for PD sanitation pumps. The rising number of producers, suppliers, and retailers in the food and beverages industry in the region has also led to the increased demand for such pumps.
Some of the key vendors operating in the global PD sanitary pumps market are IDEX Corporation, Fristam Pumps, SPX Corporation, Alfa Laval AB, Xylem Inc., and ITT Corporation, and PSG Dover.
Chapter 1 Preface
1.1 Research Scope
1.2 Market Segmentation
1.3 Research Methodology
Chapter 2 Executive Summary
2.1 Global Positive Displacement Sanitary Pumps Market Snapshot
2.2 Global Positive Displacement Sanitary Pumps Market Revenue and Volume, 2014 – 2024 (US$ Mn and Million Units) and Year-on-Year Growth (%)
Chapter 3 Global Positive Displacement Sanitary Pumps Market Analysis, 2014 – 2024 (US$ Mn and Million Units)
3.1 Overview
3.2 Key Trends Analysis
3.3 Market Dynamics
3.3.1 Drivers
3.3.2 Restraints
3.3.3 Opportunities
3.4 Price Trends Analysis: Global Positive Displacement Sanitary Pumps Market
3.5 Global Positive Displacement Sanitary Pumps Market Analysis, By Pump Type, 2014 – 2024 (US$ Mn and Million Units)
3.5.1 Overview
3.5.2 Rotary Positive Displacement Sanitary Pumps
3.5.2.1 Rotary Lobe
3.5.2.2 Twin Screw
3.5.2.3 Progressive Cavity
3.5.2.4 Eccentric Disc
3.5.2.5 Gear
3.5.2.6 Sinusoidal
3.5.2.7 Hose
3.5.3 Reciprocating Positive Displacement Sanitary Pumps
3.5.3.1 Piston/Plunger
3.5.3.2 Diaphragm
3.6 Global Positive Displacement Sanitary Pumps Market Analysis, By End-use, 2014 – 2024 (US$ Mn and Million Units)
3.6.1 Overview
3.6.2 Food and Beverage
3.6.2.1 Rotary Positive Displacement Sanitary Pumps
3.6.2.1.1 Rotary Lobe
3.6.2.1.2 Twin Screw
3.6.2.1.3 Progressive Cavity
3.6.2.1.4 Eccentric Disc
3.6.2.1.5 Gear
3.6.2.1.6 Sinusoidal
3.6.2.1.7 Hose
3.6.2.2 Reciprocating Positive Displacement Sanitary Pumps
3.6.2.2.1 Piston/Plunger
3.6.2.2.2 Diaphragm
3.6.3 Pharmaceuticals
3.6.3.1 Rotary Positive Displacement Sanitary Pumps
3.6.3.1.1 Rotary Lobe
3.6.3.1.2 Twin Screw
3.6.3.1.3 Progressive Cavity
3.6.3.1.4 Eccentric Disc
3.6.3.1.5 Gear
3.6.3.1.6 Sinusoidal
3.6.3.1.7 Hose
3.6.3.2 Reciprocating Positive Displacement Sanitary Pumps
3.6.3.2.1 Piston/Plunger
3.6.3.2.2 Diaphragm
3.6.4 Cosmetics
3.6.4.1 Rotary Positive Displacement Sanitary Pumps
3.6.4.1.1 Rotary Lobe
3.6.4.1.2 Twin Screw
3.6.4.1.3 Progressive Cavity
3.6.4.1.4 Eccentric Disc
3.6.4.1.5 Gear
3.6.4.1.6 Sinusoidal
3.6.4.1.7 Hose
3.6.4.2 Reciprocating Positive Displacement Sanitary Pumps
3.6.4.2.1 Piston/Plunger
3.6.4.2.2 Diaphragm
3.6.5 Biotechnology
3.6.5.1 Rotary Positive Displacement Sanitary Pumps
3.6.5.1.1 Rotary Lobe
3.6.5.1.2 Twin Screw
3.6.5.1.3 Progressive Cavity
3.6.5.1.4 Eccentric Disc
3.6.5.1.5 Gear
3.6.5.1.6 Sinusoidal
3.6.5.1.7 Hose
3.6.5.2 Reciprocating Positive Displacement Sanitary Pumps
3.6.5.2.1 Piston/Plunger
3.6.5.2.2 Diaphragm
3.6.6 Water Treatment Systemse
3.6.6.1 Rotary Positive Displacement Sanitary Pumps
3.6.6.1.1 Rotary Lobe
3.6.6.1.2 Twin Screw
3.6.6.1.3 Progressive Cavity
3.6.6.1.4 Eccentric Disc
3.6.6.1.5 Gear
3.6.6.1.6 Sinusoidal
3.6.6.1.7 Hose
3.6.6.2 Reciprocating Positive Displacement Sanitary Pumps
3.6.6.2.1 Piston/Plunger
3.6.6.2.2 Diaphragm
3.6.7 Textile
3.6.7.1 Rotary Positive Displacement Sanitary Pumps
3.6.7.1.1 Rotary Lobe
3.6.7.1.2 Twin Screw
3.6.7.1.3 Progressive Cavity
3.6.7.1.4 Eccentric Disc
3.6.7.1.5 Gear
3.6.7.1.6 Sinusoidal
3.6.7.1.7 Hose
3.6.7.2 Reciprocating Positive Displacement Sanitary Pumps
3.6.7.2.1 Piston/Plunger
3.6.7.2.2 Diaphragm
3.6.8 Others (Bio Fuel and Semiconductors)
3.6.8.1 Rotary Positive Displacement Sanitary Pumps
3.6.8.1.1 Rotary Lobe
3.6.8.1.2 Twin Screw
3.6.8.1.3 Progressive Cavity
3.6.8.1.4 Eccentric Disc
3.6.8.1.5 Gear
3.6.8.1.6 Sinusoidal
3.6.8.1.7 Hose
3.6.8.2 Reciprocating Positive Displacement Sanitary Pumps
3.6.8.2.1 Piston/Plunger
3.6.8.2.2 Diaphragm
3.7 Competitive Landscape
3.7.1 Market Positioning of Key Players, 2015
3.7.2 Competitive Strategies Adopted by Leading Players
3.7.3 Recommendations
Chapter 4 North America Positive Displacement Sanitary Pumps Market Analysis, 2014 – 2024 (US$ Mn and Million Units)
4.1 Key Trends Analysis
4.2 North America Positive Displacement Sanitary Pumps Market Analysis, By Pump Type, 2014 – 2024 (US$ Mn and Million Units)
4.2.1 Rotary Positive Displacement Sanitary Pumps
4.2.1.1 Rotary Lobe
4.2.1.2 Twin Screw
4.2.1.3 Progressive Cavity
4.2.1.4 Eccentric Disc
4.2.1.5 Gear
4.2.1.6 Sinusoidal
4.2.1.7 Hose
4.2.2 Rotary Positive Displacement Sanitary Pumps
4.2.2.1 Piston/Plunger
4.2.2.2 Diaphragm
4.3 North America Positive Displacement Sanitary Pumps Market Analysis, By End-use, 2014 – 2024 (US$ Mn and Million Units)
4.3.1 Food and Beverage
4.3.2 Pharmaceuticals
4.3.3 Cosmetics
4.3.4 Biotechnology
4.3.5 Water Treatment Systems
4.3.6 Textile
4.3.7 Others (Bio Fuel and Semiconductors)
Chapter 5 Europe Positive Displacement Sanitary Pumps Market Analysis, 2014 – 2024 (US$ Mn and Million Units)
5.1 Key Trends Analysis
5.2 Europe Positive Displacement Sanitary Pumps Market Analysis, By Pump Type, 2014 – 2024 (US$ Mn and Million Units)
5.2.1 Rotary Positive Displacement Sanitary Pumps
5.2.1.1 Rotary Lobe
5.2.1.2 Twin Screw
5.2.1.3 Progressive Cavity
5.2.1.4 Eccentric Disc
5.2.1.5 Gear
5.2.1.6 Sinusoidal
5.2.1.7 Hose
5.2.2 Rotary Positive Displacement Sanitary Pumps
5.2.2.1 Piston/Plunger
5.2.2.2 Diaphragm
5.3 Europe Positive Displacement Sanitary Pumps Market Analysis, By End-use, 2014 – 2024 (US$ Mn and Million Units)
5.3.1 Food and Beverage
5.3.2 Pharmaceuticals
5.3.3 Cosmetics
5.3.4 Biotechnology
5.3.5 Water Treatment Systems
5.3.6 Textile
5.3.7 Others (Bio Fuel and Semiconductors)
Chapter 6 Asia Pacific Positive Displacement Sanitary Pumps Market Analysis, 2014 – 2024 (US$ Mn and Million Units)
6.1 Key Trends Analysis
6.2 Asia Pacific Positive Displacement Sanitary Pumps Market Analysis, By Pump Type, 2014 – 2024 (US$ Mn and Million Units)
6.2.1 Rotary Positive Displacement Sanitary Pumps
6.2.1.1 Rotary Lobe
6.2.1.2 Twin Screw
6.2.1.3 Progressive Cavity
6.2.1.4 Eccentric Disc
6.2.1.5 Gear
6.2.1.6 Sinusoidal
6.2.1.7 Hose
6.2.2 Rotary Positive Displacement Sanitary Pumps
6.2.2.1 Piston/Plunger
6.2.2.2 Diaphragm
6.3 Asia Pacific Positive Displacement Sanitary Pumps Market Analysis, By End-use, 2014 – 2024 (US$ Mn and Million Units)
6.3.1 Food and Beverage
6.3.2 Pharmaceuticals
6.3.3 Cosmetics
6.3.4 Biotechnology
6.3.5 Water Treatment Systems
6.3.6 Textile
6.3.7 Others (Bio Fuel and Semiconductors)
Chapter 7 Middle-East and Africa (MEA) Positive Displacement Sanitary Pumps Market Analysis, 2014 – 2024 (US$ Mn and Million Units)
7.1 Key Trends Analysis
7.2 MEA Positive Displacement Sanitary Pumps Market Analysis, By Pump Type, 2014 – 2024 (US$ Mn and Million Units)
7.2.1 Rotary Positive Displacement Sanitary Pumps
7.2.1.1 Rotary Lobe
7.2.1.2 Twin Screw
7.2.1.3 Progressive Cavity
7.2.1.4 Eccentric Disc
7.2.1.5 Gear
7.2.1.6 Sinusoidal
7.2.1.7 Hose
7.2.2 Rotary Positive Displacement Sanitary Pumps
7.2.2.1 Piston/Plunger
7.2.2.2 Diaphragm
7.3 MEA Positive Displacement Sanitary Pumps Market Analysis, By End-use, 2014 – 2024 (US$ Mn and Million Units)
7.3.1 Food and Beverage
7.3.2 Pharmaceuticals
7.3.3 Cosmetics
7.3.4 Biotechnology
7.3.5 Water Treatment Systems
7.3.6 Textile
7.3.7 Others (Bio Fuel and Semiconductors)
Chapter 8 Middle-East and Africa (MEA) Positive Displacement Sanitary Pumps Market Analysis, 2014 – 2024 (US$ Mn and Million Units)
8.1 Key Trends Analysis
8.2 Latin America Positive Displacement Sanitary Pumps Market Analysis, By Pump Type, 2014 – 2024 (US$ Mn and Million Units)
8.2.1 Rotary Positive Displacement Sanitary Pumps
8.2.1.1 Rotary Lobe
8.2.1.2 Twin Screw
8.2.1.3 Progressive Cavity
8.2.1.4 Eccentric Disc
8.2.1.5 Gear
8.2.1.6 Sinusoidal
8.2.1.7 Hose
8.2.2 Rotary Positive Displacement Sanitary Pumps
8.2.2.1 Piston/Plunger
8.2.2.2 Diaphragm
8.3 Latin America Positive Displacement Sanitary Pumps Market Analysis, By End-use, 2014 – 2024 (US$ Mn and Million Units)
8.3.1 Food and Beverage
8.3.2 Pharmaceuticals
8.3.3 Cosmetics
8.3.4 Biotechnology
8.3.5 Water Treatment Systems
8.3.6 Textile
8.3.7 Others (Bio Fuel and Semiconductors)
Chapter 9 Global Positive Displacement Sanitary Pumps Market, Country Snippets (US$ Mn and Million Units)
9.1 The U.S.
9.2 Canada
9.3 The U.K.
9.4 Germany
9.5 France
9.6 Spain
9.7 Italy
9.8 China
9.9 Japan
9.10 India
9.11 Indonesia
9.12 UAE
9.13 Saudi Arabia
9.14 South Africa
9.15 Brazil
Chapter 10 Company Profiles
10.1 SPX Corporation
10.1.1 Company Details (HQ, Foundation Year, Employee Strength)
10.1.2 Market Presence, By Segment and Geography
10.1.3 Key Developments
10.1.4 Strategy and Historical Roadmap
10.1.5 Revenue and Operating Profits
10.2 Fristam Pumps
10.2.1 Company Details (HQ, Foundation Year, Employee Strength)
10.2.2 Market Presence, By Segment and Geography
10.2.3 Key Developments
10.2.4 Strategy and Historical Roadmap
10.2.5 Revenue and Operating Profits
10.3 IDEX Corporation
10.3.1 Company Details (HQ, Foundation Year, Employee Strength)
10.3.2 Market Presence, By Segment and Geography
10.3.3 Key Developments
10.3.4 Strategy and Historical Roadmap
10.3.5 Revenue and Operating Profits
10.4 Alfa Laval AB
10.4.1 Company Details (HQ, Foundation Year, Employee Strength)
10.4.2 Market Presence, By Segment and Geography
10.4.3 Key Developments
10.4.4 Strategy and Historical Roadmap
10.4.5 Revenue and Operating Profits
10.5 PSG Dover
10.5.1 Company Details (HQ, Foundation Year, Employee Strength)
10.5.2 Market Presence, By Segment and Geography
10.5.3 Key Developments
10.5.4 Strategy and Historical Roadmap
10.5.5 Revenue and Operating Profits
10.6 ITT Corporation
10.6.1 Company Details (HQ, Foundation Year, Employee Strength)
10.6.2 Market Presence, By Segment and Geography
10.6.3 Key Developments
10.6.4 Strategy and Historical Roadmap
10.6.5 Revenue and Operating Profits
10.7 Xylem Inc.
10.7.1 Company Details (HQ, Foundation Year, Employee Strength)
10.7.2 Market Presence, By Segment and Geography
10.7.3 Key Developments
10.7.4 Strategy and Historical Roadmap
10.7.5 Revenue and Operating Profits
10.8 Ampco Pumps GmbH
10.8.1 Company Details (HQ, Foundation Year, Employee Strength)
10.8.2 Market Presence, By Segment and Geography
10.8.3 Key Developments
10.8.4 Strategy and Historical Roadmap
10.8.5 Revenue and Operating Profits
10.9 Axiflow Technologies, Inc.
10.9.1 Company Details (HQ, Foundation Year, Employee Strength)
10.9.2 Market Presence, By Segment and Geography
10.9.3 Key Developments
10.9.4 Strategy and Historical Roadmap
10.9.5 Revenue and Operating Profits
10.10 KSB AG
10.10.1 Company Details (HQ, Foundation Year, Employee Strength)
10.10.2 Market Presence, By Segment and Geography
10.10.3 Key Developments
10.10.4 Strategy and Historical Roadmap
10.10.5 Revenue and Operating Profits
10.11 GEA Group
10.11.1 Company Details (HQ, Foundation Year, Employee Strength)
10.11.2 Market Presence, By Segment and Geography
10.11.3 Key Developments
10.11.4 Strategy and Historical Roadmap
10.11.5 Revenue and Operating Profits
10.12 Sulzer Ltd.
10.12.1 Company Details (HQ, Foundation Year, Employee Strength)
10.12.2 Market Presence, By Segment and Geography
10.12.3 Key Developments
10.12.4 Strategy and Historical Roadmap
10.12.5 Revenue and Operating Profits
10.13 3P Prinz
10.13.1 Company Details (HQ, Foundation Year, Employee Strength)
10.13.2 Market Presence, By Segment and Geography
10.13.3 Key Developments
10.13.4 Strategy and Historical Roadmap
10.13.5 Revenue and Operating Profits
10.14 INOXPA S.A.
10.14.1 Company Details (HQ, Foundation Year, Employee Strength)
10.14.2 Market Presence, By Segment and Geography
10.14.3 Key Developments
10.14.4 Strategy and Historical Roadmap
10.14.5 Revenue and Operating Profits
10.15 IPP Pumps
10.15.1 Company Details (HQ, Foundation Year, Employee Strength)
10.15.2 Market Presence, By Segment and Geography
10.15.3 Key Developments
10.15.4 Strategy and Historical Roadmap
10.15.5 Revenue and Operating Profits
10.16 JEC LTD.
10.16.1 Company Details (HQ, Foundation Year, Employee Strength)
10.16.2 Market Presence, By Segment and Geography
10.16.3 Key Developments
10.16.4 Strategy and Historical Roadmap
10.16.5 Revenue and Operating Profits
10.17 JUNG PROCESS SYSTEMS GmbH
10.17.1 Company Details (HQ, Foundation Year, Employee Strength)
10.17.2 Market Presence, By Segment and Geography
10.17.3 Key Developments
10.17.4 Strategy and Historical Roadmap
10.17.5 Revenue and Operating Profits
10.18 Nakakin Co., Ltd.
10.18.1 Company Details (HQ, Foundation Year, Employee Strength)
10.18.2 Market Presence, By Segment and Geography
10.18.3 Key Developments
10.18.4 Strategy and Historical Roadmap
10.18.5 Revenue and Operating Profits
10.19 NETZSCH Pumps & Systems
10.19.1 Company Details (HQ, Foundation Year, Employee Strength)
10.19.2 Market Presence, By Segment and Geography
10.19.3 Key Developments
10.19.4 Strategy and Historical Roadmap
10.19.5 Revenue and Operating Profits
10.20 Pomac Industries Group
10.20.1 Company Details (HQ, Foundation Year, Employee Strength)
10.20.2 Market Presence, By Segment and Geography
10.20.3 Key Developments
10.20.4 Strategy and Historical Roadmap
10.20.5 Revenue and Operating Profits
10.21 Pumpenfabrik Wangen GmbH
10.21.1 Company Details (HQ, Foundation Year, Employee Strength)
10.21.2 Market Presence, By Segment and Geography
10.21.3 Key Developments
10.21.4 Strategy and Historical Roadmap
10.21.5 Revenue and Operating Profits
10.22 SEEPEX GMBH
10.22.1 Company Details (HQ, Foundation Year, Employee Strength)
10.22.2 Market Presence, By Segment and Geography
10.22.3 Key Developments
10.22.4 Strategy and Historical Roadmap
10.22.5 Revenue and Operating Profits
10.23 Wild Indag
10.23.1 Company Details (HQ, Foundation Year, Employee Strength)
10.23.2 Market Presence, By Segment and Geography
10.23.3 Key Developments
10.23.4 Strategy and Historical Roadmap
10.23.5 Revenue and Operating Profits
List of Tables
Table 01: Global PD Sanitary Pumps Market Price Trend Analysis (US$) Forecast, By Rotary PD Sanitary Pump Type, 2014–2024
Table 02: Global PD Sanitary Pumps Market Price Trend Analysis (US$) Forecast, By Reciprocating PD Sanitary Pump Type, 2014–2024
Table 03: Global PD Sanitary Pumps Market Size (US$ Mn) and Volume (Million Units) Forecast, By Rotary PD Sanitary Pump Type, 2014–2024
Table 04: Global PD Sanitary Pumps Market Size (US$ Mn) and Volume (Million Units) Forecast, By Rotary PD Sanitary Pump Type, 2014–2024
Table 05: Global PD Sanitary Pumps Market Size (US$ Mn) and Volume (Million Units) Forecast, By Reciprocating PD Sanitary Pump Type, 2014–2024
Table 06: Global PD Sanitary Pumps Market Size (US$ Mn) and Volume (Million Units) Forecast, By End-use, 2014–2024
Table 07: Global PD Sanitary Pumps Market Size (US$ Mn) and Volume (Million Units) Forecast, By End-use, 2014–2024
Table 08: Global PD Sanitary Pumps Food & Beverage Market Size (US$ Mn) and Volume (Million Units) Forecast, By Rotary PD Sanitary Pump Type, 2014–2024
Table 09: Global PD Sanitary Pumps Food & Beverage Market Size (US$ Mn) and Volume (Million Units) Forecast, By Rotary PD Sanitary Pump Type, 2014–2024
Table 10: Global PD Sanitary Pumps Food & Beverage Market Size (US$ Mn) and Volume (Million Units) Forecast, By Reciprocating PD Sanitary Pump Type, 2014–2024
Table 11: Global PD Sanitary Pumps Pharmaceutical Market Size (US$ Mn) and Volume (Million Units) Forecast, By Rotary PD Sanitary Pump Type, 2014–2024
Table 12: Global PD Sanitary Pumps Pharmaceutical Market Size (US$ Mn) and Volume (Million Units) Forecast, By Rotary PD Sanitary Pump Type, 2014–2024
Table 13: Global PD Sanitary Pumps Pharmaceutical Market Size (US$ Mn) and Volume (Million Units) Forecast, By Reciprocating PD Sanitary Pump Type, 2014–2024
Table 14: Global Cosmetics Market Size (US$ Mn) and Volume (Million Units) Forecast, By Rotary PD Sanitary Pump Type, 2014–2024
Table 15: Global Cosmetics Market Size (US$ Mn) and Volume (Million Units) Forecast, By Rotary PD Sanitary Pump Type, 2014–2024
Table 16: Global Cosmetics Market Size (US$ Mn) and Volume (Million Units) Forecast, By Reciprocating PD Sanitary Pump Type, 2014–2024
Table 17: Global Biotechnology Market Size (US$ Mn) and Volume (Million Units) Forecast, By Rotary PD Sanitary Pump Type, 2014–2024
Table 18: Global Biotechnology Market Size (US$ Mn) and Volume (Million Units) Forecast, By Rotary PD Sanitary Pump Type, 2014–2024
Table 19: Global Biotechnology Market Size (US$ Mn) and Volume (Million Units) Forecast, By Reciprocating PD Sanitary Pump Type, 2014–2024
Table 20: Global Water Treatment Systems Market Size (US$ Mn) and Volume (Million Units) Forecast, By Rotary PD Sanitary Pump Type, 2014–2024
Table 21: Global Water Treatment Systems Market Size (US$ Mn) and Volume (Million Units) Forecast, By Rotary PD Sanitary Pump Type, 2014–2024
Table 22: Global Water Treatment Systems Market Size (US$ Mn) and Volume (Million Units) Forecast, By Reciprocating PD Sanitary Pump Type, 2014–2024
Table 23: Global Textile Market Size (US$ Mn) and Volume (Million Units) Forecast, By Rotary PD Sanitary Pump Type, 2014–2024
Table 24: Global Textile Market Size (US$ Mn) and Volume (Million Units) Forecast, By Rotary PD Sanitary Pump Type, 2014–2024
Table 25: Global Textile Market Size (US$ Mn) and Volume (Million Units) Forecast, By Reciprocating PD Sanitary Pump Type, 2014–2024
Table 26: Global Others Market Size (US$ Mn) and Volume (Million Units) Forecast, By Rotary PD Sanitary Pump Type, 2014–2024
Table 27: Global Others Market Size (US$ Mn) and Volume (Million Units) Forecast, By Rotary PD Sanitary Pump Type, 2014–2024
Table 28: Global Others Market Size (US$ Mn) and Volume (Million Units) Forecast, By Reciprocating PD Sanitary Pump Type, 2014–2024
Table 29: North America PD Sanitary Pumps Market Size (US$ Mn) and Volume (Million Units) Forecast, By Rotary PD Sanitary Pump Type, 2014 – 2024
Table 30: North America PD Sanitary Pumps Market Size (US$ Mn) and Volume (Million Units) Forecast, By Rotary PD Sanitary Pump Type, 2014 – 2024
Table 31: North America PD Sanitary Pumps Market Size (US$ Mn) and Volume (Million Units) Forecast, By Reciprocating PD Sanitary Pump Type, 2014 – 2024
Table 32: North America PD Sanitary Pumps Market Size (US$ Mn) and Volume (Million Units) Forecast, By End-use, 2014 – 2024
Table 33: North America PD Sanitary Pumps Market Size (US$ Mn) and Volume (Million Units) Forecast, By End-use, 2014– 2024
Table 34: Europe PD Sanitary Pumps Market Size (US$ Mn) and Volume (Million Units) Forecast, By Rotary PD Sanitary Pump Type, 2014–2024
Table 35: Europe PD Sanitary Pumps Market Size (US$ Mn) and Volume (Million Units) Forecast, By Rotary PD Sanitary Pump Type, 2014–2024
Table 36: Europe PD Sanitary Pumps Market Size (US$ Mn) and Volume (Million Units) Forecast, By Reciprocating PD Sanitary Pump Type, 2014–2024
Table 37: Europe PD Sanitary Pumps Market Size (US$ Mn) and Volume (Million Units) Forecast, By End-use, 2014 – 2024
Table 38: Europe PD Sanitary Pumps Market Size (US$ Mn) and Volume (Million Units) Forecast, By End-use, 2014 – 2024
Table 39: Asia Pacific PD Sanitary Pumps Market Size (US$ Mn) and Volume (Million Units) Forecast, By Rotary PD Sanitary Pump Type, 2014–2024
Table 40: Asia Pacific PD Sanitary Pumps Market Size (US$ Mn) and Volume (Million Units) Forecast, By Rotary PD Sanitary Pump Type, 2014–2024
Table 41: Asia Pacific PD Sanitary Pumps Market Size (US$ Mn) and Volume (Million Units) Forecast, By Reciprocating PD Sanitary Pump Type, 2014–2024
Table 42: Asia Pacific PD Sanitary Pumps Market Size (US$ Mn) and Volume (Million Units) Forecast, By End-use, 2014–2024
Table 43: Asia Pacific PD Sanitary Pumps Market Size (US$ Mn) and Volume (Million Units) Forecast, By End-use, 2014– 2024
Table 44: Middle East and Africa PD Sanitary Pumps Market Size (US$ Mn) and Volume (Million Units) Forecast, By Rotary PD Sanitary Pump Type, 2014–2024
Table 45: Middle East and Africa PD Sanitary Pumps Market Size (US$ Mn) and Volume (Million Units) Forecast, By Rotary PD Sanitary Pump Type, 2014–2024
Table 46: Middle East and Africa PD Sanitary Pumps Market Size (US$ Mn) and Volume (Million Units) Forecast, By Reciprocating PD Sanitary Pump Type, 2014–2024
Table 47: Middle East and Africa PD Sanitary Pumps Market Size (US$ Mn) and Volume (Million Units) Forecast, By End-use, 2014–2024
Table 48: Middle East and Africa PD Sanitary Pumps Market Size (US$ Mn) and Volume (Million Units) Forecast, By End-use, 2014– 2024
Table 49: Latin America PD Sanitary Pumps Market Size (US$ Mn) and Volume (Million Units) Forecast, by Rotary PD Sanitary Pump Type, 2014–2024
Table 50: Latin America PD Sanitary Pumps Market Size (US$ Mn) and Volume (Million Units) Forecast, by Rotary PD Sanitary Pump Type, 2014–2024
Table 51: Latin America PD Sanitary Pumps Market Size (US$ Mn) and Volume (Million Units) Forecast, by Reciprocating PD Sanitary Pump Type, 2014–2024
Table 52: Latin America PD Sanitary Pumps Market Size (US$ Mn) and Volume (Million Units) Forecast, by End-use, 2014–2024
Table 53: Latin America PD Sanitary Pumps Market Size (US$ Mn) and Volume (Million Units) Forecast, by End-use, 2014–2024
Table 54: North America PD Sanitary Pumps Market Size (US$ Mn) and Volume (Million Units) Forecast, By Country, 2014–2024
Table 55: Europe PD Sanitary Pumps Market Size (US$ Mn) and Volume (Million Units) Forecast, By Country, 2015–2024
Table 56: Europe PD Sanitary Pumps Market Size (US$ Mn) and Volume (Million Units) Forecast, By Country, 2015–2024
Table 57: Asia Pacific PD Sanitary Pumps Market Size (US$ Mn) and Volume (Million Units) Forecast, By Country, 2014–2024
Table 58: Asia Pacific PD Sanitary Pumps Market Size (US$ Mn) and Volume (Million Units) Forecast, By Country, 2014–2024
Table 59: Middle East and Africa PD Sanitary Pumps Market Size (US$ Mn) and Volume (Million Units) Forecast, By Country, 2014–2024
Table 60: Middle East and Africa PD Sanitary Pumps Market Size (US$ Mn) and Volume (Million Units) Forecast, By Country, 2014–2024
Table 61: Latin America PD Sanitary Pumps Market Size (US$ Mn) and Volume (Million Units) Forecast, by Country, 2014–2024
List of Figures
Figure 01: Global PD Sanitary Pumps Market Size (US$ Mn) and Volume (Million Units) Forecast, 2014–2024
Figure 02: Global PD Sanitary Pumps Market Size and Volume Y-o-Y Growth Projections, 2015–2024
Figure 03: Global Market Revenue Share Analysis, by Rotary PD Sanitary Pump Type, 2015 and 2024
Figure 04: Global Market Revenue Share Analysis, By Reciprocating PD Sanitary Pump Type, 2015 and 2024
Figure 05: Global Market Revenue Share Analysis by End-use, 2015 and 2024
Figure 06: Global Food & Beverage Market Revenue Share Analysis, By Rotary PD Sanitary Pump Type, 2015 and 2024
Figure 07: Global Food & Beverage Market Revenue Share Analysis, By Reciprocating PD Sanitary Pump Type, 2015 and 2024
Figure 08: Global Pharmaceutical Market Revenue Share Analysis By Rotary PD Sanitary Pump Type, 2015 and 2024
Figure 09: Global Pharmaceutical Market Revenue Share Analysis By Reciprocating PD Sanitary Pump Type, 2015 and 2024
Figure 10: Global Cosmetics Market Revenue Share Analysis, By Rotary PD Sanitary Pump Type, 2015 and 2024
Figure 11: Global Cosmetics Market Revenue Share Analysis, By Reciprocating PD Sanitary Pump Type, 2015 and 2024
Figure 12: Global Biotechnology Market Revenue Share Analysis, By Rotary PD Sanitary Pump Type, 2015 and 2024
Figure 13: Global Biotechnology Market Revenue Share Analysis, By Reciprocating PD Sanitary Pump Type, 2015 and 2024
Figure 14: Global Water Treatment Systems Market Revenue Share Analysis, By Rotary PD Sanitary Pump Type, 2015 and 2024
Figure 15: Global Water Treatment Systems Market Revenue Share Analysis, By Reciprocating PD Sanitary Pump Type, 2015 and 2024
Figure 16: Global Textile Market Revenue Share Analysis, By Rotary PD Sanitary Pump Type, 2015 and 2024
Figure 17: Global Textile Market Revenue Share Analysis, By Reciprocating PD Sanitary Pump Type, 2015 and 2024
Figure 18: Global Others Market Revenue Share Analysis, By Rotary PD Sanitary Pump Type, 2015 and 2024
Figure 19: Global Others Market Revenue Share Analysis, By Reciprocating PD Sanitary Pump Type, 2015 and 2024
Figure 20: North America PD Sanitary Pumps Market Size (US$ Mn) and Volume (Million Units) Forecast, 2014–2024
Figure 21: North America PD Sanitary Pumps Market Size and Volume Y-o-Y Growth Projections, 2015–2024
Figure 22: North America Market Revenue Share Analysis By Rotary PD Sanitary Pump Type, 2015 and 2024
Figure 23: North America Market Revenue Share Analysis By Reciprocating PD Sanitary Pump Type, 2015 and 2024
Figure 24: North America Market Revenue Share Analysis By End-use, 2015 and 2024
Figure 25: Europe PD Sanitary Pumps Market Size (US$ Mn) and Volume (Million Units) Forecast, 2014–2024
Figure 26: Europe PD Sanitary Pumps Market Size and Volume Y-o-Y Growth Projections, 2015–2024
Figure 27: Europe Market Revenue Share Analysis By Rotary PD Sanitary Pump Type, 2015 and 2024
Figure 28: Europe Market Revenue Share Analysis By Reciprocating PD Sanitary Pump Type, 2015 and 2024
Figure 29: Europe Market Revenue Share Analysis By End-use, 2015 and 2024
Figure 30: Asia Pacific PD Sanitary Pumps Market Size (US$ Mn) and Volume (Million Units) Forecast, 2014–2024
Figure 31: Asia Pacific PD Sanitary Pumps Market Size and Volume Y-o-Y Growth Projections, 2015–2024
Figure 32: Asia Pacific Market Revenue Share Analysis By Rotary PD Sanitary Pump Type, 2015 and 2024
Figure 33: Asia Pacific Market Revenue Share Analysis By Reciprocating PD Sanitary Pump Type, 2015 and 2024
Figure 34: Asia Pacific Market Revenue Share Analysis By End-use, 2015 and 2024
Figure 35: Middle East and Africa PD Sanitary Pumps Market Size (US$ Mn) and Volume (Million Units) Forecast, 2014–2024
Figure 36: Middle East and Africa PD Sanitary Pumps Market Size and Volume Y-o-Y Growth Projections, 2015–2024
Figure 37: Middle East and Africa Market Revenue Share Analysis By Rotary PD Sanitary Pump Type, 2015 and 2024
Figure 38: Middle East and Africa Market Revenue Share Analysis By Reciprocating PD Sanitary Pump Type, 2015 and 2024
Figure 39: Middle East and Africa Market Revenue Share Analysis By End-use, 2015 and 2024
Figure 40: Latin America PD Sanitary Pumps Market Size (US$ Mn) and Volume (Million Units) Forecast, 2014–2024
Figure 41: Latin America PD Sanitary Pumps Market Size and Volume Y-o-Y Growth Projections, 2015–2024
Figure 42: Latin America Market Revenue Share Analysis, by Rotary PD Sanitary Pump Type, 2015 and 2024
Figure 43: Latin America Market Revenue Share Analysis, by Reciprocating PD Sanitary Pump Type, 2015 and 2024
Figure 44: Latin America Market Revenue Share Analysis, by End-use, 2015 and 2024
Figure 45: North America Market Revenue Share Analysis By Country, 2015 and 2024
Figure 46: Europe Market Revenue Share Analysis By Country, 2015 and 2024
Figure 47: Asia Pacific Market Revenue Share Analysis By Country, 2015 and 2024
Figure 48: Middle East and Africa Market Revenue Share Analysis By Country, 2015 and 2024
Figure 49: Latin America Market Revenue Share Analysis, by Country, 2015 and 2024
Copyright © Transparency Market Research, Inc. All Rights reserved
Trust Online

Positive Displacement (PD) Sanitary Pumps Market