
Reports
Reports
Analysts’ Viewpoint on Optical Brighteners Market Scenario
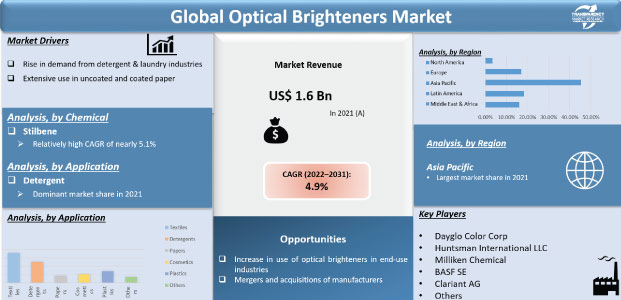
The global optical brighteners market is significantly driven by increase in applications in laundry detergents. Optical brighteners are extensively used in the paper industry in printing and writing paper grades, especially to increase brightness and whiteness. New technologies are being introduced in the market to produce optical brighteners. Certain polyols are added, such as high molecular weight polyethylene glycol or polyvinyl chlorides, to increase the efficiency and visibility of optical brighteners. Moreover, several initiatives can be taken by leading market players to produce low-cost optical brighteners. Manufacturers should focus on R&D to manufacture environment-friendly optical brighteners to gain more revenue opportunities. Applications of optical brighteners are increasing in food packaging paper, thereby offering lucrative opportunities for manufacturers.
Optical brighteners, or optical brightening agents (OBAs), are also known as fluorescent whitening agents (FWAs). Optical brighteners are hydrophilic water-soluble compounds. Applications of optical brighteners include textile, plastic, and paper industries. They also decreases the natural yellowing of products. Usage of optical brightener powder has increased significantly in end-use industries. The diversity of fiber types and fiber combinations has also greatly increased. Thus, presently, the processor has to deal with a wider range of application techniques. A brightener is almost always present in household detergents, white textiles, and white papers. Therefore, both processors and customers have been placing an ever-increasing demand on these goods owing to the development. Optical brighteners must be compatible with virtually all chemicals and auxiliaries used at various stages and must be utilized in various finishing procedures.
Rise in laundry and detergent applications due to consistent increase in population is driving the global optical brighteners market. Optical brighteners are widely used in laundry care. An optical brightener in laundry detergent transforms UV rays to enhance the blue light effect to make the clothes appear white. Therefore, the usage of optical brighteners in detergent is not likely to clean the clothes, but to make them appear whiter & brightener; and resistant to heat and chemical reactions. Easy usage of optical brighteners and their ability to make the fabric softer are key factors driving the global optical brighteners market. Additionally, optical brighteners are widely consumed in hospital laundry sections due to the high usage of white fabrics by hospitals and the medical sector.
In the paper industry, optical brightening agents are additives that improve the paper's natural whitening properties. These chemical substances release light in the blue range after absorbing light in the ultraviolet and violet region (generally between 340 and 370 nm) (typically 420-470 nm). They are employed in plastics, textiles, laundry detergents, in addition to paper. They are also referred to as artificial whiteners and optical brighteners. Optical brighteners can be applied either on the dry end, wet end, or both ends. Optical or fluorescent brighteners must include in the stock's wet end if internal brightness is to be achieved. Fluorescent brighteners are frequently used by paper manufacturers in surface coating the dry end of the size press or calendar stack. Dry end treatment is more cost-effective than wet end, because the chemical is applied to the fiber's outer surface rather than the entire interior to reflect UV light in the dry end. However, some manufacturers combine the wet and dry ends in their processing. Thus, the wide suitability and use of optical or fluorescent brighteners in the coated or uncoated paper industry is expected to drive the market.
Based on chemical, the global optical brighteners market has been segregated into stilbene, coumarin, diphenyl pyrazoline, and others. The stilbene segment held a prominent share of the market in 2021. It is likely to continue its dominance during the forecast period. Diphenyl pyrazoline is a consistently growing chemical segment of optical brighteners due to its key application as fluorescent brightening additives. The other types of optical brighteners are disulfonated optical brightening agents, hexasulfonated OBAS, etc.
Asia Pacific accounted for a key share of the global optical brighteners market in 2021. Asia Pacific held a value share of around 45% of the global optical brighteners market. The trend is projected to continue during the forecast period, majorly due to rise in demand for optical brighteners in countries such as China and India. In terms of market share, Europe followed Asia Pacific and held a significant share of the global optical brighteners market in 2021. This is expected to continue during the forecast period due to increase in presence of major manufacturers along with several established industries in the region. Latin America is anticipated to be an attractive market for optical brighteners owing to emerging applications of optical brighteners in various industries. The optical brighteners market in Middle East & Africa is likely to grow at a sluggish pace during the forecast period. Volatility in prices of optical brighteners is adversely affecting the market in the region, as several players are increasing the price of their optical brighteners products.
The global optical brighteners market is consolidated, with the presence of a few large-scale vendors that control majority of the share. Expansion of product portfolios and mergers and acquisitions are notable strategies adopted by key players. Dayglo Color Corp, Huntsman International LLC, Milliken Chemical, BASF SE, Clariant AG, and Rudolf GmbH are some of the prominent entities operating in the global optical brighteners market.
Each of these players has been profiled in the optical brighteners market report based on parameters such as company overview, financial overview, business strategies, product portfolio, business segments, and recent developments.
|
Attribute |
Detail |
|
Market Size Value in 2021 |
US$ 1.6 Bn |
|
Market Forecast Value in 2031 |
US$ 2.6 Bn |
|
Growth Rate (CAGR) |
4.9% |
|
Forecast Period |
2022–2031 |
|
Historical Data Available for |
2020 |
|
Quantitative Units |
US$ Bn for Value & Kilo Tons for Volume |
|
Market Analysis |
It includes cross segment analysis at global as well as regional level. Furthermore, qualitative analysis includes drivers, restraints, opportunities, key trends, Porter’s Five Forces analysis, value chain analysis, and key trend analysis. |
|
Competition Landscape |
|
|
Format |
Electronic (PDF) + Excel |
|
Market Segmentation |
|
|
Regions Covered |
|
|
Countries Covered |
|
|
Companies Profiled |
|
|
Customization Scope |
Available upon request |
|
Pricing |
Available upon request |
The global optical brighteners market stood at US$ 1.6 Bn in 2021
The global optical brighteners market is expected to grow at a CAGR of 4.9% from 2022 to 2031
Rise in demand for optical brighteners from detergent & laundry industries, and extensive use of optical brighteners in coated and uncoated paper
Stilbene was the largest chemical type segment that held 14.3 % value share in 2021
Asia Pacific was the most lucrative region and held value share of 45% the optical brighteners market in 2021
Dayglo Color Corp, Huntsman International LLC, Milliken Chemical, BASF SE, Clariant AG, and Rudolf GmbH
1. Executive Summary
1.1. Optical Brighteners Market Snapshot
1.2. Current Market and Future Potential
2. Market Overview
2.1. Market Segmentation
2.2. Market Trends
2.3. Market Dynamics
2.3.1. Drivers
2.3.2. Restraints
2.3.3. Opportunities
2.4. Porter’s Five Forces Analysis
2.5. Regulatory Analysis
2.6. Value Chain Analysis
2.6.1. List of Raw Materials Providers
2.6.2. List of Optical Brighteners Manufacturers
2.6.3. List of Dealers/Distributors
2.6.4. List of Potential Customer
3. COVID-19 Impact Analysis
4. Optical Brighteners Market Analysis and Forecast, by Chemical, 2022–2031
4.1. Introduction and Definitions
4.2. Global Optical Brighteners Market Volume (Kilo Tons) and Value (US$ Bn) Forecast, by Chemical, 2022–2031
4.2.1. Stilbene
4.2.2. Coumarin
4.2.3. Diphenyl Pyrazoline
4.2.4. Others
4.3. Global Optical Brighteners Market Attractiveness, by Chemical
5. Global Optical Brighteners Market Analysis and Forecast, Application, 2022–2031
5.1. Introduction and Definitions
5.2. Global Optical Brighteners Market Volume (Kilo Tons) and Value (US$ Bn) Forecast, by Application, 2022–2031
5.2.1. Detergents
5.2.2. Textiles
5.2.3. Papers
5.2.4. Cosmetics
5.2.5. Plastics
5.2.6. Others
5.3. Global Optical Brighteners Market Attractiveness, by Application
6. Global Optical Brighteners Market Analysis and Forecast, by Region, 2022–2031
6.1. Key Findings
6.2. Global Optical Brighteners Market Volume (Kilo Tons) and Value (US$ Bn) Forecast, by Region, 2022–2031
6.2.1. North America
6.2.2. Europe
6.2.3. Asia Pacific
6.2.4. Latin America
6.2.5. Middle East & Africa
6.3. Global Optical Brighteners Market Attractiveness, by Region
7. North America Optical Brighteners Market Analysis and Forecast, 2022–2031
7.1. Key Findings
7.2. North America Optical Brighteners Market Volume (Kilo Tons) and Value (US$ Bn) Forecast, by Chemical, 2022–2031
7.3. North America Optical Brighteners Market Volume (Kilo Tons) and Value (US$ Bn) Forecast, by Application, 2022–2031
7.4. North America Optical Brighteners Market Volume (Kilo Tons) and Value (US$ Bn) Forecast, by Country, 2022–2031
7.4.1. U.S. Optical Brighteners Market Volume (Kilo Tons) and Value (US$ Bn) Forecast, by Chemical, 2022–2031
7.4.2. U.S. Optical Brighteners Market Volume (Kilo Tons) and Value (US$ Bn) Forecast, Application, 2022–2031
7.4.3. Canada Optical Brighteners Market Volume (Kilo Tons) and Value (US$ Bn) Forecast, by Chemical, 2022–2031
7.4.4. Canada Optical Brighteners Market Volume (Kilo Tons) and Value (US$ Bn) Forecast, Application, 2022–2031
7.5. North America Optical Brighteners Market Attractiveness Analysis
8. Europe Optical Brighteners Market Analysis and Forecast, 2022–2031
8.1. Key Findings
8.2. Europe Optical Brighteners Market Volume (Kilo Tons) and Value (US$ Bn) Forecast, by Chemical, 2022–2031
8.3. Europe Optical Brighteners Market Volume (Kilo Tons) and Value (US$ Bn) Forecast, by Application, 2022–2031
8.4. Europe Optical Brighteners Market Volume (Kilo Tons) and Value (US$ Bn) Forecast, by Country and Sub-region, 2021-2031
8.4.1. Germany Optical Brighteners Market Volume (Kilo Tons) and Value (US$ Bn) Forecast, by Chemical, 2022–2031
8.4.2. Germany. Optical Brighteners Market Volume (Kilo Tons) and Value (US$ Bn) Forecast, Application, 2022–2031
8.4.3. France Optical Brighteners Market Volume (Kilo Tons) and Value (US$ Bn) Forecast, by Chemical, 2022–2031
8.4.4. France. Optical Brighteners Market Volume (Kilo Tons) and Value (US$ Bn) Forecast, Application, 2022–2031
8.4.5. U.K. Optical Brighteners Market Volume (Kilo Tons) and Value (US$ Bn) Forecast, by Chemical, 2022–2031
8.4.6. U.K. Optical Brighteners Market Volume (Kilo Tons) and Value (US$ Bn) Forecast, Application, 2022–2031
8.4.7. Italy Optical Brighteners Market Volume (Kilo Tons) and Value (US$ Bn) Forecast, by Chemical, 2022–2031
8.4.8. Italy Optical Brighteners Market Volume (Kilo Tons) and Value (US$ Bn) Forecast, Application, 2022–2031
8.4.9. Russia & CIS Optical Brighteners Market Volume (Kilo Tons) and Value (US$ Bn) Forecast, by Chemical, 2022–2031
8.4.10. Russia & CIS Optical Brighteners Market Volume (Kilo Tons) and Value (US$ Bn) Forecast, Application, 2022–2031
8.4.11. Rest of Europe Optical Brighteners Market Volume (Kilo Tons) and Value (US$ Bn) Forecast, by Chemical, 2022–2031
8.4.12. Rest of Europe Optical Brighteners Market Volume (Kilo Tons) and Value (US$ Bn) Forecast, Application, 2022–2031
8.5. Europe Optical Brighteners Market Attractiveness Analysis
9. Asia Pacific Optical Brighteners Market Analysis and Forecast, 2022–2031
9.1. Key Findings
9.2. Asia Pacific Optical Brighteners Market Volume (Kilo Tons) and Value (US$ Bn) Forecast, by Chemical
9.3. Asia Pacific Optical Brighteners Market Volume (Kilo Tons) and Value (US$ Bn) Forecast, by Application, 2022–2031
9.4. Asia Pacific Optical Brighteners Market Volume (Kilo Tons) and Value (US$ Bn) Forecast, by Country and Sub-region, 2021-2031
9.4.1. China Optical Brighteners Market Volume (Kilo Tons) and Value (US$ Bn) Forecast, by Chemical, 2022–2031
9.4.2. China Optical Brighteners Market Volume (Kilo Tons) and Value (US$ Bn) Forecast, Application, 2022–2031
9.4.3. Japan Optical Brighteners Market Volume (Kilo Tons) and Value (US$ Bn) Forecast, by Chemical, 2022–2031
9.4.4. Japan Optical Brighteners Market Volume (Kilo Tons) and Value (US$ Bn) Forecast, Application, 2022–2031
9.4.5. India Optical Brighteners Market Volume (Kilo Tons) and Value (US$ Bn) Forecast, by Chemical, 2022–2031
9.4.6. India Optical Brighteners Market Volume (Kilo Tons) and Value (US$ Bn) Forecast, Application, 2022–2031
9.4.7. ASEAN Optical Brighteners Market Volume (Kilo Tons) and Value (US$ Bn) Forecast, by Chemical, 2022–2031
9.4.8. ASEAN Optical Brighteners Market Volume (Kilo Tons) and Value (US$ Bn) Forecast, Application, 2022–2031
9.4.9. Rest of Asia Pacific Optical Brighteners Market Volume (Kilo Tons) and Value (US$ Bn) Forecast, by Chemical, 2022–2031
9.4.10. Rest of Asia Pacific Optical Brighteners Market Volume (Kilo Tons) and Value (US$ Bn) Forecast, Application, 2022–2031
9.5. Asia Pacific Optical Brighteners Market Attractiveness Analysis
10. Latin America Optical Brighteners Market Analysis and Forecast, 2022–2031
10.1. Key Findings
10.2. Latin America Optical Brighteners Market Volume (Kilo Tons) and Value (US$ Bn) Forecast, by Chemical, 2022–2031
10.3. Latin America Optical Brighteners Market Volume (Kilo Tons) and Value (US$ Bn) Forecast, by Application, 2022–2031
10.4. Latin America Optical Brighteners Market Volume (Kilo Tons) and Value (US$ Bn) Forecast, by Country and Sub-region, 2021-2031
10.4.1. Brazil Optical Brighteners Market Volume (Kilo Tons) and Value (US$ Bn) Forecast, by Chemical, 2022–2031
10.4.2. Brazil Optical Brighteners Market Volume (Kilo Tons) and Value (US$ Bn) Forecast, Application, 2022–2031
10.4.3. Mexico Optical Brighteners Market Volume (Kilo Tons) and Value (US$ Bn) Forecast, by Chemical, 2022–2031
10.4.4. Mexico Optical Brighteners Market Volume (Kilo Tons) and Value (US$ Bn) Forecast, Application, 2022–2031
10.4.5. Rest of Latin America Optical Brighteners Market Volume (Kilo Tons) and Value (US$ Bn) Forecast, by Chemical, 2022–2031
10.4.6. Rest of Latin America Optical Brighteners Market Volume (Kilo Tons) and Value (US$ Bn) Forecast, Application, 2022–2031
10.5. Latin America Optical Brighteners Market Attractiveness Analysis
11. Middle East & Africa Optical Brighteners Market Analysis and Forecast, 2022–2031
11.1. Key Findings
11.2. Middle East & Africa Optical Brighteners Market Volume (Kilo Tons) and Value (US$ Bn) Forecast, by Chemical, 2022–2031
11.3. Middle East & Africa Optical Brighteners Market Volume (Kilo Tons) and Value (US$ Bn) Forecast, by Application, 2022–2031
11.4. Middle East & Africa Optical Brighteners Market Volume (Kilo Tons) and Value (US$ Bn) Forecast, by Country and Sub-region, 2021-2031
11.4.1. GCC Optical Brighteners Market Volume (Kilo Tons) and Value (US$ Bn) Forecast, by Chemical, 2022–2031
11.4.2. GCC Optical Brighteners Market Volume (Kilo Tons) and Value (US$ Bn) Forecast, Application, 2022–2031
11.4.3. South Africa Optical Brighteners Market Volume (Kilo Tons) and Value (US$ Bn) Forecast, by Chemical, 2022–2031
11.4.4. South Africa Optical Brighteners Market Volume (Kilo Tons) and Value (US$ Bn) Forecast, Application, 2022–2031
11.4.5. Rest of Middle East & Africa Optical Brighteners Market Volume (Kilo Tons) and Value (US$ Bn) Forecast, by Chemical, 2022–2031
11.4.6. Rest of Middle East & Africa Optical Brighteners Market Volume (Kilo Tons) and Value (US$ Bn) Forecast, Application, 2022–2031
11.5. Middle East & Africa Optical Brighteners Market Attractiveness Analysis
12. Competition Landscape
12.1. Global Optical Brighteners Company Market Share Analysis, 2021
12.2. Company Profiles (Details – Overview, Financials, Recent Developments, and Strategy)
12.2.1. Dayglo Color Corp
12.2.1.1. Company Description
12.2.1.2. Business Overview
12.2.1.3. Financial Overview
12.2.1.4. Strategic Overview
12.2.2. Huntsman International LLC
12.2.2.1. Company Description
12.2.2.2. Business Overview
12.2.2.3. Financial Overview
12.2.2.4. Strategic Overview
12.2.3. BASF SE
12.2.3.1. Company Description
12.2.3.2. Business Overview
12.2.3.3. Financial Overview
12.2.3.4. Strategic Overview
12.2.4. Clariant AG
12.2.4.1. Company Description
12.2.4.2. Business Overview
12.2.4.3. Financial Overview
12.2.4.4. Strategic Overview
12.2.5. Rudolf GmbH
12.2.5.1. Company Description
12.2.5.2. Business Overview
12.2.5.3. Financial Overview
12.2.5.4. Strategic Overview
12.2.6. Aron Universal Limited
12.2.6.1. Company Description
12.2.6.2. Business Overview
12.2.6.3. Financial Overview
12.2.6.4. Strategic Overview
12.2.7. Archroma Brand & Performance Textile Specialties
12.2.7.1. Company Description
12.2.7.2. Business Overview
12.2.7.3. Financial Overview
12.2.7.4. Strategic Overview
12.2.8. Meghmani Group
12.2.8.1. Company Description
12.2.8.2. Business Overview
12.2.8.3. Financial Overview
12.2.8.4. Strategic Overview
12.2.9. Brilliant Group
12.2.9.1. Company Description
12.2.9.2. Business Overview
12.2.9.3. Financial Overview
12.2.9.4. Strategic Overview
12.2.10. Blankophor GmbH & Co. KG
12.2.10.1. Company Description
12.2.10.2. Business Overview
12.2.10.3. Financial Overview
12.2.10.4. Strategic Overview
12.2.11. Paramount Minerals & Chemicals Limited
12.2.11.1. Company Description
12.2.11.2. Business Overview
12.2.11.3. Financial Overview
12.2.11.4. Strategic Overview
12.2.12. Kolorjet Chemicals Pvt Ltd.
12.2.12.1. Company Description
12.2.12.2. Business Overview
12.2.12.3. Financial Overview
12.2.12.4. Strategic Overview
13. Primary Research: Key Insights
14. Appendix
List of Tables
Table 1: Global Optical Brighteners Market Volume (Kilo Tons) Forecast, by Chemical, 2022–2031
Table 2: Global Optical Brighteners Market Value (US$ Bn) Forecast, by Chemical, 2022–2031
Table 3: Global Optical Brighteners Market Volume (Kilo Tons) Forecast, by Application, 2022–2031
Table 4: Global Optical Brighteners Market Value (US$ Bn) Forecast, by Application, 2022–2031
Table 5: Global Optical Brighteners Market Volume (Kilo Tons) Forecast, by Region, 2022–2031
Table 6: Global Optical Brighteners Market Value (US$ Bn) Forecast, by Region, 2022–2031
Table 7: North America Optical Brighteners Market Volume (Kilo Tons) Forecast, by Chemical, 2022–2031
Table 8: North America Optical Brighteners Market Value (US$ Bn) Forecast, by Chemical, 2022–2031
Table 9: North America Optical Brighteners Market Volume (Kilo Tons) Forecast, by Application, 2022–2031
Table 10: North America Optical Brighteners Market Value (US$ Bn) Forecast, by Application, 2022–2031
Table 11: North America Optical Brighteners Market Volume (Kilo Tons) Forecast, by Country, 2022–2031
Table 12: North America Optical Brighteners Market Value (US$ Bn) Forecast, by Country, 2022–2031
Table 13: U.S. Optical Brighteners Market Volume (Kilo Tons) Forecast, by Chemical, 2022–2031
Table 14: U.S. Optical Brighteners Market Value (US$ Bn) Forecast, by Chemical, 2022–2031
Table 15: U.S. Optical Brighteners Market Volume (Kilo Tons) Forecast, by Application, 2022–2031
Table 16: U.S. Optical Brighteners Market Value (US$ Bn) Forecast, by Application, 2022–2031
Table 17: Canada Optical Brighteners Market Volume (Kilo Tons) Forecast, by Chemical, 2022–2031
Table 18: Canada Optical Brighteners Market Value (US$ Bn) Forecast, by Chemical, 2022–2031
Table 19: Canada Optical Brighteners Market Volume (Kilo Tons) Forecast, by Application, 2022–2031
Table 20: Canada Optical Brighteners Market Value (US$ Bn) Forecast, by Application 2022–2031
Table 21: Europe Optical Brighteners Market Volume (Kilo Tons) Forecast, by Chemical, 2022–2031
Table 22: Europe Optical Brighteners Market Value (US$ Bn) Forecast, by Chemical, 2022–2031
Table 23: Europe Optical Brighteners Market Volume (Kilo Tons) Forecast, by Application, 2022–2031
Table 24: Europe Optical Brighteners Market Value (US$ Bn) Forecast, by Application 2022–2031
Table 25: Europe Optical Brighteners Market Volume (Kilo Tons) Forecast, by Country and Sub-region, 2022–2031
Table 26: Europe Optical Brighteners Market Value (US$ Bn) Forecast, by Country and Sub-region, 2022–2031
Table 27: Germany Optical Brighteners Market Volume (Kilo Tons) Forecast, by Chemical, 2022–2031
Table 28: Germany Optical Brighteners Market Value (US$ Bn) Forecast, by Chemical, 2022–2031
Table 29: Germany Optical Brighteners Market Volume (Kilo Tons) Forecast, by Application, 2022–2031
Table 30: Germany Optical Brighteners Market Value (US$ Bn) Forecast, by Application 2022–2031
Table 31: France Optical Brighteners Market Volume (Kilo Tons) Forecast, by Chemical, 2022–2031
Table 32: France Optical Brighteners Market Value (US$ Bn) Forecast, by Chemical, 2022–2031
Table 33: France Optical Brighteners Market Volume (Kilo Tons) Forecast, by Application, 2022–2031
Table 34: France Optical Brighteners Market Value (US$ Bn) Forecast, by Application 2022–2031
Table 35: U.K. Optical Brighteners Market Volume (Kilo Tons) Forecast, by Chemical, 2022–2031
Table 36: U.K. Optical Brighteners Market Value (US$ Bn) Forecast, by Chemical, 2022–2031
Table 37: U.K. Optical Brighteners Market Volume (Kilo Tons) Forecast, by Application, 2022–2031
Table 38: U.K. Optical Brighteners Market Value (US$ Bn) Forecast, by Application 2022–2031
Table 39: Italy Optical Brighteners Market Volume (Kilo Tons) Forecast, by Chemical, 2022–2031
Table 40: Italy Optical Brighteners Market Value (US$ Bn) Forecast, by Chemical, 2022–2031
Table 41: Italy Optical Brighteners Market Volume (Kilo Tons) Forecast, by Application, 2022–2031
Table 42: Italy Optical Brighteners Market Value (US$ Bn) Forecast, by Application 2022–2031
Table 43: Spain Optical Brighteners Market Volume (Kilo Tons) Forecast, by Chemical, 2022–2031
Table 44: Spain Optical Brighteners Market Value (US$ Bn) Forecast, by Chemical, 2022–2031
Table 45: Spain Optical Brighteners Market Volume (Kilo Tons) Forecast, by Application, 2022–2031
Table 46: Spain Optical Brighteners Market Value (US$ Bn) Forecast, by Application 2022–2031
Table 47: Russia & CIS Optical Brighteners Market Volume (Kilo Tons) Forecast, by Chemical, 2022–2031
Table 48: Russia & CIS Optical Brighteners Market Value (US$ Bn) Forecast, by Chemical, 2022–2031
Table 49: Russia & CIS Optical Brighteners Market Volume (Kilo Tons) Forecast, by Application, 2022–2031
Table 50: Russia & CIS Optical Brighteners Market Value (US$ Bn) Forecast, by Application 2022–2031
Table 51: Rest of Europe Optical Brighteners Market Volume (Kilo Tons) Forecast, by Chemical, 2022–2031
Table 52: Rest of Europe Optical Brighteners Market Value (US$ Bn) Forecast, by Chemical, 2022–2031
Table 53: Rest of Europe Optical Brighteners Market Volume (Kilo Tons) Forecast, by Application, 2022–2031
Table 54: Rest of Europe Optical Brighteners Market Value (US$ Bn) Forecast, by Application 2022–2031
Table 55: Asia Pacific Optical Brighteners Market Volume (Kilo Tons) Forecast, by Chemical, 2022–2031
Table 56: Asia Pacific Optical Brighteners Market Value (US$ Bn) Forecast, by Chemical, 2022–2031
Table 57: Asia Pacific Optical Brighteners Market Volume (Kilo Tons) Forecast, by Application, 2022–2031
Table 58: Asia Pacific Optical Brighteners Market Value (US$ Bn) Forecast, by Application 2022–2031
Table 59: Asia Pacific Optical Brighteners Market Volume (Kilo Tons) Forecast, by Country and Sub-region, 2022–2031
Table 60: Asia Pacific Optical Brighteners Market Value (US$ Bn) Forecast, by Country and Sub-region, 2022–2031
Table 61: China Optical Brighteners Market Volume (Kilo Tons) Forecast, by Chemical, 2022–2031
Table 62: China Optical Brighteners Market Value (US$ Bn) Forecast, by Chemical 2022–2031
Table 63: China Optical Brighteners Market Volume (Kilo Tons) Forecast, by Application, 2022–2031
Table 64: China Optical Brighteners Market Value (US$ Bn) Forecast, by Application 2022–2031
Table 65: Japan Optical Brighteners Market Volume (Kilo Tons) Forecast, by Chemical, 2022–2031
Table 66: Japan Optical Brighteners Market Value (US$ Bn) Forecast, by Chemical, 2022–2031
Table 67: Japan Optical Brighteners Market Volume (Kilo Tons) Forecast, by Application, 2022–2031
Table 68: Japan Optical Brighteners Market Value (US$ Bn) Forecast, by Application 2022–2031
Table 69: India Optical Brighteners Market Volume (Kilo Tons) Forecast, by Chemical, 2022–2031
Table 70: India Optical Brighteners Market Value (US$ Bn) Forecast, by Chemical, 2022–2031
Table 71: India Optical Brighteners Market Volume (Kilo Tons) Forecast, by Application, 2022–2031
Table 72: India Optical Brighteners Market Value (US$ Bn) Forecast, by Application 2022–2031
Table 73: ASEAN Optical Brighteners Market Volume (Kilo Tons) Forecast, by Chemical, 2022–2031
Table 74: ASEAN Optical Brighteners Market Value (US$ Bn) Forecast, by Chemical, 2022–2031
Table 75: ASEAN Optical Brighteners Market Volume (Kilo Tons) Forecast, by Application, 2022–2031
Table 76: ASEAN Optical Brighteners Market Value (US$ Bn) Forecast, by Application 2022–2031
Table 77: Rest of Asia Pacific Optical Brighteners Market Volume (Kilo Tons) Forecast, by Chemical, 2022–2031
Table 78: Rest of Asia Pacific Optical Brighteners Market Value (US$ Bn) Forecast, by Chemical, 2022–2031
Table 79: Rest of Asia Pacific Optical Brighteners Market Volume (Kilo Tons) Forecast, by Application, 2022–2031
Table 80: Rest of Asia Pacific Optical Brighteners Market Value (US$ Bn) Forecast, by Application 2022–2031
Table 81: Latin America Optical Brighteners Market Volume (Kilo Tons) Forecast, by Chemical, 2022–2031
Table 82: Latin America Optical Brighteners Market Value (US$ Bn) Forecast, by Chemical, 2022–2031
Table 83: Latin America Optical Brighteners Market Volume (Kilo Tons) Forecast, by Application, 2022–2031
Table 84: Latin America Optical Brighteners Market Value (US$ Bn) Forecast, by Application 2022–2031
Table 85: Latin America Optical Brighteners Market Volume (Kilo Tons) Forecast, by Country and Sub-region, 2022–2031
Table 86: Latin America Optical Brighteners Market Value (US$ Bn) Forecast, by Country and Sub-region, 2022–2031
Table 87: Brazil Optical Brighteners Market Volume (Kilo Tons) Forecast, by Chemical, 2022–2031
Table 88: Brazil Optical Brighteners Market Value (US$ Bn) Forecast, by Chemical, 2022–2031
Table 89: Brazil Optical Brighteners Market Volume (Kilo Tons) Forecast, by Application, 2022–2031
Table 90: Brazil Optical Brighteners Market Value (US$ Bn) Forecast, by Application 2022–2031
Table 91: Mexico Optical Brighteners Market Volume (Kilo Tons) Forecast, by Chemical, 2022–2031
Table 92: Mexico Optical Brighteners Market Value (US$ Bn) Forecast, by Chemical, 2022–2031
Table 93: Mexico Optical Brighteners Market Volume (Kilo Tons) Forecast, by Application, 2022–2031
Table 94: Mexico Optical Brighteners Market Value (US$ Bn) Forecast, by Application 2022–2031
Table 95: Rest of Latin America Optical Brighteners Market Volume (Kilo Tons) Forecast, by Chemical, 2022–2031
Table 96: Rest of Latin America Optical Brighteners Market Value (US$ Bn) Forecast, by Chemical, 2022–2031
Table 97: Rest of Latin America Optical Brighteners Market Volume (Kilo Tons) Forecast, by Application, 2022–2031
Table 98: Rest of Latin America Optical Brighteners Market Value (US$ Bn) Forecast, by Application 2022–2031
Table 99: Middle East & Africa Optical Brighteners Market Volume (Kilo Tons) Forecast, by Chemical, 2022–2031
Table 100: Middle East & Africa Optical Brighteners Market Value (US$ Bn) Forecast, by Chemical, 2022–2031
Table 101: Middle East & Africa Optical Brighteners Market Volume (Kilo Tons) Forecast, by Application, 2022–2031
Table 102: Middle East & Africa Optical Brighteners Market Value (US$ Bn) Forecast, by Application 2022–2031
Table 103: Middle East & Africa Optical Brighteners Market Volume (Kilo Tons) Forecast, by Country and Sub-region, 2022–2031
Table 104: Middle East & Africa Optical Brighteners Market Value (US$ Bn) Forecast, by Country and Sub-region, 2022–2031
Table 105: GCC Optical Brighteners Market Volume (Kilo Tons) Forecast, by Chemical, 2022–2031
Table 106: GCC Optical Brighteners Market Value (US$ Bn) Forecast, by Chemical, 2022–2031
Table 107: GCC Optical Brighteners Market Volume (Kilo Tons) Forecast, by Application, 2022–2031
Table 108: GCC Optical Brighteners Market Value (US$ Bn) Forecast, by Application 2022–2031
Table 109: South Africa Optical Brighteners Market Volume (Kilo Tons) Forecast, by Chemical, 2022–2031
Table 110: South Africa Optical Brighteners Market Value (US$ Bn) Forecast, by Chemical, 2022–2031
Table 111: South Africa Optical Brighteners Market Volume (Kilo Tons) Forecast, by Application, 2022–2031
Table 112: South Africa Optical Brighteners Market Value (US$ Bn) Forecast, by Application 2022–2031
Table 113: Rest of Middle East & Africa Optical Brighteners Market Volume (Kilo Tons) Forecast, by Chemical, 2022–2031
Table 114: Rest of Middle East & Africa Optical Brighteners Market Value (US$ Bn) Forecast, by Chemical, 2022–2031
Table 115: Rest of Middle East & Africa Optical Brighteners Market Volume (Kilo Tons) Forecast, by Application, 2022–2031
Table 116: Rest of Middle East & Africa Optical Brighteners Market Value (US$ Bn) Forecast, by Application 2022–2031
List of Figures
Figure 1: Global Optical Brighteners Market Volume Share Analysis, by Chemical, 2021, 2025, and 2031
Figure 2: Global Optical Brighteners Market Attractiveness, by Chemical
Figure 3: Global Optical Brighteners Market Volume Share Analysis, by Application, 2021, 2025, and 2031
Figure 4: Global Optical Brighteners Market Attractiveness, by Application
Figure 5: Global Optical Brighteners Market Volume Share Analysis, by Region, 2021, 2025, and 2031
Figure 6: Global Optical Brighteners Market Attractiveness, by Region
Figure 7: North America Optical Brighteners Market Volume Share Analysis, by Chemical, 2021, 2025, and 2031
Figure 8: North America Optical Brighteners Market Attractiveness, by Chemical
Figure 9: North America Optical Brighteners Market Attractiveness, by Chemical
Figure 10: North America Optical Brighteners Market Volume Share Analysis, by Application, 2021, 2025, and 2031
Figure 11: North America Optical Brighteners Market Attractiveness, by Application
Figure 12: North America Optical Brighteners Market Attractiveness, by Country and Sub-region
Figure 13: Europe Optical Brighteners Market Volume Share Analysis, by Chemical, 2021, 2025, and 2031
Figure 14: Europe Optical Brighteners Market Attractiveness, by Chemical
Figure 15: Europe Optical Brighteners Market Volume Share Analysis, by Application, 2021, 2025, and 2031
Figure 16: Europe Optical Brighteners Market Attractiveness, by Application
Figure 17: Europe Optical Brighteners Market Volume Share Analysis, by Country and Sub-region, 2021, 2025, and 2031
Figure 18: Europe Optical Brighteners Market Attractiveness, by Country and Sub-region
Figure 19: Asia Pacific Optical Brighteners Market Volume Share Analysis, by Chemical, 2021, 2025, and 2031
Figure 20: Asia Pacific Optical Brighteners Market Attractiveness, by Chemical
Figure 21: Asia Pacific Optical Brighteners Market Volume Share Analysis, by Application, 2021, 2025, and 2031
Figure 22: Asia Pacific Optical Brighteners Market Attractiveness, by Application
Figure 23: Asia Pacific Optical Brighteners Market Volume Share Analysis, by Country and Sub-region, 2021, 2025, and 2031
Figure 24: Asia Pacific Optical Brighteners Market Attractiveness, by Country and Sub-region
Figure 25: Latin America Optical Brighteners Market Volume Share Analysis, by Chemical, 2021, 2025, and 2031
Figure 26: Latin America Optical Brighteners Market Attractiveness, by Chemical
Figure 27: Latin America Optical Brighteners Market Volume Share Analysis, by Application, 2021, 2025, and 2031
Figure 28: Latin America Optical Brighteners Market Attractiveness, by Application
Figure 29: Latin America Optical Brighteners Market Volume Share Analysis, by Country and Sub-region, 2021, 2025, and 2031
Figure 30: Latin America Optical Brighteners Market Attractiveness, by Country and Sub-region
Figure 31: Middle East & Africa Optical Brighteners Market Volume Share Analysis, by Chemical, 2021, 2025, and 2031
Figure 32: Middle East & Africa Optical Brighteners Market Attractiveness, by Chemical
Figure 33: Middle East & Africa Optical Brighteners Market Volume Share Analysis, by Application, 2021, 2025, and 2031
Figure 34: Middle East & Africa Optical Brighteners Market Attractiveness, by Application
Figure 35: Middle East & Africa Optical Brighteners Market Volume Share Analysis, by Country and Sub-region, 2021, 2025, and 2031
Figure 36: Middle East & Africa Optical Brighteners Market Attractiveness, by Country and Sub-region
Copyright © Transparency Market Research, Inc. All Rights reserved
Trust Online

Optical Brighteners Market