
Reports
Reports
IT asset management has grown in significance and scope for managing the overall lifecycle of IT assets across several industries. The management has moved beyond inventorying of IT assets to decision making for maximizing business value of the technology. IT asset management has come now to empower organizations to undertake financial, inventory, contractual, and risk management responsibilities for optimizing value from total IT asset footprint. Some of the key goals of demand for products in the IT asset management (ITAM) software market are several. Key goals are to reduce overhead costs of the IT environment, license allocation and compliance risks, and improve procurement of hardware, software, and other IT assets.
The study on the ITAM software market has pegged the valuation of US$708.9 mn in 2015. The market valuation is projected to reach US$1.3 bn by 2024-end, rising at CAGR of 6.9% during the forecast period of 2016–2024.
In large organizations, IT asset management software were deployed by large organizations mainly to meet the objectives of IT compliance and licensing management. Over the years, as the practices of IT asset management evolved over the years, the objectives also became broader. In recent years, players in the ITAM software market have also garnered gained from medium- and small-organizations. The end-use segment is emerging as a lucrative as ITAM plays a significant role for boosting the return on investment (RoI) of their IT assets.
The study makes an in-depth assessment of the various deployment types and divided these into three: on-premise, cloud, and hybrid. Of these, cloud-based deployment is anticipated is generate sizable revenues to players in the ITAM software market. The cost-effectiveness of various cloud models, including SaaS offering, notably among SMEs underpins the preference of cloud solutions. Moreover, the adoption of hybrid cloud is growing markedly across businesses of all end-use industries.
Key end-use industries scrutinized in the study on the ITAM software market are transportation, banking, financial services, and insurance, telecom and IT, manufacturing, government, healthcare, and energy and utilities. Of these, telecom and IT sector accounted for a major share of the global market in 2015. The revenues from the segment are estimated to grow at a remarkable pace until 2024. IT organizations are extensively utilizing these for application in license and subscription compliance. Businesses in the telecom industry are using ITAM software for reducing the total cost of ownership of IT assets.
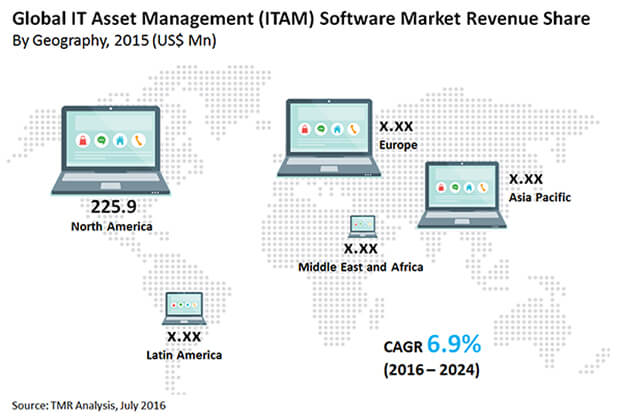
The various regional markets of IT asset management software market are Latin America, North America, Asia Pacific, Europe, and the Middle East and Africa. Of these, North America held a major share in 2015. The regional market is projected to retain its lead during the forecast period.
Rise in adoption of ITAM software for IT compliance and licensing management in various end-use industries has generated vast revenue gains to players in the North America ITAM software market. The growing trend of automation of asset management has spurred demand for ITAM software.
Asia Pacific is emerging as a potentially lucrative regional market during the forecast period. China, South Korea, Singapore, Japan, and India are expected to generate sizable revenue prospects to players in the Asia Pacific ITAM software market. SMEs in particular are keen on adopting ITAM software. The increased focus on ITAM software for maximizing the business value of IT assets has spurred investments in the regional market. Tracking software that helps SMEs to manage asset lifecycle costs has played a crucial role in optimizing the return on investment (RoI).
Some of the key players in the ITAM software market are CA Technology Inc., Snow Software, Flexera Software LLC, Cherwell Software, Aspera Technologies Inc., LANDESK Software, BDNA Corporation, ServiceNow Inc., BMC Software Inc., Hewlett Packard Enterprise Development LP, Oracle Corp., and IBM Corporation.
1. Preface
1.1. Research Scope
1.2. Market Segmentation
1.3. Key Research Objectives
2. Assumptions and Research Methodology
3. Executive Summary : Global IT Asset Management (ITAM) Software Market
4. Market Overview
4.1. Market Dynamics
4.1.1. Drivers
4.1.2. Restraints
4.1.3. Opportunity
4.2. Key Findings
4.3. Market Outlook
5. Global IT Asset Management (ITAM) Software Market Analysis and Forecasts, By Enterprise Size
5.1. Introduction
5.2. Key Findings
5.3. Market Value Share Analysis
5.4. Market Size (US$ Mn) Forecast By Enterprise Size
5.4.1. SME, 2014 – 2024 (US$ Mn)
5.4.2. Large Enterprises, 2014 – 2024 (US$ Mn)
6. Global IT Asset Management (ITAM) Software Market Analysis and Forecasts, By Deployment Type
6.1. Introduction
6.2. Market Value Share Analysis
6.3. Market Size (US$ Mn) Forecast By Deployment Type
6.3.1. On Premise, 2014 – 2024 (US$ Mn)
6.3.2. Cloud Based (Public and Private), 2014 – 2024 (US$ Mn)
6.3.3. Hybrid, 2014 – 2024 (US$ Mn)
7. Global IT Asset Management (ITAM) Software Market Analysis and Forecasts, By End-Use Type
7.1. Introduction
7.2. Key Findings / Developments
7.3. Market Size (US$ Mn) Forecast By End – Use Type
7.3.1. BFSI, 2014 – 2024 (US$ Mn)
7.3.2. Telecom and IT, 2014 – 2024 (US$ Mn)
7.3.3. Healthcare, 2014 – 2024 (US$ Mn)
7.3.4. Transportation, 2014 – 2024 (US$ Mn)
7.3.5. Government, 2014 – 2024 (US$ Mn)
7.3.6. Energy and Utilities, 2014 – 2024 (US$ Mn)`
7.3.7. Manufacturing, 2014 – 2024 (US$ Mn)
7.3.8. Others, 2014 – 2024 (US$ Mn)
8. Global IT Asset Management (ITAM) Software Market Analysis and Forecasts, By Region
8.1. Introduction
8.2. Key Findings
8.3. Market Value Share Analysis
8.4. Market Size (US$ Mn) Forecast By Region
8.4.1. North America
8.4.2. Europe
8.4.3. Asia Pacific
8.4.4. Middle East and Africa
8.4.5. South America
9. North America IT Asset Management (ITAM) Software Market Analysis and Forecasts
9.1. Introduction
9.2. Key Findings
9.3. Market Value Share Analysis
9.4. Market Size (US$ Mn) Forecast By Enterprise Size
9.4.1. SME, 2014 – 2024 (US$ Mn)
9.4.2. Large Enterprises, 2014 – 2024 (US$ Mn)
9.5. Market Size (US$ Mn) Forecast By Deployment Type
9.5.1. On Premise, 2014 – 2024 (US$ Mn)
9.5.2. Cloud Based (Public and Private), 2014 – 2024 (US$ Mn)
9.5.3. Hybrid, 2014 – 2024 (US$ Mn)
9.6. Market Size (US$ Mn) Forecast By End – Use Type
9.6.1. BFSI, 2014 – 2024 (US$ Mn)
9.6.2. Telecom and IT, 2014 – 2024 (US$ Mn)
9.6.3. Healthcare, 2014 – 2024 (US$ Mn)
9.6.4. Transportation, 2014 – 2024 (US$ Mn)
9.6.5. Government, 2014 – 2024 (US$ Mn)
9.6.6. Energy and Utilities, 2014 – 2024 (US$ Mn)`
9.6.7. Manufacturing, 2014 – 2024 (US$ Mn)
9.6.8. Others, 2014 – 2024 (US$ Mn)
10. Europe America IT Asset Management (ITAM) Software Market Analysis and Forecasts
10.1. Introduction
10.2. Key Findings
10.3. Market Value Share Analysis
10.4. Market Size (US$ Mn) Forecast By Enterprise Size
10.4.1. SME, 2014 – 2024 (US$ Mn)
10.4.2. Large Enterprises, 2014 – 2024 (US$ Mn)
10.5. Market Size (US$ Mn) Forecast By Deployment Type
10.5.1. On Premise, 2014 – 2024 (US$ Mn)
10.5.2. Cloud Based (Public and Private), 2014 – 2024 (US$ Mn)
10.5.3. Hybrid, 2014 – 2024 (US$ Mn)
10.6. Market Size (US$ Mn) Forecast By End – Use Type
10.6.1. BFSI, 2014 – 2024 (US$ Mn)
10.6.2. Telecom and IT, 2014 – 2024 (US$ Mn)
10.6.3. Healthcare, 2014 – 2024 (US$ Mn)
10.6.4. Transportation, 2014 – 2024 (US$ Mn)
10.6.5. Government, 2014 – 2024 (US$ Mn)
10.6.6. Energy and Utilities, 2014 – 2024 (US$ Mn)`
10.6.7. Manufacturing, 2014 – 2024 (US$ Mn)
10.6.8. Others, 2014 – 2024 (US$ Mn)
11. Asia Pacific IT Asset Management (ITAM) Software Market Analysis and Forecasts
11.1. Introduction
11.2. Key Findings
11.3. Market Value Share Analysis
11.4. Market Size (US$ Mn) Forecast By Enterprise Size
11.4.1. SME, 2014 – 2024 (US$ Mn)
11.4.2. Large Enterprises, 2014 – 2024 (US$ Mn)
11.5. Market Size (US$ Mn) Forecast By Deployment Type
11.5.1. On Premise, 2014 – 2024 (US$ Mn)
11.5.2. Cloud Based (Public and Private), 2014 – 2024 (US$ Mn)
11.5.3. Hybrid, 2014 – 2024 (US$ Mn)
11.6. Market Size (US$ Mn) Forecast By End – Use Type
11.6.1. BFSI, 2014 – 2024 (US$ Mn)
11.6.2. Telecom and IT, 2014 – 2024 (US$ Mn)
11.6.3. Healthcare, 2014 – 2024 (US$ Mn)
11.6.4. Transportation, 2014 – 2024 (US$ Mn)
11.6.5. Government, 2014 – 2024 (US$ Mn)
11.6.6. Energy and Utilities, 2014 – 2024 (US$ Mn)`
11.6.7. Manufacturing, 2014 – 2024 (US$ Mn)
11.6.8. Others, 2014 – 2024 (US$ Mn)
12. MEA IT Asset Management (ITAM) Software Market Analysis and Forecasts
12.1. Introduction
12.2. Key Findings
12.3. Market Value Share Analysis
12.4. Market Size (US$ Mn) Forecast By Enterprise Size
12.4.1. SME, 2014 – 2024 (US$ Mn)
12.4.2. Large Enterprises, 2014 – 2024 (US$ Mn)
12.5. Market Size (US$ Mn) Forecast By Deployment Type
12.5.1. On Premise, 2014 – 2024 (US$ Mn)
12.5.2. Cloud Based (Public and Private), 2014 – 2024 (US$ Mn)
12.5.3. Hybrid, 2014 – 2024 (US$ Mn)
12.6. Market Size (US$ Mn) Forecast By End – Use Type
12.6.1. BFSI, 2014 – 2024 (US$ Mn)
12.6.2. Telecom and IT, 2014 – 2024 (US$ Mn)
12.6.3. Healthcare, 2014 – 2024 (US$ Mn)
12.6.4. Transportation, 2014 – 2024 (US$ Mn)
12.6.5. Government, 2014 – 2024 (US$ Mn)
12.6.6. Energy and Utilities, 2014 – 2024 (US$ Mn)`
12.6.7. Manufacturing, 2014 – 2024 (US$ Mn)
12.6.8. Others, 2014 – 2024 (US$ Mn)
13. Latin America IT Asset Management (ITAM) Software Market Analysis and Forecasts
13.1. Introduction
13.2. Key Findings
13.3. Market Value Share Analysis
13.4. Market Size (US$ Mn) Forecast By Enterprise Size
13.4.1. SME, 2014 – 2024 (US$ Mn)
13.4.2. Large Enterprises, 2014 – 2024 (US$ Mn)
13.5. Market Size (US$ Mn) Forecast By Deployment Type
13.5.1. On Premise, 2014 – 2024 (US$ Mn)
13.5.2. Cloud Based (Public and Private), 2014 – 2024 (US$ Mn)
13.5.3. Hybrid, 2014 – 2024 (US$ Mn)
13.6. Market Size (US$ Mn) Forecast By End – Use Type
13.6.1. BFSI, 2014 – 2024 (US$ Mn)
13.6.2. Telecom and IT, 2014 – 2024 (US$ Mn)
13.6.3. Healthcare, 2014 – 2024 (US$ Mn)
13.6.4. Transportation, 2014 – 2024 (US$ Mn)
13.6.5. Government, 2014 – 2024 (US$ Mn)
13.6.6. Energy and Utilities, 2014 – 2024 (US$ Mn)`
13.6.7. Manufacturing, 2014 – 2024 (US$ Mn)
13.6.8. Others, 2014 – 2024 (US$ Mn)
14. Global IT Asset Management (ITAM) Software Market, Country Snippets
14.1. The U.S.
14.2. Canada
14.3. The U.K.
14.4. Germany
14.5. France
14.6. Spain
14.7. Italy
14.8. China
14.9. Japan
14.10. India
14.11. Indonesia
14.12. UAE
14.13. Saudi Arabia
14.14. South Africa
14.15. Brazil
15. Competition Landscape
15.1. Market Player – Competition Matrix
15.2. Product Comparison
15.3. Company Profiles
15.3.1. Hewlett Packard Enterprise Development LP
15.3.1.1. Company Details (HQ, Foundation Year, Key Management, and Employee Strength)
15.3.1.2. Company Description
15.3.1.3. Business Overview
15.3.1.4. SWOT Analysis
15.3.1.5. Revenue, Y-o-Y growth and Geographical Presence
15.3.1.6. Strategic Overview
15.3.2. BMC Software Inc.
15.3.2.1. Company Details (HQ, Foundation Year, Key Management, and Employee Strength)
15.3.2.2. Company Description
15.3.2.3. Business Overview
15.3.2.4. SWOT Analysis
15.3.2.5. Revenue, Y-o-Y growth and Geographical Presence
15.3.2.6. Strategic Overview
15.3.3. CA Technologies Inc.
15.3.3.1. Company Details (HQ, Foundation Year, Key Management, and Employee Strength)
15.3.3.2. Company Description
15.3.3.3. Business Overview
15.3.3.4. SWOT Analysis
15.3.3.5. Revenue, Y-o-Y growth and Geographical Presence
15.3.3.6. Strategic Overview
15.3.4. ServiceNow Inc.
15.3.4.1. Company Details (HQ, Foundation Year, Key Management, and Employee Strength)
15.3.4.2. Company Description
15.3.4.3. Business Overview
15.3.4.4. SWOT Analysis
15.3.4.5. Revenue, Y-o-Y growth and Geographical Presence
15.3.4.6. Strategic Overview
15.3.5. Cherwell Software Inc.
15.3.5.1. Company Details (HQ, Foundation Year, Key Management, and Employee Strength)
15.3.5.2. Company Description
15.3.5.3. Business Overview
15.3.5.4. SWOT Analysis
15.3.5.5. Revenue, Y-o-Y growth and Geographical Presence
15.3.5.6. Strategic Overview
15.3.6. Snow Software
15.3.6.1. Company Details (HQ, Foundation Year, Key Management, and Employee Strength)
15.3.6.2. Company Description
15.3.6.3. Business Overview
15.3.6.4. SWOT Analysis
15.3.6.5. Revenue, Y-o-Y growth and Geographical Presence
15.3.6.6. Strategic Overview
15.3.7. Flexera Software LLC.
15.3.7.1. Company Details (HQ, Foundation Year, Key Management, and Employee Strength)
15.3.7.2. Company Description
15.3.7.3. Business Overview
15.3.7.4. SWOT Analysis
15.3.7.5. Revenue, Y-o-Y growth and Geographical Presence
15.3.7.6. Strategic Overview
15.3.8. LANDESK Software
15.3.8.1. Company Details (HQ, Foundation Year, Key Management, and Employee Strength)
15.3.8.2. Company Description
15.3.8.3. Business Overview
15.3.8.4. SWOT Analysis
15.3.8.5. Revenue, Y-o-Y growth and Geographical Presence
15.3.8.6. Strategic Overview
15.3.9. Oracle Corporation
15.3.9.1. Company Details (HQ, Foundation Year, Key Management, and Employee Strength)
15.3.9.2. Company Description
15.3.9.3. Business Overview
15.3.9.4. SWOT Analysis
15.3.9.5. Revenue, Y-o-Y growth and Geographical Presence
15.3.9.6. Strategic Overview
15.3.10. Aspera Technologies Inc.
15.3.10.1. Company Details (HQ, Foundation Year, Key Management, and Employee Strength)
15.3.10.2. Company Description
15.3.10.3. Business Overview
15.3.10.4. SWOT Analysis
15.3.10.5. Revenue, Y-o-Y growth and Geographical Presence
15.3.10.6. Strategic Overview
15.3.11. BDNA Corporation
15.3.11.1. Company Details (HQ, Foundation Year, Key Management, and Employee Strength)
15.3.11.2. Company Description
15.3.11.3. Business Overview
15.3.11.4. SWOT Analysis
15.3.11.5. Revenue, Y-o-Y growth and Geographical Presence
15.3.11.6. Strategic Overview
List of Table
Table 1 Global ITAM Software Market Size Forecast, By Enterprise Size, 2015–2024 (US$ Mn)
Table 2 Global ITAM Software Market Size Forecast, By Deployment Type, 2015–2024 (US$ Mn)
Table 3 Global ITAM Software Market Size Forecast, By End Use Type, 2015–2024 (US$ Mn)
Table 4 Global ITAM Software Market Size Forecast, By Region Type, 2015–2024 (US$ Mn)
Table 5 North America ITAM Software Market Size Forecast, By Enterprise Size, 2015–2024 (US$ Mn)
Table 6 North America ITAM Software Market Size Forecast, By Deployment Type, 2015–2024 (US$ Mn)
Table 7 North America ITAM Software Market Size Forecast, By End Use, 2015–2024 (US$ Mn)
Table 8 Europe ITAM Software Market Size Forecast, By Enterprise Size, 2015–2024(US$ Mn)
Table 9 Europe ITAM Software Size Forecast, By Deployment Type, 2015–2024 (US$ Mn)
Table 10 Europe ITAM Software Market Size Forecast, By End Use, 2015–2024 (US$ Mn)
Table 11 Asia Pacific ITAM Software Market Size Forecast, By Enterprise Size, 2015–2024 (US$ Mn)
Table 12 Asia Pacific ITAM Software Size Forecast, By Deployment Type, 2015–2024 (US$ Mn)
Table 13 Asia Pacific ITAM Software Market Size Forecast, By End Use, 2015–2024 (US$ Mn)
Table 14 MEA ITAM Software Market Size Forecast, By Enterprise Size, 2015–2024 (US$ Mn)
Table 15 MEA ITAM Software Size Forecast, By Deployment Type, 2015–2024(US$ Mn)
Table 16 MEA ITAM Software Market Size Forecast, By End Use, 2015–2024 (US$ Mn)
Table 17 Latin America ITAM Software Market Size Forecast, By Enterprise Size, 2015–2024 (US$ Mn)
Table 18 Latin America ITAM Software Size Forecast, By Deployment Type, 2015–2024 (US$ Mn)
Table 19 Latin America ITAM Software Market Size Forecast, By End Use, 2015–2024 (US$ Mn)
List of Figures
Figure 1 Market Value Share, By Enterprise Size (2015)
Figure 2 Market Value Share, By Deployment (2015)
Figure 3 Market Value Share, By End Use (2015)
Figure 4 Market Value Share, By Region (2015)
Figure 5 Global ITAM Software Market Value and Share Analysis, By Enterprise Size, 2015 and 2024
Figure 6 Global ITAM Software Market Value Share Analysis, By Deployment Type, 2015 and 2024
Figure 7 Global ITAM Software Market Value Share Analysis, By End Use, 2015 and 2024
Figure 8 Global ITAM Software Market Value Share Analysis, By Region, 2015 and 2024
Figure 9 North America ITAM Software Market Size (US$ Mn) Forecast, 2015–2024
Figure 10 North America ITAM Software Size and Volume Y-o-Y Growth Projections, 2015–2024
Figure 11 North America ITAM Software Market Value Share Analysis, By Enterprise Size, 2015 and 2024
Figure 12 North America ITAM Software Market Value Share Analysis, By Deployment Type, 2015 and 2024
Figure 13 North America ITAM Software Market Value Share Analysis, By End Use, 2015 and 2024
Figure 14 North America ITAM Software Market Value Share Analysis, By Region, 2015 and 2024
Figure 15 North America ITAM Software Market Size (US$ Mn) Forecast, By Region, 2015–2024
Figure 16 Europe ITAM Software Market Size (US$ Mn) Forecast, 2015–2024
Figure 17 Europe ITAM Software Market Size and Volume Y-o-Y Growth Projections, 2015–2024
Figure 18 Europe Market Value Share Analysis, By Enterprise Size, 2015 and 2024
Figure 19 Europe Market Value Share Analysis, By Deployment Type, 2015 and 2024
Figure 20 Europe ITAM Software Market Value Share Analysis, By End Use, 2015 and 2024
Figure 21 Europe ITAM Software Market Value Share Analysis, By Country, 2015 and 2024
Figure 22 Europe ITAM Software Market Size Forecast, By Country, 2014–2024 (US$ Mn)
Figure 23 Asia Pacific ITAM Software Market Size Forecast, 2016–2024 (US$ Mn)
Figure 24 Asia Pacific ITAM Software Market Y-o-Y Growth Projections, 2015–2024 (% Revenue)
Figure 25 Asia Pacific Market Value Share Analysis, By Enterprise Size, 2015 and 2024
Figure 26 Asia Pacific Market Value Share Analysis, By Deployment Type, 2015 and 2024
Figure 27 Asia Pacific ITAM Software Market Value Share Analysis, By End Use, 2015 and 2024
Figure 28 Asia Pacific ITAM Software Market Value Share Analysis, By Country, 2015 and 2024
Figure 29 Asia Pacific ITAM Software Market Size Forecast, By Country, 2015–2024 (US$ Mn)
Figure 30 MEA ITAM Software Market Size Forecast, 2014–2024 (US$ Mn)
Figure 31 MEA ITAM Software Market Y-o-Y Growth Projections, 2015–2024
Figure 32 MEA Market Value Share Analysis, By Enterprise Size, 2015 and 2024
Figure 33 MEA Market Value Share Analysis, By Deployment Type, 2015 and 2024
Figure 34 MEA ITAM Software Market Value Share Analysis, By End Use, 2015 and 2024
Figure 35 MEA ITAM Software Market Value Share Analysis, By Country, 2015 and 2024
Figure 36 MEA ITAM Software Market Size Forecast, By Country, 2015–2024 (US$ Mn)
Figure 37 Latin America ITAM Software Market Size (US$ Mn) Forecast, 2015–2024
Figure 38 Latin America ITAM Software Market Size, 2015–2024
Figure 39 Latin America Market Value Share Analysis, By Enterprise Size, 2015 and 2024
Figure 40 Latin America Market Value Share Analysis, By Deployment Type, 2015 and 2024
Figure 41 Latin America ITAM Software Market Value Share Analysis, By End Use, 2015 and 2024
Figure 42 Latin America ITAM Software Market Value Share Analysis, By Country, 2015 and 2024
Figure 43 Latin America ITAM Software Market Size Forecast, By Country, 2015–2024 (US$ Mn)
Figure 44 Competitive Matrix
Figure 45 Competitive Matrix
Copyright © Transparency Market Research, Inc. All Rights reserved
Trust Online

IT Asset Management (ITAM) Software Market