
Reports
Reports
Hazardous Area Sensors Market: Snapshot
The deployment of electrical equipment in potentially hazardous or explosive areas has been a major concern since the beginning of the 20th century. Supported by the need to achieve accuracy and safety in volatile zones and the implementation of government regulations globally, the market for hazardous area sensors has received a significant boost over the years. Fueled by the growing importance of intrinsic safety in many manufacturing facilities, including oil refineries, textile mills, chemical plants, and paint manufacturers, the global market for hazardous area sensors is poised to expand at a 4.6% CAGR during the forecast period of 2015 to 2023, rising from a value of US$4.5 bn to US$6.7 bn therein.
Despite the fact that hazardous area sensing has existed for a considerable period of time, the number of players dealing with hazardous area sensors are limited. There are, however, a comparatively higher number of suppliers providing raw material to manufacturers.
Developed Markets to Register Sluggish Growth as Developing Regions Surge Ahead
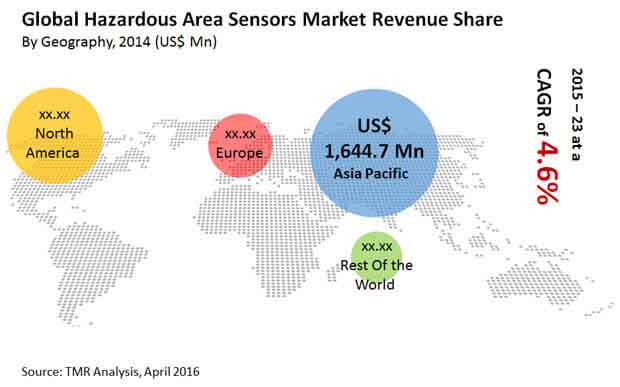
The global market for hazardous area sensors has been geographically segmented into Asia Pacific, North America, Europe, and Rest of the World. Asia Pacific has been the leading revenue generator in the hazardous area sensors market with a share of more than 35% in 2014. The region is expected to retain its lead throughout the forecast period owing to high economic growth in countries such as India and South Korea. In addition, the rapid growth of various industrial sectors and the increasing importance attributed to intrinsic safety in most industry verticals have been instrumental in driving the hazardous area sensors market in Asia Pacific.
North America has been just as significant a market as APAC, fueled by the replacement of existing hazardous area sensors and the constant upgrade of legacy systems. The growth in certain sectors, such as shale gas exploration, waste and sewage management, and healthcare, is also likely to boost the hazardous area sensors market in North America. The regional market, along with Europe, is considered to be rather mature and is thus estimated to exhibit sluggish growth over the next few years.
Despite holding a minimum share in 2014, the hazardous area sensors market in the Rest of the World is anticipated to register the fastest growth rate from 2015 to 2023. This segment is projected to be fueled by the oil and gas as well as the mining and metal industries. Several countries in RoW, such as Brazil and South Africa, have been emphasizing on intrinsic safety in the industrial sector. As an increasing number of countries follow this trend, the hazardous area sensors market is likely to receive an impetus during the forecast period.
Increased Use of Hazardous Area Sensors in Oil and Gas Industry
The prominent applications of hazardous area sensors include oil and gas, power, mining and metal, healthcare, grain storage, chemical, waste and sewage management, pharmaceutical, and fertilizer. The use of hazardous area sensors in the oil and gas sector has been significantly high and over the forecast period from 2015 to 2023, this application segment is expected to lead the overall hazardous area sensors market. The rising demand for shale gas and coal gas, coupled with increasing exploration for new gas fields, has been positively impacting the market.
Servomex Group, Ltd., Neo Monitors AS, Eaton Corporation Plc, Sick AG, Mettler-Toledo International, Inc., ABB Group, Yokogawa Electric Corporation, Honeywell International, Inc., Endress and Hauser, and Siemens AG are some of the leading players in the global hazardous area sensors market.
Need for Innovative Designs Pave Way to New Avenues in Hazardous Area Sensors Market
Hazardous area sensors are used in ensuring safety of operations in range of manufacturing facilities across industries. They keep track of operational parameters of equipment such as those related with electrical motors and pumps used in machines that work in hazardous environments before the breakdown occurs. Key propositions driving the proposition for hazardous area sensors market include the need for improving the reliability and safety of equipment used in these manufacturing units. Further, they can avoid unplanned downtimes. The market is making strides from the growing launch of easy-to-install hazardous area sensors for rotating machines. Integration with wireless technologies is one of the key advancements that boost the capabilities of these sensors in remotely monitoring the health and performance of machineries working in explosive environments. The prospect of wireless sensors is growing with technological advancements in the hazardous area sensors market. Strides made in communication platforms on which hazardous area sensors work are also crucial in expanding the lucrative avenue in the market. Sensor developers and equipment manufacturers are focusing on various performance characteristics such as battery life, accuracy of measurement, and use of energy. Sensor communicating protocols gathering steam in the market are low-energy WirelessHART and Bluetooth.
The COVID-19 pandemic that struck the world in 2019 and continues to this day has caused wide-ranging disruptions on macroeconomics and microeconomic fundamentals of businesses across several industries. The entire value chain ecosystem of businesses in developing and developed nations went for an overhaul to mitigate the adverse fallouts of the pandemic-led economic lockdowns imposed by governments. The international trade suffered a considerable decline. The hazardous area sensors also witnessed a decline in application. However, in recent months, with wheels of industrial production rolling forward, the use of hazardous area sensors for monitoring is also growing. Numerous developed countries are witnessing the rise of new sensor technologies in order to meet the new regulations and norms defining hazardous duty operations. Examples include National Fire Protection Association, International Electrotechnical Commission, and ATEX directive.
Chapter 1 Preface
1.1 Report description
1.2 Research scope
1.3 Research methodology
Chapter 2 Executive Summary
Chapter 3 Global Hazardous Area Sensors Market: Market Overview
3.1 Introduction
3.2 Key Trends Analysis
3.3 Market Drivers
3.3.1 Increasing importance of “Intrinsic Safety”
3.3.2 Strict government legislations and policies positively impacting the market
3.3.3 Rising demand for hazardous area sensors in shale gas industry
3.4 Market Restraints
3.4.1 Highly mature sensors market
3.4.2 Economic slowdown
3.4.3 High cost of upgrading legacy systems while installing modern sensors
3.5 Market Opportunities
3.5.1 Growing popularity of hazardous area sensors across end-user industries
3.6 Porter’s Five Forces Analysis
3.6.1 Bargaining Power of Suppliers
3.6.2 Bargaining Power of Buyers
3.6.3 Threat of Substitutes
3.6.4 Threat of New Entrants
3.6.5 Competitive Rivalry
3.7 Value Chain Analysis
3.7.1 Raw Material Suppliers
3.7.2 Manufacturers
3.7.3 Distributors
3.7.4 Consumers
3.8 Regulations: Hazardous Areas
3.9 Global Hazardous Area Sensors Market: Market Attractiveness Analysis
3.9.1 Market Attractiveness Analysis: By Type
3.9.2 Market Attractiveness Analysis: By Application
3.10 Market Share
3.10.1 Gas Sensing
3.10.1.1 North America
3.10.1.2 Europe
3.10.1.3 Asia Pacific
3.10.1.4 Rest of the World
3.10.2 Pressure Sensing
3.10.2.1 North America
3.10.2.2 Europe
3.10.2.3 Asia Pacific
3.10.2.4 Rest of the World
3.10.3 Current Sensing
3.10.3.1 North America
3.10.3.2 Europe
3.10.3.3 Asia Pacific
3.10.3.4 Rest of the World
3.10.4 Voltage Sensing
3.10.4.1 North America
3.10.4.2 Europe
3.10.4.3 Asia Pacific
3.10.4.4 Rest of the World
3.10.5 Temperature Sensors
3.10.5.1 North America
3.10.5.2 Europe
3.10.5.3 Asia Pacific
3.10.5.4 Rest of the World
3.10.6 Competitive Strategies Adopted by Leading Players
3.11 List of Suppliers: Hazardous Area Sensors
3.11.1 North America: Top 10 Suppliers
3.11.2 Europe: Top 10 Suppliers
3.11.3 Asia Pacific: Top 10 Suppliers
3.11.4 Rest of the World (RoW): Top 10 Suppliers
Chapter 4 Global Hazardous Area Sensors Market Revenue, by Type, 2015 – 2023 (USD Million)
4.1 Overview
4.1.1 Market share, 2014 vs. 2023 (%)
4.2 Gas Sensing
4.2.1 Gas sensing hazardous area sensors market, revenue and forecast, 2014 – 2023 (USD Million)
4.2.1.1 Electrochemical
4.2.1.1.1 Electrochemical gas sensing hazardous area sensors market, revenue and forecast, 2014 – 2023 (USD Million)
4.2.1.2 Optical
4.2.1.2.1 Optical gas sensing hazardous area sensors market, revenue and forecast, 2014 – 2023 (USD Million)
4.2.1.3 Ionization Based
4.2.1.3.1 Ionization based gas sensing hazardous area sensors market, revenue and forecast, 2014 – 2023 (USD Million)
4.2.1.4 Solid State
4.2.1.4.1 Solid state gas sensing hazardous area sensors market, revenue and forecast, 2014 – 2023 (USD Million)
4.2.1.5 Magnetic & Related
4.2.1.5.1 Magnetic & related gas sensing hazardous area sensors market, revenue and forecast, 2014 – 2023 (USD Million)
4.2.1.6 Optical Fiber
4.2.1.6.1 Optical fiber gas sensing hazardous area sensors market, revenue and forecast, 2014 – 2023 (USD Million)
4.2.1.7 Acoustic & Related
4.2.1.7.1 Acoustic & related gas sensing hazardous area sensors market, revenue and forecast, 2014 – 2023 (USD Million)
4.3 Pressure Sensing
4.3.1 Pressure sensing hazardous area sensors market, revenue and forecast, 2014 – 2023 (USD Million)
4.3.1.1 Resonant Solid State
4.3.1.1.1 Resonant solid state pressure sensing hazardous area sensors market, revenue and forecast, 2014 – 2023 (USD Million)
4.3.1.2 Piezoresistive Strain Gauge
4.3.1.2.1 Piezoresistive strain gauge pressure sensing hazardous area sensors market, revenue and forecast, 2014 – 2023 (USD Million)
4.3.1.3 Piezoelectric
4.3.1.3.1 Piezoelectric pressure sensing hazardous area sensors market, revenue and forecast, 2014 – 2023 (USD Million)
4.3.1.4 Capacitive
4.3.1.4.1 Capacitive pressure sensing hazardous area sensors market, revenue and forecast, 2014 – 2023 (USD Million)
4.3.1.5 Fiber Optic
4.3.1.5.1 Fiber optic pressure sensing hazardous area sensors market, revenue and forecast, 2014 – 2023 (USD Million)
4.3.1.6 Others
4.3.1.6.1 Other pressure sensing hazardous area sensors market, revenue and forecast, 2014 – 2023 (USD Million)
4.4 Current Sensing
4.4.1 Current sensing hazardous area sensors market, revenue and forecast, 2014 – 2023 (USD Million)
4.4.1.1 Hall Effect IC Sensor
4.4.1.1.1 Hall Effect IC current sensing hazardous area sensors market, revenue and forecast, 2014 – 2023 (USD Million)
4.4.1.2 Resistor
4.4.1.2.1 Resistor current sensing hazardous area sensors market, revenue and forecast, 2014 – 2023 (USD Million)
4.4.1.3 Fiber Optic Current Sensing
4.4.1.3.1 Fiber optic current sensing hazardous area sensors market, revenue and forecast, 2014 – 2023 (USD Million)
4.4.1.4 Rogowski Coil
4.4.1.4.1 Rogowski coil current sensing hazardous area sensors market, revenue and forecast, 2014 – 2023 (USD Million)
4.4.1.5 Others
4.4.1.5.1 Other current sensing hazardous area sensors market, revenue and forecast, 2014 – 2023 (USD Million)
4.5 Voltage Sensing
4.5.1 Voltage sensing hazardous area sensors market, revenue and forecast, 2014 – 2023 (USD Million)
4.5.1.1 Closed Loop Hall Effect Technology
4.5.1.1.1 Closed Loop Hall Effect technology based hazardous area voltage sensors market, revenue and forecast, 2014 – 2023 (USD Million)
4.5.1.2 Electronic
4.5.1.2.1 Electronic voltage sensing hazardous area sensors market, revenue and forecast, 2014 – 2023 (USD Million)
4.5.1.3 Others
4.5.1.3.1 Other voltage sensing hazardous area sensors market, revenue and forecast, 2014 – 2023 (USD Million)
4.6 Temperature Sensors
4.6.1 Temperature sensing hazardous area sensors market, revenue and forecast, 2014 – 2023 (USD Million)
4.6.1.1 Resistance Temperature Detector(RTD)
4.6.1.1.1 RTD hazardous area temperature sensors market, revenue and forecast, 2014 – 2023 (USD Million)
4.6.1.2 Thermocouple Temperature Sensor
4.6.1.2.1 Thermocouple hazardous area temperature sensors market, revenue and forecast, 2014 – 2023 (USD Million)
4.6.1.3 Fiber Optic
4.6.1.3.1 Fiber optic hazardous area temperature sensors market, revenue and forecast, 2014 – 2023 (USD Million)
4.6.1.4 Others
4.6.1.4.1 Other hazardous area temperature sensors market, revenue and forecast, 2014 – 2023 (USD Million)
Chapter 5 Global Hazardous Area Sensors Market Revenue, by Application Industry, 2015 – 2023 (USD Million)
5.1 Overview
5.1.1 Market share, 2014 vs. 2023 (%)
5.2 Power
5.2.1 Power industry hazardous area sensors market, revenue and forecast, 2014 – 2023 (USD Million)
5.3 Oil & Gas
5.3.1 Oil & gas industry hazardous area sensors market, revenue and forecast, 2014 – 2023 (USD Million)
5.4 Mining & Metal
5.4.1 Mining & metal industry hazardous area sensors market, revenue and forecast, 2014 – 2023 (USD Million)
5.5 Grain Storage
5.5.1 Grain storage industry hazardous area sensors market, revenue and forecast, 2014 – 2023 (USD Million)
5.6 Healthcare
5.6.1 Healthcare industry hazardous area sensors market, revenue and forecast, 2014 – 2023 (USD Million)
5.7 Chemical
5.7.1 Chemical industry hazardous area sensors market, revenue and forecast, 2014 – 2023 (USD Million)
5.8 Pharmaceutical
5.8.1 Pharmaceutical industry hazardous area sensors market, revenue and forecast, 2014 – 2023 (USD Million)
5.9 Waste & Sewage Management
5.9.1 Waste & sewage management industry hazardous area sensors market, revenue and forecast, 2014 – 2023 (USD Million)
5.10 Fertilizer
5.10.1 Fertilizer industry hazardous area sensors market, revenue and forecast, 2014 – 2023 (USD Million)
5.11 Others
5.11.1 Other industries hazardous area sensors market, revenue and forecast, 2014 – 2023 (USD Million)
Chapter 6 Global Hazardous Area Sensors Market Revenue, by Geography, 2015 – 2023 (USD Million)
6.1 Overview
6.1.1 Market share, 2014 vs. 2023 (%)
6.2 North America
6.2.1 North America hazardous area sensors market, revenue and forecast, 2014 – 2023 (USD Million)
6.2.2 U.S. hazardous area sensors market, revenue and forecast, 2014 – 2023 (USD Million)
6.2.3 Rest of North America hazardous area sensors market, revenue and forecast, 2014 – 2023 (USD Million)
6.3 Europe
6.3.1 Europe hazardous area sensors market, revenue and forecast, 2014 – 2023 (USD Million)
6.3.2 U.K. hazardous area sensors market, revenue and forecast, 2014 – 2023 (USD Million)
6.3.3 Germany hazardous area sensors market, revenue and forecast, 2014 – 2023 (USD Million)
6.3.4 Rest of Europe hazardous area sensors market, revenue and forecast, 2014 – 2023 (USD Million)
6.4 Asia Pacific (APAC)
6.4.1 Asia Pacific hazardous area sensors market, revenue and forecast, 2014 – 2023 (USD Million)
6.4.2 China hazardous area sensors market, revenue and forecast, 2014 – 2023 (USD Million)
6.4.3 India hazardous area sensors market, revenue and forecast, 2014 – 2023 (USD Million)
6.4.4 Japan hazardous area sensors market, revenue and forecast, 2014 – 2023 (USD Million)
6.4.5 Rest of Asia Pacific hazardous area sensors market, revenue and forecast, 2014 – 2023 (USD Million)
6.5 Rest of the World (RoW)
6.5.1 Rest of the world hazardous area sensors market, revenue and forecast, 2014 – 2023 (USD Million)
6.5.2 South America hazardous area sensors market, revenue and forecast, 2014 – 2023 (USD Million)
6.5.3 Middle-East & Africa hazardous area sensors market, revenue and forecast, 2014 – 2023 (USD Million)
Chapter 7 Company Profiles
7.1 Yokogawa Electric Corporation
7.1.1 Company Details (HQ, Foundation Year, Employee Strength)
7.1.2 Market Presence, By Segment and Geography
7.1.3 Key Developments
7.1.4 Strategy and Historical Roadmap
7.1.5 Revenue and Operating Profits
7.2 Siemens AG
7.2.1 Company Details (HQ, Foundation Year, Employee Strength)
7.2.2 Market Presence, By Segment and Geography
7.2.3 Key Developments
7.2.4 Strategy and Historical Roadmap
7.2.5 Revenue and Operating Profits
7.3 SICK AG
7.3.1 Company Details (HQ, Foundation Year, Employee Strength)
7.3.2 Market Presence, By Segment and Geography
7.3.3 Key Developments
7.3.4 Strategy and Historical Roadmap
7.3.5 Revenue and Operating Profits
7.4 Endress and Hauser
7.4.1 Company Details (HQ, Foundation Year, Employee Strength)
7.4.2 Market Presence, By Segment and Geography
7.4.3 Key Developments
7.4.4 Strategy and Historical Roadmap
7.4.5 Revenue and Operating Profits
7.5 ABB Group
7.5.1 Company Details (HQ, Foundation Year, Employee Strength)
7.5.2 Market Presence, By Segment and Geography
7.5.3 Key Developments
7.5.4 Strategy and Historical Roadmap
7.5.5 Revenue and Operating Profits
7.6 Mettler-Toledo International, Inc.
7.6.1 Company Details (HQ, Foundation Year, Employee Strength)
7.6.2 Market Presence, By Segment and Geography
7.6.3 Key Developments
7.6.4 Strategy and Historical Roadmap
7.6.5 Revenue and Operating Profits
7.7 Neo Monitors AS
7.7.1 Company Details (HQ, Foundation Year, Employee Strength)
7.7.2 Market Presence, By Segment and Geography
7.7.3 Key Developments
7.7.4 Strategy and Historical Roadmap
7.7.5 Revenue and Operating Profits
7.8 Honeywell International, Inc.
7.8.1 Company Details (HQ, Foundation Year, Employee Strength)
7.8.2 Market Presence, By Segment and Geography
7.8.3 Key Developments
7.8.4 Strategy and Historical Roadmap
7.8.5 Revenue and Operating Profits
7.9 Servomex Group, Ltd.
7.9.1 Company Details (HQ, Foundation Year, Employee Strength)
7.9.2 Market Presence, By Segment and Geography
7.9.3 Key Developments
7.9.4 Strategy and Historical Roadmap
7.9.5 Revenue and Operating Profits
7.10 Eaton Corporation Plc
7.10.1 Company Details (HQ, Foundation Year, Employee Strength)
7.10.2 Market Presence, By Segment and Geography
7.10.3 Key Developments
7.10.4 Strategy and Historical Roadmap
7.10.5 Revenue and Operating Profits
List of Tables
TABLE 1 Global Hazardous Area Sensors Market Snapshot (Revenue), 2014 and 2023
TABLE 2 Drivers of Hazardous Area Sensors Market: Impact Analysis
TABLE 3 Relationships Between Different Methods of Assessing Safety Levels
TABLE 4 Testing Authorities across Countries
TABLE 5 Technologically Recoverable Global Shale Gas Reserve Estimates(top 10 Countries)
TABLE 6 Restraints of Hazardous Area Sensors Market: Impact Analysis
TABLE 7 IMF GDP Growth Forecasts (April 2016)
TABLE 8 IEC Classification
TABLE 9 IEC Classification (Zones)
TABLE 10 Temperature Classification
TABLE 11 Global Hazardous Area Sensors Market Revenue and Forecast, By Type, 2014 – 2023 (USD Million)
TABLE 12 Global Hazardous Area Sensors Market Revenue and Forecast, By Gas Sensing, 2014 – 2023 (USD Million)
TABLE 13 Global Hazardous Area Sensors Market Revenue and Forecast, By Pressure Sensing, 2014 – 2023 (USD Million)
TABLE 14 Global Hazardous Area Sensors Market Revenue and Forecast, By Current Sensing, 2014 – 2023 (USD Million)
TABLE 15 Global Hazardous Area Sensors Market Revenue and Forecast, By Voltage Sensing, 2014 – 2023 (USD Million)
TABLE 16 Global Hazardous Area Sensors Market Revenue and Forecast, By Temperature Sensor, 2014 – 2023 (USD Million)
TABLE 17 Global Hazardous Area Sensors Market Revenue and Forecast, By Application Industry, 2014 – 2023 (USD Million)
TABLE 18 Global Hazardous Area Sensors Market Revenue and Forecast, By Type, 2014 – 2023 (USD Million)
TABLE 19 North America Hazardous Area Sensors Market Revenue and Forecast, By Types, 2014 – 2023 (USD Million)
TABLE 20 North America Hazardous Area Sensors Market Revenue and Forecast, By Gas Sensing, 2014 – 2023 (USD Million)
TABLE 21 North America Hazardous Area Sensors Market Revenue and Forecast, By Pressure Sensing, 2014 – 2023 (USD Million)
TABLE 22 North America Hazardous Area Sensors Market Revenue and Forecast, By Current Sensing, 2014 – 2023 (USD Million)
TABLE 23 North America Hazardous Area Sensors Market Revenue and Forecast, By Voltage Sensing, 2014 – 2023 (USD Million)
TABLE 24 North America Hazardous Area Sensors Market Revenue and Forecast, By Temperature Sensor, 2014 – 2023 (USD Million)
TABLE 25 North America Hazardous Area Sensors Market Revenue and Forecast, By Application Industry, 2014 – 2023 (USD Million)
TABLE 26 North America Hazardous Area Sensors Market Revenue and Forecast, By Country, 2014 – 2023 (USD Million)
TABLE 27 Europe Hazardous Area Sensors Market Revenue and Forecast, By Types, 2014 – 2023 (USD Million)
TABLE 28 Europe Hazardous Area Sensors Market Revenue and Forecast, By Gas Sensing, 2014 – 2023 (USD Million)
TABLE 29 Europe Hazardous Area Sensors Market Revenue and Forecast, By Pressure Sensing, 2014 – 2023 (USD Million)
TABLE 30 Europe Hazardous Area Sensors Market Revenue and Forecast, By Current Sensing, 2014 – 2023 (USD Million)
TABLE 31 Europe Hazardous Area Sensors Market Revenue and Forecast, By Voltage Sensing, 2014 – 2023 (USD Million)
TABLE 32 Europe Hazardous Area Sensors Market Revenue and Forecast, By Temperature Sensor, 2014 – 2023 (USD Million)
TABLE 33 Europe Hazardous Area Sensors Market Revenue and Forecast, By Application Industry, 2014 – 2023 (USD Million)
TABLE 34 Europe Hazardous Area Sensors Market Revenue and Forecast, By Country, 2014 – 2023 (USD Million)
TABLE 35 Asia Pacific Hazardous Area Sensors Market Revenue and Forecast, By Types, 2014 – 2023 (USD Million)
TABLE 36 Asia Pacific Hazardous Area Sensors Market Revenue and Forecast, By Gas Sensing, 2014 – 2023 (USD Million)
TABLE 37 Asia Pacific Hazardous Area Sensors Market Revenue and Forecast, By Pressure Sensing, 2014 – 2023 (USD Million)
TABLE 38 Asia Pacific Hazardous Area Sensors Market Revenue and Forecast, By Current Sensing, 2014 – 2023 (USD Million)
TABLE 39 Asia Pacific Hazardous Area Sensors Market Revenue and Forecast, By Voltage Sensing, 2014 – 2023 (USD Million)
TABLE 40 Asia Pacific Hazardous Area Sensors Market Revenue and Forecast, By Temperature Sensor, 2014 – 2023 (USD Million)
TABLE 41 Asia Pacific Hazardous Area Sensors Market Revenue and Forecast, By Application Industry, 2014 – 2023 (USD Million)
TABLE 42 Asia Pacific Hazardous Area Sensors Market Revenue and Forecast, By Country, 2014 – 2023 (USD Million)
TABLE 43 Rest of the World Hazardous Area Sensors Market Revenue and Forecast, By Types, 2014 – 2023 (USD Million)
TABLE 44 Rest of the World Hazardous Area Sensors Market Revenue and Forecast, By Gas Sensing, 2014 – 2023 (USD Million)
TABLE 45 Rest of the World Hazardous Area Sensors Market Revenue and Forecast, By Pressure Sensing, 2014 – 2023 (USD Million)
TABLE 46 Rest of the World Hazardous Area Sensors Market Revenue and Forecast, By Current Sensing, 2014 – 2023 (USD Million)
TABLE 47 Rest of the World Hazardous Area Sensors Market Revenue and Forecast, By Voltage Sensing, 2014 – 2023 (USD Million)
TABLE 48 Rest of the World Hazardous Area Sensors Market Revenue and Forecast, By Temperature Sensor, 2014 – 2023 (USD Million)
TABLE 49 Rest of the World Hazardous Area Sensors Market Revenue and Forecast, By Application Industry, 2014 – 2023 (USD Million)
TABLE 50 Rest of the World Hazardous Area Sensors Market Revenue and Forecast, By Region, 2014 – 2023 (USD Million)
List of Figures
FIG. 1 Porter’s Five Forces Analysis For Hazardous Area Sensors Market
FIG. 2 Value Chain Analysis For Hazardous Area Sensors Market
FIG. 3 Market Attractiveness Analysis, By Type, 2014
FIG. 4 Market Attractiveness Analysis, By Application, 2014
FIG. 5 Gas Sensing: North America Company Market Share Analysis, 2014 (%)
FIG. 6 Gas Sensing: Europe Company Market Share Analysis, 2014 (%)
FIG. 7 Gas Sensing: Asia Pacific Company Market Share Analysis, 2014 (%)
FIG. 8 Gas Sensing: Rest of the World Company Market Share Analysis, 2014 (%)
FIG. 9 Pressure Sensing: North America Company Market Share Analysis, 2014 (%)
FIG. 10 Pressure Sensing: Europe Company Market Share Analysis, 2014 (%)
FIG. 11 Pressure Sensing: Asia Pacific Company Market Share Analysis, 2014 (%)
FIG. 12 Pressure Sensing: Rest of the World Company Market Share Analysis, 2014 (%)
FIG. 13 Current Sensing: North America Company Market Share Analysis, 2014 (%)
FIG. 14 Current Sensing: Europe Company Market Share Analysis, 2014 (%)
FIG. 15 Current Sensing: Asia Pacific Company Market Share Analysis, 2014 (%)
FIG. 16 Current Sensing: Rest of the World Company Market Share Analysis, 2014 (%)
FIG. 17 Voltage Sensing: North America Company Market Share Analysis, 2014 (%)
FIG. 18 Voltage Sensing: Europe Company Market Share Analysis, 2014 (%)
FIG. 19 Voltage Sensing: Asia Pacific Company Market Share Analysis, 2014 (%)
FIG. 20 Voltage Sensing: Rest of the World Company Market Share Analysis, 2014 (%)
FIG. 21 Temperature Sensors: North America Company Market Share Analysis, 2014 (%)
FIG. 22 Temperature Sensors: Europe Company Market Share Analysis, 2014 (%)
FIG. 23 Temperature Sensors: Asia Pacific Company Market Share Analysis, 2014 (%)
FIG. 24 Temperature Sensors: Rest of the World Company Market Share Analysis, 2014 (%)
FIG. 25 Market share, 2014 vs. 2023 (%)
FIG. 26 Gas sensing hazardous area sensors, revenue and forecast, 2014 – 2023 (USD Million)
FIG. 27 Electrochemical gas sensing hazardous area sensors, revenue and forecast, 2014 – 2023 (USD Million)
FIG. 28 Optical gas sensing hazardous area sensors, revenue and forecast, 2014 – 2023 (USD Million)
FIG. 29 Ionization based gas sensing hazardous area sensors, revenue and forecast, 2014 – 2023 (USD Million)
FIG. 30 Solid state gas sensing hazardous area sensors, revenue and forecast, 2014 – 2023 (USD Million)
FIG. 31 Magnetic & related gas sensing hazardous area sensors, revenue and forecast, 2014 – 2023 (USD Million)
FIG. 32 Optical fiber gas sensing hazardous area sensors, revenue and forecast, 2014 – 2023 (USD Million)
FIG. 33 Acoustic & related gas sensing hazardous area sensors, revenue and forecast, 2014 – 2023 (USD Million)
FIG. 34 Pressure sensing hazardous area sensors, revenue and forecast, 2014 – 2023 (USD Million)
FIG. 35 Resonant solid state pressure sensing hazardous area sensors, revenue and forecast, 2014 – 2023 (USD Million)
FIG. 36 Piezoresistive strain gauge pressure sensing hazardous area sensors, revenue and forecast, 2014 – 2023 (USD Million)
FIG. 37 Piezoelectric pressure sensing hazardous area sensors, revenue and forecast, 2014 – 2023 (USD Million)
FIG. 38 Capacitive pressure sensing hazardous area sensors, revenue and forecast, 2014 – 2023 (USD Million)
FIG. 39 Fiber optic pressure sensing hazardous area sensors, revenue and forecast, 2014 – 2023 (USD Million)
FIG. 40 Other pressure sensing hazardous area sensors, revenue and forecast, 2014 – 2023 (USD Million)
FIG. 41 Current sensing hazardous area sensors, revenue and forecast, 2014 – 2023 (USD Million)
FIG. 42 Hall Effect IC current sensing hazardous area sensors, revenue and forecast, 2014 – 2023 (USD Million)
FIG. 43 Resistor current sensing hazardous area sensors, revenue and forecast, 2014 – 2023 (USD Million)
FIG. 44 Fiber optic current sensing hazardous area sensors, revenue and forecast, 2014 – 2023 (USD Million)
FIG. 45 Rogowski coil current sensing hazardous area sensors, revenue and forecast, 2014 – 2023 (USD Million)
FIG. 46 Other current sensing hazardous area sensors, revenue and forecast, 2014 – 2023 (USD Million)
FIG. 47 Voltage sensing hazardous area sensors, revenue and forecast, 2014 – 2023 (USD Million)
FIG. 48 Closed Loop Hall Effect technology based hazardous area voltage sensors, revenue and forecast, 2014 – 2023 (USD Million)
FIG. 49 Electronic voltage sensing hazardous area sensors, revenue and forecast, 2014 – 2023 (USD Million)
FIG. 50 Other voltage sensing hazardous area sensors, revenue and forecast, 2014 – 2023 (USD Million)
FIG. 51 Temperature sensing hazardous area sensors, revenue and forecast, 2014 – 2023 (USD Million)
FIG. 52 RTD hazardous area temperature sensors, revenue and forecast, 2014 – 2023 (USD Million)
FIG. 53 Thermocouple hazardous area temperature sensors, revenue and forecast, 2014 – 2023 (USD Million)
FIG. 54 Fiber optic hazardous area temperature sensors, revenue and forecast, 2014 – 2023 (USD Million)
FIG. 55 Other hazardous area temperature sensors, revenue and forecast, 2014 – 2023 (USD Million)
FIG. 56 Market share, 2014 vs. 2023 (%)
FIG. 57 Power industry hazardous area sensors, revenue and forecast, 2014 – 2023 (USD Million)
FIG. 58 Oil & gas industry hazardous area sensors, revenue and forecast, 2014 – 2023 (USD Million)
FIG. 59 Mining & metal industry hazardous area sensors, revenue and forecast, 2014 – 2023 (USD Million)
FIG. 60 Grain storage industry hazardous area sensors, revenue and forecast, 2014 – 2023 (USD Million)
FIG. 61 Healthcare industry hazardous area sensors, revenue and forecast, 2014 – 2023 (USD Million)
FIG. 62 Chemical industry hazardous area sensors, revenue and forecast, 2014 – 2023 (USD Million)
FIG. 63 Pharmaceutical industry hazardous area sensors, revenue and forecast, 2014 – 2023 (USD Million)
FIG. 64 Waste & sewage management industry hazardous area sensors, revenue and forecast, 2014 – 2023 (USD Million)
FIG. 65 Fertilizer industry hazardous area sensors, revenue and forecast, 2014 – 2023 (USD Million)
FIG. 66 Other industries hazardous area sensors, revenue and forecast, 2014 – 2023 (USD Million)
FIG. 67 Market share, 2014 vs. 2023 (%)
FIG. 68 North America hazardous area sensors, revenue and forecast, 2014 – 2023 (USD Million)
FIG. 69 U.S. hazardous area sensors, revenue and forecast, 2014 – 2023 (USD Million)
FIG. 70 Rest of North America hazardous area sensors, revenue and forecast, 2014 – 2023 (USD Million)
FIG. 71 Europe hazardous area sensors, revenue and forecast, 2014 – 2023 (USD Million)
FIG. 72 U.K. hazardous area sensors, revenue and forecast, 2014 – 2023 (USD Million)
FIG. 73 Germany hazardous area sensors, revenue and forecast, 2014 – 2023 (USD Million)
FIG. 74 Rest of Europe hazardous area sensors, revenue and forecast, 2014 – 2023 (USD Million)
FIG. 75 Asia Pacific hazardous area sensors, revenue and forecast, 2014 – 2023 (USD Million)
FIG. 76 China hazardous area sensors, revenue and forecast, 2014 – 2023 (USD Million)
FIG. 77 India hazardous area sensors, revenue and forecast, 2014 – 2023 (USD Million)
FIG. 78 Japan hazardous area sensors, revenue and forecast, 2014 – 2023 (USD Million)
FIG. 79 Rest of Asia Pacific hazardous area sensors, revenue and forecast, 2014 – 2023 (USD Million)
FIG. 80 Rest of the world hazardous area sensors, revenue and forecast, 2014 – 2023 (USD Million)
FIG. 81 South America hazardous area sensors, revenue and forecast, 2014 – 2023 (USD Million)
FIG. 82 Middle-East & Africa hazardous area sensors, revenue and forecast, 2014 – 2023 (USD Million)
Copyright © Transparency Market Research, Inc. All Rights reserved
Trust Online

Hazardous Area Sensors Market