
Reports
Reports
Since the coronavirus disease has become a global pandemic, every industry is scrambling to determine how best to support their employees and customers. This has led to the emergence of software robots that are taking over mundane and tedious tasks by freeing up healthcare workers to spend more time on essential patient care activities. Such trends are benefitting companies in the engineering software market.
Software robots are anticipated to gain prominence in the post COVID-19 pandemic. UiPath - a leading robotic process automation vendor, is gaining recognition for offering its Epic EMR software that deployed automated COVID-19 test labelling for Cleveland Clinic, U.S. Such software robots are accelerating COVID-19 testing and eliminating costly manual errors. This is expected to drive the engineering software market during the forecast period.
The engineering software market is predicted to advance at a robust CAGR of ~13% during the forecast period. However, many clients are unable to spot the differences in software solutions such as for visual technology and modelling software. Clients tend to confuse modelling software with photogrammetry in order to obtain a photo-realistic tour to document a facility, which may lead to additional costs and hinder the workflow. Hence, software companies should educate end users about the utility of every software so that the buyer makes an informed decision.
Modelling software are becoming more sophisticated to simplify the output and translation of information. This transforms a complex data set into a digestible diagnostic.
The engineering software market is projected to reach a valuation of US$ 124 Bn by 2030. This is evident since CAD (Computer Aided Design) customization and design automation software are gaining increased popularity. CAD customization is being highly publicized for automation of monotonous tasks within CAD. On the other hand, design automation software are allowing users to translate engineering knowledge to be input into a system and apply it in real-time during the development of a product.
Companies in the engineering software market are increasing the availability of design automation software, since engineers can record theories and concepts, and demonstrate how and when they are applicable in the software. This helps to automate the engineering knowledge into a design process.
Virtual reality, real-time rendering, and cloud computing are transforming 3D modelling software. Blender, MakeHuman, and Autodesk Maya are gaining increased popularity under the umbrella of 3D modelling software. Companies in the engineering software market are offering open source 3D modeling software that are available for free, so that anyone can contribute to its code in order to make it better.
Software companies in the engineering software market are teaming up with developers, artists, and designers to innovate in 3D modelling software. They are developing simple UI/UX, which is easy for beginners to grasp with less complicated tools. Other revenue models include a 30-day free trial of software to help users acquire hands-on experience of the tools.
Digitalization of processes is bringing about a significant change in the engineering software market. The Siemens Digital Industries Software is gaining popularity for offering flexible and scalable applications for new workflows. Open source engineering software have become a recurring trend in the market landscape, compounded with the availability for cloud-connected products or tools that support digitalization.
Companies in the engineering software market are providing smart and personalized software platforms. Such platforms are giving rise to new insights, opportunities, and new levels of automation at every point of the value chain. Companies are developing integrated portfolio of software and services for electronic and mechanical design, system simulation, lifecycle analytics, and manufacturing, among others.
Analysts’ Viewpoint
Software robots are anticipated to gain prominence in the post coronavirus pandemic where these platforms are being built with the optical character recognition (OCR) technology to automate unemployment applications in government organizations to decipher tricky handwriting. The 3D modeling software are gaining popularity for developing high-quality digital content. However, software development methodologies such as the agile development methodology are being associated with lack of documentation and in many cases, difficult to access at the beginning of the lifecycle of the software development. Hence, companies in the engineering software market should increase the availability of open source software platforms to attract seamless collaboration from developers, artists, and designers.
1. Preface
1.1. Market Introduction
1.2. Market Segmentation
1.3. Key Research Objectives
2. Assumptions and Research Methodology
2.1. Research Methodology
2.1.1. List of Primary and Secondary Sources
2.2. Key Assumptions for Data Modelling
3. Executive Summary - Global Engineering Software Market
4. Market Overview
4.1. Market Definition
4.2. Technology/ Product Roadmap
4.3. Market Factor Analysis
4.3.1. Forecast Factors
4.3.2. Ecosystem/ Value Chain Analysis
4.3.3. Market Dynamics (Growth Influencers)
4.3.3.1. Drivers
4.3.3.2. Restraints
4.3.3.3. Opportunities
4.3.3.4. Impact Analysis of Drivers and Restraints
4.4. COVID-19 Impact Analysis
4.4.1. Impact of COVID-19 on the Engineering Software Market
4.4.2. Short Term and Long Term Impact on the Market
4.4.3. Recovery Period (3 Months/6 Months/12 Months)
4.5. Market Opportunity Assessment – by Region (North America/ Europe/ Asia Pacific/ Middle East & Africa/ South America)
4.5.1. By Component
4.5.2. By Deployment
4.5.3. By Application
4.5.4. By Enterprise Size
5. Global Engineering Software Market Analysis and Forecast
5.1. Market Revenue Analysis (US$ Bn), 2015-2030
5.1.1. Historic Growth Trends, 2015-2019
5.1.2. Forecast Trends, 2020-2030
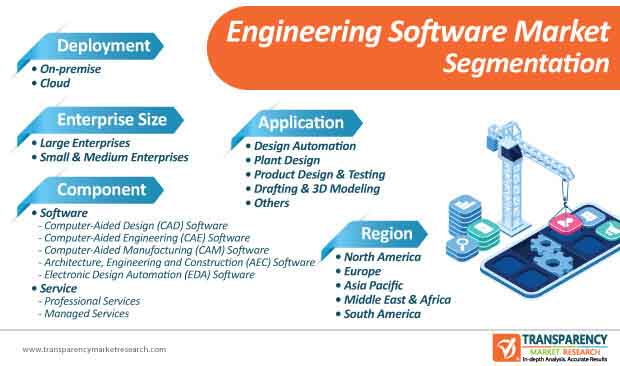
6. Global Engineering Software Market Analysis, by Component
6.1. Overview and Definitions
6.2. Key Segment Analysis
6.3. Engineering Software Market Size (US$ Bn) Forecast, by Component, 2018 - 2030
6.3.1. Software
6.3.1.1. Computer-Aided Design (CAD) Software
6.3.1.2. Computer-Aided Engineering (CAE) Software
6.3.1.3. Computer-Aided Manufacturing (CAM) Software
6.3.1.4. Architecture, Engineering and Construction (AEC) Software
6.3.1.5. Electronic Design Automation (EDA) Software
6.3.2. Services
6.3.2.1. Professional Services
6.3.2.1.1. Training & Consulting
6.3.2.1.2. Integration & Implementation
6.3.2.1.3. Support & Maintenance
6.3.3. Managed Services
7. Global Engineering Software Market Analysis, by Deployment
7.1. Overview and Definitions
7.2. Key Segment Analysis
7.3. Engineering Software Market Size (US$ Bn) Forecast, by Deployment, 2018 - 2030
7.3.1. On-premise
7.3.2. Cloud
8. Global Engineering Software Market Analysis, by Application
8.1. Overview and Definitions
8.2. Key Segment Analysis
8.3. Engineering Software Market Size (US$ Bn) Forecast, by Application, 2018 - 2030
8.3.1. Design Automation
8.3.2. Plant Design
8.3.3. Product Design & Testing
8.3.4. Drafting & 3D Modeling
8.3.5. Others
9. Global Engineering Software Market Analysis, by Enterprise Size
9.1. Overview and Definitions
9.2. Key Segment Analysis
9.3. Engineering Software Market Size (US$ Bn ) Forecast, by Enterprise Size, 2018 - 2030
9.3.1. Small & Medium Enterprises
9.3.2. Large Enterprises
10. Global Engineering Software Market Analysis and Forecast, By Region
10.1. Key Findings
10.2. Engineering Software Market Size (US$ Bn ) Forecast, by Region, 2018 - 2030
10.2.1. North America
10.2.2. Europe
10.2.3. Asia Pacific
10.2.4. Middle East & Africa
10.2.5. South America
11. North America Engineering Software Market Analysis
11.1. Regional Outlook
11.2. Engineering Software Market Size (US$ Bn ) Analysis and Forecast (2018 - 2030)
11.2.1. By Component
11.2.2. By Deployment
11.2.3. By Application
11.2.4. By Enterprise Size
11.3. Engineering Software Market Size (US$ Bn ) Forecast, by Country, 2018 - 2030
11.3.1. U.S.
11.3.2. Canada
11.3.3. Mexico
12. Europe Engineering Software Market Analysis and Forecast
12.1. Regional Outlook
12.2. Engineering Software Market Size (US$ Bn ) Analysis and Forecast (2018 - 2030)
12.2.1. By Component
12.2.2. By Deployment
12.2.3. By Application
12.2.4. By Enterprise Size
12.3. Engineering Software Market Size (US$ Bn ) Forecast, by Country & Sub-region, 2018 - 2030
12.3.1. Germany
12.3.2. U.K.
12.3.3. France
12.3.4. Spain
12.3.5. Italy
12.3.6. Rest of Europe
13. APAC Engineering Software Market Analysis and Forecast
13.1. Regional Outlook
13.2. Engineering Software Market Size (US$ Bn) Analysis and Forecast (2018 - 2030)
13.2.1. By Component
13.2.2. By Deployment
13.2.3. By Application
13.2.4. By Enterprise Size
13.3. Engineering Software Market Size (US$ Bn) Forecast, by Country & Sub-region, 2018 - 2030
13.3.1. China
13.3.2. India
13.3.3. Japan
13.3.4. ASEAN
13.3.5. Rest of Asia Pacific
14. Middle East & Africa (MEA) Engineering Software Market Analysis and Forecast
14.1. Regional Outlook
14.2. Engineering Software Market Size (US$ Bn) Analysis and Forecast (2018 - 2030)
14.2.1. By Component
14.2.2. By Deployment
14.2.3. By Application
14.2.4. By Enterprise Size
14.3. Engineering Software Market Size (US$ Bn) Forecast, by Country & Sub-region, 2018 - 2030
14.3.1. Saudi Arabia
14.3.2. Kuwait
14.3.3. United Arab Emirates
14.3.4. Qatar
14.3.5. Bahrain
14.3.6. Oman
14.3.7. South Africa
14.3.8. Rest of Middle East & Africa (MEA)
15. South America Engineering Software Market Analysis and Forecast
15.1. Regional Outlook
15.2. Engineering Software Market Size (US$ Bn) Analysis and Forecast (2018 - 2030)
15.2.1. By Component
15.2.2. By Deployment
15.2.3. By Application
15.2.4. By Enterprise Size
15.3. Engineering Software Market Size (US$ Bn) Forecast, by Country & Sub-region, 2018 - 2030
15.3.1. Brazil
15.3.2. Argentina
15.3.3. Rest of South America
16. Competition Landscape
16.1. Market Competition Matrix, by Leading Players
16.2. Market Revenue Share Analysis (%), by Leading Players (2019)
17. Company Profiles
17.1. Altair Engineering Inc.
17.1.1. Business Overview
17.1.2. Product Portfolio
17.1.3. Geographical Footprint
17.1.4. Revenue and Strategy
17.2. Altium Limited
17.2.1. Business Overview
17.2.2. Product Portfolio
17.2.3. Geographical Footprint
17.2.4. Revenue and Strategy
17.3. Ansys, Inc.
17.3.1. Business Overview
17.3.2. Product Portfolio
17.3.3. Geographical Footprint
17.3.4. Revenue and Strategy
17.4. Autodesk, Inc.
17.4.1. Business Overview
17.4.2. Product Portfolio
17.4.3. Geographical Footprint
17.4.4. Revenue and Strategy
17.5. Aveva Group Plc
17.5.1. Business Overview
17.5.2. Product Portfolio
17.5.3. Geographical Footprint
17.5.4. Revenue and Strategy
17.6. Bentley Systems, Inc.
17.6.1. Business Overview
17.6.2. Product Portfolio
17.6.3. Geographical Footprint
17.6.4. Revenue and Strategy
17.7. Dassault Systemes, S.A.
17.7.1. Business Overview
17.7.2. Product Portfolio
17.7.3. Geographical Footprint
17.7.4. Revenue and Strategy
17.8. ESI Group
17.8.1. Business Overview
17.8.2. Product Portfolio
17.8.3. Geographical Footprint
17.8.4. Revenue and Strategy
17.9. ZWSoft Co, Ltd.
17.9.1. Business Overview
17.9.2. Product Portfolio
17.9.3. Geographical Footprint
17.9.4. Revenue and Strategy
17.10. HCL Technologies
17.10.1. Business Overview
17.10.2. Product Portfolio
17.10.3. Geographical Footprint
17.10.4. Revenue and Strategy
17.11. Hexagon AB
17.11.1. Business Overview
17.11.2. Product Portfolio
17.11.3. Geographical Footprint
17.11.4. Revenue and Strategy
17.12. IBM Corporation
17.12.1. Business Overview
17.12.2. Product Portfolio
17.12.3. Geographical Footprint
17.12.4. Revenue and Strategy
17.13. MSC Software Corporation( Hexagon AB) Simscale
17.13.1. Business Overview
17.13.2. Product Portfolio
17.13.3. Geographical Footprint
17.13.4. Revenue and Strategy
17.14. Nemetschek Group
17.14.1. Business Overview
17.14.2. Product Portfolio
17.14.3. Geographical Footprint
17.14.4. Revenue and Strategy
17.15. PTC, Inc.
17.15.1. Business Overview
17.15.2. Product Portfolio
17.15.3. Geographical Footprint
17.15.4. Revenue and Strategy
17.16. SAP SE
17.16.1. Business Overview
17.16.2. Product Portfolio
17.16.3. Geographical Footprint
17.16.4. Revenue and Strategy
17.17. Synopsys, Inc.
17.17.1. Business Overview
17.17.2. Product Portfolio
17.17.3. Geographical Footprint
17.17.4. Revenue and Strategy
17.18. Bricsys NV
17.18.1. Business Overview
17.18.2. Product Portfolio
17.18.3. Geographical Footprint
17.18.4. Revenue and Strategy
17.19. Siemens PLM Software, Inc.
17.19.1. Business Overview
17.19.2. Product Portfolio
17.19.3. Geographical Footprint
17.19.4. Revenue and Strategy
List of Tables
Table 1: Global Engineering Software Market Revenue Analysis, by Country, 2018 - 2030 (US$ Bn)
Table 2: Global Engineering Software Market Revenue Analysis, by Country, 2018 - 2030 (US$ Bn)
Table 3: Global Engineering Software Market Revenue Analysis, by Country, 2018 - 2030 (US$ Bn)
Table 4: Global Engineering Software Market Revenue Analysis, by Country, 2018 - 2030 (US$ Bn)
Table 5: Global Engineering Software Market Revenue Analysis, by Country, 2018 - 2030 (US$ Bn)
Table 6: Forecast Factors: Relevance and Impact
Table 7: Impact Analysis of Drivers & Restraints
Table 8: Global Engineering Software Market Value (US$ Bn) Forecast, by Component, 2018 - 2030
Table 9: Global Engineering Software Market Value (US$ Bn) Forecast, by Component, by Software, 2018 - 2030
Table 10: Global Engineering Software Market Value (US$ Bn) Forecast, by Component, by Service, 2018 - 2030
Table 11: Global Engineering Software Market Value (US$ Bn) Forecast, by Component, by Service, by Professional Services, 2018 - 2030
Table 12: Global Engineering Software Market Value (US$ Bn) Forecast, by Deployment, 2018 - 2030
Table 13: Global Engineering Software Market Value (US$ Bn) Forecast, by Application, 2018 - 2030
Table 14: Global Engineering Software Market Value (US$ Bn) Forecast, by Enterprise Size, 2018 - 2030
Table 15: Global Engineering Software Market Value (US$ Bn) Forecast, by Region, 2018 - 2030
Table 16: North America Engineering Software Market Value (US$ Bn) Forecast, by Component, 2018 - 2030
Table 17: North America Engineering Software Market Value (US$ Bn) Forecast, by Component, by Software, 2018 - 2030
Table 18: North America Engineering Software Market Value (US$ Bn) Forecast, by Component, by Service, 2018 - 2030
Table 19: North America Engineering Software Market Value (US$ Bn) Forecast, by Component, by Service, by Professional Services, 2018 - 2030
Table 20: North AmericaEngineering Software Market Value (US$ Bn) Forecast, by Deployment, 2018 - 2030
Table 21: North America Engineering Software Market Value (US$ Bn) Forecast, by Application, 2018 - 2030
Table 22: North America Engineering Software Market Value (US$ Bn) Forecast, by Enterprise Size, 2018 - 2030
Table 23: North America Engineering Software Market Value (US$ Bn) Forecast, by Country, 2018 - 2030
Table 24: U.S. Engineering Software Market Value (US$ Bn) Forecast, by Component, 2018 - 2030
Table 25: U.S. Engineering Software Market Value (US$ Bn) Forecast, by Component, by Software, 2018 - 2030
Table 26: U.S. Engineering Software Market Value (US$ Bn) Forecast, by Component, by Service, 2018 - 2030
Table 27: U.S. Engineering Software Market Value (US$ Bn) Forecast, by Component, by Service, by Professional Services, 2018 - 2030
Table 28: U.S. Engineering Software Market Value (US$ Bn) Forecast, by Deployment, 2018 - 2030
Table 29: U.S. Engineering Software Market Value (US$ Bn) Forecast, by Application, 2018 - 2030
Table 30: U.S. Engineering Software Market Value (US$ Bn) Forecast, by Enterprise Size, 2018 - 2030
Table 31:Canada Engineering Software Market Value (US$ Bn) Forecast, by Component, 2018 - 2030
Table 32:Canada Engineering Software Market Value (US$ Bn) Forecast, by Component, by Software, 2018 - 2030
Table 33:Canada Engineering Software Market Value (US$ Bn) Forecast, by Component, by Service, 2018 - 2030
Table 34:Canada Engineering Software Market Value (US$ Bn) Forecast, by Component, by Service, by Professional Services, 2018 - 2030
Table 35: Canada Engineering Software Market Value (US$ Bn) Forecast, by Deployment, 2018 - 2030
Table 36: Canada Engineering Software Market Value (US$ Bn) Forecast, by Application, 2018 - 2030
Table 37: Canada Engineering Software Market Value (US$ Bn) Forecast, by Enterprise Size, 2018 - 2030
Table 38: Mexico Engineering Software Market Value (US$ Bn) Forecast, by Component, 2018 - 2030
Table 39: Mexico Engineering Software Market Value (US$ Bn) Forecast, by Component, by Software, 2018 - 2030
Table 40: Mexico Engineering Software Market Value (US$ Bn) Forecast, by Component, by Service, 2018 - 2030
Table 41: Mexico Engineering Software Market Value (US$ Bn) Forecast, by Component, by Service, by Professional Services, 2018 - 2030
Table 42: Mexico Engineering Software Market Value (US$ Bn) Forecast, by Deployment, 2018 - 2030
Table 43: Mexico Engineering Software Market Value (US$ Bn) Forecast, by Application, 2018 - 2030
Table 44: Mexico Engineering Software Market Value (US$ Bn) Forecast, by Enterprise Size, 2018 - 2030
Table 45: Europe Engineering Software Market Value (US$ Bn) Forecast, by Component, 2018 - 2030
Table 46: Europe Engineering Software Market Value (US$ Bn) Forecast, by Component, by Software, 2018 - 2030
Table 47: Europe Engineering Software Market Value (US$ Bn) Forecast, by Component, by Service, 2018 - 2030
Table 48: Europe Engineering Software Market Value (US$ Bn) Forecast, by Component, by Service, by Professional Services, 2018 - 2030
Table 49: Europe Engineering Software Market Value (US$ Bn) Forecast, by Deployment, 2018 - 2030
Table 50: Europe Engineering Software Market Value (US$ Bn) Forecast, by Application, 2018 - 2030
Table 51: Europe Engineering Software Market Value (US$ Bn) Forecast, by Enterprise Size 2018 - 2030
Table 52: Europe Engineering Software Market Value (US$ Bn) Forecast, by Country, 2018 - 2030
Table 53: Germany Engineering Software Market Value (US$ Bn) Forecast, by Component, 2018 - 2030
Table 54: Germany Engineering Software Market Value (US$ Bn) Forecast, by Component, by Software, 2018 - 2030
Table 55: Germany Engineering Software Market Value (US$ Bn) Forecast, by Component, by Service, 2018 - 2030
Table 56: Germany Engineering Software Market Value (US$ Bn) Forecast, by Component, by Service, by Professional Services, 2018 - 2030
Table 57: Germany Engineering Software Market Value (US$ Bn) Forecast, by Deployment, 2018 - 2030
Table 58: Germany Engineering Software Market Value (US$ Bn) Forecast, by Application, 2018 - 2030
Table 59: Germany Engineering Software Market Value (US$ Bn) Forecast, by Enterprise Size, 2018 - 2030
Table 60: U.K Engineering Software Market Value (US$ Bn) Forecast, by Component, 2018 - 2030
Table 61: U.K Engineering Software Market Value (US$ Bn) Forecast, by Component, by Software, 2018 - 2030
Table 62: U.K Engineering Software Market Value (US$ Bn) Forecast, by Component, by Service, 2018 - 2030
Table 63: U.K Engineering Software Market Value (US$ Bn) Forecast, by Component, by Service, by Professional Services, 2018 - 2030
Table 64: U.K Engineering Software Market Value (US$ Bn) Forecast, by Deployment, 2018 - 2030
Table 65: U.K Engineering Software Market Value (US$ Bn) Forecast, by Application, 2018 - 2030
Table 66: U.K Engineering Software Market Value (US$ Bn) Forecast, by Enterprise Size, 2018 - 2030
Table 67: France Engineering Software Market Value (US$ Bn) Forecast, by Component, 2018 - 2030
Table 68: France Engineering Software Market Value (US$ Bn) Forecast, by Component, by Software, 2018 - 2030
Table 69: France Engineering Software Market Value (US$ Bn) Forecast, by Component, by Service, 2018 - 2030
Table 70: France Engineering Software Market Value (US$ Bn) Forecast, by Component, by Service, by Professional Services, 2018 - 2030
Table 71: France Engineering Software Market Value (US$ Bn) Forecast, by Deployment, 2018 - 2030
Table 72: France Engineering Software Market Value (US$ Bn) Forecast, by Application, 2018 - 2030
Table 73: France Engineering Software Market Value (US$ Bn) Forecast, by Enterprise Size, 2018 - 2030
Table 74: Italy Engineering Software Market Value (US$ Bn) Forecast, by Component, 2018 - 2030
Table 75: Italy Engineering Software Market Value (US$ Bn) Forecast, by Component, by Software, 2018 - 2030
Table 76: Italy Engineering Software Market Value (US$ Bn) Forecast, by Component, by Service, 2018 - 2030
Table 77: Italy Engineering Software Market Value (US$ Bn) Forecast, by Component, by Service, by Professional Services, 2018 - 2030
Table 78: Italy Engineering Software Market Value (US$ Bn) Forecast, by Deployment, 2018 - 2030
Table 79: Italy Engineering Software Market Value (US$ Bn) Forecast, by Application, 2018 - 2030
Table 80: Italy Engineering Software Market Value (US$ Bn) Forecast, by Enterprise Size, 2018 - 2030
Table 81: Spain Engineering Software Market Value (US$ Bn) Forecast, by Component, 2018 - 2030
Table 82: Spain Engineering Software Market Value (US$ Bn) Forecast, by Component, by Software, 2018 - 2030
Table 83: Spain Engineering Software Market Value (US$ Bn) Forecast, by Component, by Service, 2018 - 2030
Table 84: Spain Engineering Software Market Value (US$ Bn) Forecast, by Component, by Service, by Professional Services, 2018 - 2030
Table 85: Spain Engineering Software Market Value (US$ Bn) Forecast, by Deployment, 2018 - 2030
Table 86: Spain Engineering Software Market Value (US$ Bn) Forecast, by Application, 2018 - 2030
Table 87: Spain Engineering Software Market Value (US$ Bn) Forecast, by Enterprise Size, 2018 - 2030
Table 88: Rest of Europe Engineering Software Market Value (US$ Bn) Forecast, by Component, 2018 - 2030
Table 89: Rest of Europe Engineering Software Market Value (US$ Bn) Forecast, by Component, by Software, 2018 - 2030
Table 90: Rest of Europe Engineering Software Market Value (US$ Bn) Forecast, by Component, by Service, 2018 - 2030
Table 91: Rest of Europe Engineering Software Market Value (US$ Bn) Forecast, by Component, by Service, by Professional Services, 2018 - 2030
Table 92: Rest of Europe Engineering Software Market Value (US$ Bn) Forecast, by Deployment, 2018 - 2030
Table 93: Rest of Europe Engineering Software Market Value (US$ Bn) Forecast, by Application, 2018 - 2030
Table 94: Rest of Europe Engineering Software Market Value (US$ Bn) Forecast, by Enterprise Size, 2018 - 2030
Table 95: Asia-Pacific Engineering Software Market Value (US$ Bn) Forecast, by Component, 2018 - 2030
Table 96: Asia-Pacific Engineering Software Market Value (US$ Bn) Forecast, by Component, by Software, 2018 - 2030
Table 97: Asia-Pacific Engineering Software Market Value (US$ Bn) Forecast, by Component, by Services, 2018 - 2030
Table 98: Asia-Pacific Engineering Software Market Value (US$ Bn) Forecast, by Component, by Professional Services 2018 - 2030
Table 99: Asia-Pacific Engineering Software Market Value (US$ Bn) Forecast, by Deployment, 2018 - 2030
Table 100: Asia-Pacific Engineering Software Market Value (US$ Bn) Forecast, by Application, 2018 - 2030
Table 101: Asia-Pacific Engineering Software Market Value (US$ Bn) Forecast, by Enterprise Size, 2018 - 2030
Table 102: Asia-Pacific Engineering Software Market Value (US$ Bn) Forecast, by Country, 2018 - 2030
Table 103: China Engineering Software Market Value (US$ Bn) Forecast, by Component, 2018 - 2030
Table 104: China Engineering Software Market Value (US$ Bn) Forecast, by Component, by Software, 2018 - 2030
Table 105: China Engineering Software Market Value (US$ Bn) Forecast, by Component, by Services, 2018 - 2030
Table 106: China Engineering Software Market Value (US$ Bn) Forecast, by Component, by Professional Services 2018 - 2030
Table 107: China Engineering Software Market Value (US$ Bn) Forecast, by Deployment, 2018 - 2030
Table 108: China Engineering Software Market Value (US$ Bn) Forecast, by Application, 2018 - 2030
Table 109: China Engineering Software Market Value (US$ Bn) Forecast, by Enterprise Size, 2018 - 2030
Table 110: Japan Engineering Software Market Value (US$ Bn) Forecast, by Component, 2018 - 2030
Table 111: Japan Engineering Software Market Value (US$ Bn) Forecast, by Component, by Software, 2018 - 2030
Table 112: Japan Engineering Software Market Value (US$ Bn) Forecast, by Component, by Services, 2018 - 2030
Table 113: Japan Engineering Software Market Value (US$ Bn) Forecast, by Component, by Professional Services 2018 - 2030
Table 114: Japan Engineering Software Market Value (US$ Bn) Forecast, by Deployment, 2018 - 2030
Table 115: Japan Engineering Software Market Value (US$ Bn) Forecast, by Application, 2018 - 2030
Table 116: Japan Engineering Software Market Value (US$ Bn) Forecast, by Enterprise Size, 2018 - 2030
Table 117: India Engineering Software Market Value (US$ Bn) Forecast, by Component, 2018 - 2030
Table 118: India Engineering Software Market Value (US$ Bn) Forecast, by Component, by Software, 2018 - 2030
Table 119: India Engineering Software Market Value (US$ Bn) Forecast, by Component, by Services, 2018 - 2030
Table 120: India Engineering Software Market Value (US$ Bn) Forecast, by Component, by Professional Services 2018 - 2030
Table 121: India Engineering Software Market Value (US$ Bn) Forecast, by Deployment, 2018 - 2030
Table 122: India Engineering Software Market Value (US$ Bn) Forecast, by Application, 2018 - 2030
Table 123: India Engineering Software Market Value (US$ Bn) Forecast, by Enterprise Size, 2018 - 2030
Table 124: ASEAN Engineering Software Market Value (US$ Bn) Forecast, by Component, 2018 - 2030
Table 125: ASEAN Engineering Software Market Value (US$ Bn) Forecast, by Component, by Software, 2018 - 2030
Table 126: ASEAN Engineering Software Market Value (US$ Bn) Forecast, by Component, by Services, 2018 - 2030
Table 127: ASEAN Engineering Software Market Value (US$ Bn) Forecast, by Component, by Professional Services 2018 - 2030
Table 128: ASEAN Engineering Software Market Value (US$ Bn) Forecast, by Deployment, 2018 - 2030
Table 129: ASEAN Engineering Software Market Value (US$ Bn) Forecast, by Application, 2018 - 2030
Table 130: ASEAN Engineering Software Market Value (US$ Bn) Forecast, by Enterprise Size, 2018 - 2030
Table 131: Middle East & Africa Engineering Software Market Value (US$ Bn) Forecast, by Component, 2018 - 2030
Table 132: Middle East & Africa Engineering Software Market Value (US$ Bn) Forecast, by Component, by Software, 2018 - 2030
Table 133: Middle East & Africa Engineering Software Market Value (US$ Bn) Forecast, by Component, by Services, 2018 - 2030
Table 134: Middle East & Africa Engineering Software Market Value (US$ Bn) Forecast, by Component, by Professional Services 2018 - 2030
Table 135: Middle East & Africa Engineering Software Market Value (US$ Bn) Forecast, by Deployment, 2018 - 2030
Table 136: Middle East & Africa Engineering Software Market Value (US$ Bn) Forecast, by Application, 2018 - 2030
Table 137: Middle East & Africa Engineering Software Market Value (US$ Bn) Forecast, by Enterprise Size, 2018 - 2030
Table 138: Middle East & Africa Engineering Software Market Value (US$ Bn) Forecast, by Country, 2018 - 2030
Table 139: Saudi Arabia Engineering Software Market Value (US$ Bn) Forecast, by Component, 2018 - 2030
Table 140: Saudi Arabia Engineering Software Market Value (US$ Bn) Forecast, by Component, by Software, 2018 - 2030
Table 141: Saudi Arabia Engineering Software Market Value (US$ Bn) Forecast, by Component, by Services, 2018 - 2030
Table 142: Saudi Arabia Engineering Software Market Value (US$ Bn) Forecast, by Component, by Professional Services 2018 - 2030
Table 143: Saudi Arabia Engineering Software Market Value (US$ Bn) Forecast, by Deployment, 2018 - 2030
Table 144: Saudi Arabia Engineering Software Market Value (US$ Bn) Forecast, by Application, 2018 - 2030
Table 145: Saudi Arabia Engineering Software Market Value (US$ Bn) Forecast, by Enterprise Size, 2018 - 2030
Table 146: UAE Engineering Software Market Value (US$ Bn) Forecast, by Component, 2018 - 2030
Table 147: UAE Engineering Software Market Value (US$ Bn) Forecast, by Component, by Software, 2018 - 2030
Table 148: UAE Engineering Software Market Value (US$ Bn) Forecast, by Component, by Services, 2018 - 2030
Table 149: UAE Engineering Software Market Value (US$ Bn) Forecast, by Component, by Professional Services 2018 - 2030
Table 150: UAE Engineering Software Market Value (US$ Bn) Forecast, by Deployment, 2018 - 2030
Table 151: UAE Engineering Software Market Value (US$ Bn) Forecast, by Application, 2018 - 2030
Table 152: UAE Engineering Software Market Value (US$ Bn) Forecast, by Enterprise Size, 2018 - 2030
Table 153: South Africa Engineering Software Market Value (US$ Bn) Forecast, by Component, 2018 - 2030
Table 154: South Africa Engineering Software Market Value (US$ Bn) Forecast, by Component, by Software, 2018 - 2030
Table 155: South Africa Engineering Software Market Value (US$ Bn) Forecast, by Component, by Services, 2018 - 2030
Table 156: South Africa Engineering Software Market Value (US$ Bn) Forecast, by Component, by Services, by Professional Services 2018 - 2030
Table 157: South Africa Engineering Software Market Value (US$ Bn) Forecast, by Deployment, 2018 - 2030
Table 158: South Africa Engineering Software Market Value (US$ Bn) Forecast, by Application, 2018 - 2030
Table 159: South Africa Engineering Software Market Value (US$ Bn) Forecast, by Enterprise Size, 2018 - 2030
Table 160: Bahrain Engineering Software Market Value (US$ Bn) Forecast, by Component, 2018 - 2030
Table 161: Bahrain Engineering Software Market Value (US$ Bn) Forecast, by Component, by Software, 2018 - 2030
Table 162: Bahrain Engineering Software Market Value (US$ Bn) Forecast, by Component, by Services, 2018 - 2030
Table 163: Bahrain Engineering Software Market Value (US$ Bn) Forecast, by Component, by Services, by Professional Services 2018 - 2030
Table 164: Bahrain Engineering Software Market Value (US$ Bn) Forecast, by Deployment, 2018 - 2030
Table 165: Bahrain Engineering Software Market Value (US$ Bn) Forecast, by Application, 2018 - 2030
Table 166: Bahrain Engineering Software Market Value (US$ Bn) Forecast, by Enterprise Size, 2018 - 2030
Table 167: Kuwait Engineering Software Market Value (US$ Bn) Forecast, by Component, 2018 - 2030
Table 168: Kuwait Engineering Software Market Value (US$ Bn) Forecast, by Component, by Software, 2018 - 2030
Table 169: Kuwait Engineering Software Market Value (US$ Bn) Forecast, by Component, by Services, 2018 - 2030
Table 170: Kuwait Engineering Software Market Value (US$ Bn) Forecast, by Component, by Services, by Professional Services 2018 - 2030
Table 171: Kuwait Engineering Software Market Value (US$ Bn) Forecast, by Deployment, 2018 - 2030
Table 172: Kuwait Engineering Software Market Value (US$ Bn) Forecast, by Application, 2018 - 2030
Table 173: Kuwait Engineering Software Market Value (US$ Bn) Forecast, by Enterprise Size, 2018 - 2030
Table 174: Oman Engineering Software Market Value (US$ Bn) Forecast, by Component, 2018 - 2030
Table 175: Oman Engineering Software Market Value (US$ Bn) Forecast, by Component, by Software, 2018 - 2030
Table 176: Oman Engineering Software Market Value (US$ Bn) Forecast, by Component, by Services, 2018 - 2030
Table 177: Oman Engineering Software Market Value (US$ Bn) Forecast, by Component, by Services, by Professional Services 2018 - 2030
Table 178: Oman Engineering Software Market Value (US$ Bn) Forecast, by Deployment, 2018 - 2030
Table 179: Oman Engineering Software Market Value (US$ Bn) Forecast, by Application, 2018 - 2030
Table 180: Oman Engineering Software Market Value (US$ Bn) Forecast, by Enterprise Size, 2018 - 2030
Table 181: Qatar Engineering Software Market Value (US$ Bn) Forecast, by Component, 2018 - 2030
Table 182: Qatar Engineering Software Market Value (US$ Bn) Forecast, by Component, by Software, 2018 - 2030
Table 183: Qatar Engineering Software Market Value (US$ Bn) Forecast, by Component, by Services, 2018 - 2030
Table 184: Qatar Engineering Software Market Value (US$ Bn) Forecast, by Component, by Services, by Professional Services 2018 - 2030
Table 185: Qatar Engineering Software Market Value (US$ Bn) Forecast, by Deployment, 2018 - 2030
Table 186: Qatar Engineering Software Market Value (US$ Bn) Forecast, by Application, 2018 - 2030
Table 187: Qatar Engineering Software Market Value (US$ Bn) Forecast, by Enterprise Size, 2018 - 2030
Table 188: South America Engineering Software Market Value (US$ Bn) Forecast, by Component, 2018 - 2030
Table 189: South America Engineering Software Market Value (US$ Bn) Forecast, by Component, by Software, 2018 - 2030
Table 190: South America Engineering Software Market Value (US$ Bn) Forecast, by Component, by Service, 2018 - 2030
Table 191: South America Engineering Software Market Value (US$ Bn) Forecast, by Component, by Service, by Professional Services, 2018 - 2030
Table 192: South America Engineering Software Market Value (US$ Bn) Forecast, by Deployment, 2018 - 2030
Table 193: South America Engineering Software Market Value (US$ Bn) Forecast, by Application, 2018 - 2030
Table 194: South America Engineering Software Market Value (US$ Bn) Forecast, by Enterprise Size, 2018 - 2030
Table 195: South America Engineering Software Market Value (US$ Bn) Forecast, by Country, 2018 - 2030
Table 196: Brazil Engineering Software Market Value (US$ Bn) Forecast, by Component, 2018 - 2030
Table 197: Brazil Engineering Software Market Value (US$ Bn) Forecast, by Component, by Software, 2018 - 2030
Table 198: Brazil Engineering Software Market Value (US$ Bn) Forecast, by Component, by Service, 2018 - 2030
Table 199: Brazil Engineering Software Market Value (US$ Bn) Forecast, by Component, by Service, by Professional Services, 2018 - 2030
Table 200: Brazil Engineering Software Market Value (US$ Bn) Forecast, by Deployment, 2018 - 2030
Table 201: Brazil Engineering Software Market Value (US$ Bn) Forecast, by Application, 2018 - 2030
Table 202 : Brazil Engineering Software Market Value (US$ Bn) Forecast, by Enterprise Size, 2018 - 2030
Table 203: Argentina Engineering Software Market Value (US$ Bn) Forecast, by Component, 2018 - 2030
Table 204: Argentina Engineering Software Market Value (US$ Bn) Forecast, by Component, by Software, 2018 - 2030
Table 205: Argentina Engineering Software Market Value (US$ Bn) Forecast, by Component, by Service, 2018 - 2030
Table 206: Argentina Engineering Software Market Value (US$ Bn) Forecast, by Component, by Service, by Professional Services, 2018 - 2030
Table 207: Argentina Engineering Software Market Value (US$ Bn) Forecast, by Deployment, 2018 - 2030
Table 208: Argentina Engineering Software Market Value (US$ Bn) Forecast, by Application, 2018 - 2030
Table 209: Argentina Engineering Software Market Value (US$ Bn) Forecast, by Enterprise Size, 2018 - 2030
Table 210: Rest of South America Engineering Software Market Value (US$ Bn) Forecast, by Component, 2018 - 2030
Table 211: Rest of South America Engineering Software Market Value (US$ Bn) Forecast, by Component, by Software, 2018 - 2030
Table 212: Rest of South America Engineering Software Market Value (US$ Bn) Forecast, by Component, by Service, 2018 - 2030
Table 213: Rest of South America Engineering Software Market Value (US$ Bn) Forecast, by Component, by Service, by Professional Services, 2018 - 2030
Table 214: Rest of South America Engineering Software Market Value (US$ Bn) Forecast, by Deployment, 2018 - 2030
Table 215: Rest of South America Engineering Software Market Value (US$ Bn) Forecast, by Application, 2018 - 2030
Table 216 Rest of South America Engineering Software Market Value (US$ Bn) Forecast, by Enterprise Size, 2018 - 2030
List of Figures
Figure 1: Global Engineering Software Market Size (US$ Bn) Forecast, 2018–2030
Figure 2: Global Engineering Software Market Revenue (US$ Bn) Opportunity Assessment, by Region, 2020E
Figure 3: Top Segment Analysis
Figure 4: Global Engineering Software Market Revenue (US$ Bn) Opportunity Assessment, by Region, 2030F
Figure 5: Global Engineering Software Market Opportunity Assessment, by Component
Figure 6: Global Engineering Software Market Opportunity Assessment, by Deployment
Figure 7: Global Engineering Software Market Opportunity Assessment, by Application
Figure 8: Global Engineering Software Market Opportunity Assessment, by Enterprise Size
Figure 9: Global Engineering Software Market Attractiveness Assessment, by Region
Figure 10: Global Engineering Software Market Revenue (US$ Bn) Historic Trends, 2015 - 2019
Figure 11: Global Engineering Software Market Revenue Opportunity (US$ Bn) Historic Trends, 2015 - 2019
Figure 12: Global Engineering Software Market Y-o-Y Growth (Revenue %) Forecast, 2020 - 2030
Figure 13: Global Engineering Software Market Revenue Opportunity (US$ Bn) Forecast, 2020 - 2030
Figure 14: Global Engineering Software Market Value Share Analysis, by Component, 2020
Figure 15: Global Engineering Software Market Value Share Analysis, by Component, 2030
Figure 16: Global Engineering Software Market Value Share Analysis, by Deployment, 2020
Figure 17: Global Engineering Software Market Value Share Analysis, by Deployment, 2030
Figure 18: Global Engineering Software Market Value Share Analysis, by Application, 2020
Figure 19: Global Engineering Software Market Value Share Analysis, by Application, 2030
Figure 20: Global Engineering Software Market Value Share Analysis, by Enterprise Size, 2020
Figure 21: Global Engineering Software Market Value Share Analysis, by Enterprise Size, 2030
Figure 22: Global Engineering Software Market Value Share Analysis, by Region, 2020
Figure 23: Global Engineering Software Market Value Share Analysis, by Region, 2030
Figure 24: North America Engineering Software Market Value Share Analysis, by Component, 2020
Figure 25: North America Engineering Software Market Value Share Analysis, by Component, 2030
Figure 26: North America Engineering Software Market Value Share Analysis, by Deployment, 2020
Figure 27: North America Engineering Software Market Value Share Analysis, by Deployment, 2030
Figure 28: North America Engineering Software Market Value Share Analysis, by Application, 2020
Figure 29: North America Engineering Software Market Value Share Analysis, by Application, 2030
Figure 30: North America Engineering Software Market Value Share Analysis, by Enterprise Size, 2020
Figure 31: North America Engineering Software Market Value Share Analysis, by Enterprise Size 2030
Figure 32: North America Engineering Software Market Value Share Analysis, by Country, 2020
Figure 33: North America Engineering Software Market Value Share Analysis, by Country, 2030
Figure 34: U.S. Engineering Software Market Value Share Analysis, by Component, 2020
Figure 35: U.S. Engineering Software Market Value Share Analysis, by Component, 2030
Figure 36: U.S. Engineering Software Market Value Share Analysis, by Deployment, 2020
Figure 37: U.S. Engineering Software Market Value Share Analysis, by Deployment, 2030
Figure 38: U.S. Engineering Software Market Value Share Analysis, by Application, 2020
Figure 39: U.S. Engineering Software Market Value Share Analysis, by Application, 2030
Figure 40: U.S. Engineering Software Market Value Share Analysis, by Enterprise Size, 2020
Figure 41: U.S. Engineering Software Market Value Share Analysis, by Enterprise Size 2030
Figure 42: Canada Engineering Software Market Value Share Analysis, by Component, 2020
Figure 43: Canada Engineering Software Market Value Share Analysis, by Component, 2030
Figure 44: Canada Engineering Software Market Value Share Analysis, by Deployment, 2020
Figure 45: Canada Engineering Software Market Value Share Analysis, by Deployment, 2030
Figure 46: Canada Engineering Software Market Value Share Analysis, by Application, 2020
Figure 47: Canada Engineering Software Market Value Share Analysis, by Application, 2030
Figure 48: Canada Engineering Software Market Value Share Analysis, by Enterprise Size, 2020
Figure 49: CanadaEngineering Software Market Value Share Analysis, by Enterprise Size 2030
Figure 50: Mexico Engineering Software Market Value Share Analysis, by Component, 2020
Figure 51: Mexico Engineering Software Market Value Share Analysis, by Component, 2030
Figure 52: Mexico Engineering Software Market Value Share Analysis, by Deployment, 2020
Figure 53: Mexico Engineering Software Market Value Share Analysis, by Deployment, 2030
Figure 54: Mexico Engineering Software Market Value Share Analysis, by Application, 2020
Figure 55: Mexico Engineering Software Market Value Share Analysis, by Application, 2030
Figure 56: Mexico Engineering Software Market Value Share Analysis, by Enterprise Size, 2020
Figure 57: MexicoEngineering Software Market Value Share Analysis, by Enterprise Size 2030
Figure 58: Europe Engineering Software Market Value Share Analysis, by Component, 2020
Figure 59: Europe Engineering Software Market Value Share Analysis, by Component, 2030
Figure 60: Europe Engineering Software Market Value Share Analysis, by Deployment, 2020
Figure 61: Europe Engineering Software Market Value Share Analysis, by Deployment, 2030
Figure 62: Europe Engineering Software Market Value Share Analysis, by Application, 2020
Figure 63: Europe Engineering Software Market Value Share Analysis, by Application, 2030
Figure 64: Europe Engineering Software Market Value Share Analysis, by Enterprise Size, 2020
Figure 65: Europe Engineering Software Market Value Share Analysis, by Enterprise Size 2030
Figure 66: Europe Engineering Software Market Value Share Analysis, by Country, 2020
Figure 67: Europe Engineering Software Market Value Share Analysis, by Country, 2030
Figure 68: Germany Engineering Software Market Value Share Analysis, by Component, 2020
Figure 69: Germany Engineering Software Market Value Share Analysis, by Component, 2030
Figure 70: Germany Engineering Software Market Value Share Analysis, by Deployment, 2020
Figure 71: Germany Engineering Software Market Value Share Analysis, by Deployment, 2030
Figure 72: Germany Engineering Software Market Value Share Analysis, by Application, 2020
Figure 73: Germany Engineering Software Market Value Share Analysis, by Application, 2030
Figure 74: Germany Engineering Software Market Value Share Analysis, by Enterprise Size, 2020
Figure 75: Germany Engineering Software Market Value Share Analysis, by Enterprise Size 2030
Figure 76: U.K Engineering Software Market Value Share Analysis, by Component, 2020
Figure 77: U.K Engineering Software Market Value Share Analysis, by Component, 2030
Figure 78: U.K Engineering Software Market Value Share Analysis, by Deployment, 2020
Figure 79: U.K Engineering Software Market Value Share Analysis, by Deployment, 2030
Figure 80: U.K Engineering Software Market Value Share Analysis, by Application, 2020
Figure 81: U.K Engineering Software Market Value Share Analysis, by Application, 2030
Figure 82: U.K Engineering Software Market Value Share Analysis, by Enterprise Size, 2020
Figure 83: U.K Engineering Software Market Value Share Analysis, by Enterprise Size 2030
Figure 84: France Engineering Software Market Value Share Analysis, by Component, 2020
Figure 85: France Engineering Software Market Value Share Analysis, by Component, 2030
Figure 86: France Engineering Software Market Value Share Analysis, by Deployment, 2020
Figure 87: France Engineering Software Market Value Share Analysis, by Deployment, 2030
Figure 88: France Engineering Software Market Value Share Analysis, by Application, 2020
Figure 89: France Engineering Software Market Value Share Analysis, by Application, 2030
Figure 90: France Engineering Software Market Value Share Analysis, by Enterprise Size, 2020
Figure 91: France Engineering Software Market Value Share Analysis, by Enterprise Size 2030
Figure 92: Italy Engineering Software Market Value Share Analysis, by Component, 2020
Figure 93: Italy Engineering Software Market Value Share Analysis, by Component, 2030
Figure 94: Italy Engineering Software Market Value Share Analysis, by Deployment, 2020
Figure 95: Italy Engineering Software Market Value Share Analysis, by Deployment, 2030
Figure 96: Italy Engineering Software Market Value Share Analysis, by Application, 2020
Figure 97: Italy Engineering Software Market Value Share Analysis, by Application, 2030
Figure 98: Italy Engineering Software Market Value Share Analysis, by Enterprise Size, 2020
Figure 99: Italy Engineering Software Market Value Share Analysis, by Enterprise Size 2030
Figure 100: Spain Engineering Software Market Value Share Analysis, by Component, 2020
Figure 101: Spain Engineering Software Market Value Share Analysis, by Component, 2030
Figure 102: Spain Engineering Software Market Value Share Analysis, by Deployment, 2020
Figure 103: Spain Engineering Software Market Value Share Analysis, by Deployment, 2030
Figure 104: Spain Engineering Software Market Value Share Analysis, by Application, 2020
Figure 105: Spain Engineering Software Market Value Share Analysis, by Application, 2030
Figure 106: Spain Engineering Software Market Value Share Analysis, by Enterprise Size, 2020
Figure 107: Spain Engineering Software Market Value Share Analysis, by Enterprise Size 2030
Figure 108: Rest of Europe Engineering Software Market Value Share Analysis, by Component, 2020
Figure 109: Rest of Europe Engineering Software Market Value Share Analysis, by Component, 2030
Figure 110: Rest of Europe Engineering Software Market Value Share Analysis, by Deployment, 2020
Figure 111: Rest of Europe Engineering Software Market Value Share Analysis, by Deployment, 2030
Figure 112: Rest of Europe Engineering Software Market Value Share Analysis, by Application, 2020
Figure 113: Rest of Europe Engineering Software Market Value Share Analysis, by Application, 2030
Figure 114: Rest of Europe Engineering Software Market Value Share Analysis, by Enterprise Size, 2020
Figure 115: Rest of Europe Engineering Software Market Value Share Analysis, by Enterprise Size 2030
Figure 116: Asia-Pacific Engineering Software Market Value Share Analysis, by Component, 2020
Figure 117: Asia-Pacific Engineering Software Market Value Share Analysis, by Component, 2030
Figure 118: Asia-Pacific Engineering Software Market Value Share Analysis, by Deployment , 2020
Figure 119: Asia-Pacific Engineering Software Market Value Share Analysis, by Deployment, 2030
Figure 120: Asia-Pacific Engineering Software Market Value Share Analysis, by Application, 2020
Figure 121: Asia-Pacific Engineering Software Market Value Share Analysis, by Application, 2030
Figure 122: Asia-Pacific Engineering Software Market Value Share Analysis, by Enterprise Size, 2020
Figure 123: Asia-Pacific Engineering Software Market Value Share Analysis, by Enterprise Size, 2030
Figure 124: Asia-Pacific Engineering Software Market Value Share Analysis, by Country, 2020
Figure 125: Asia-Pacific Engineering Software Market Value Share Analysis, by Country, 2030
Figure 126: China Engineering Software Market Value Share Analysis, by Component, 2020
Figure 127: China Engineering Software Market Value Share Analysis, by Component, 2030
Figure 128: China Engineering Software Market Value Share Analysis, by Deployment, 2020
Figure 129: China Engineering Software Market Value Share Analysis, by Deployment , 2030
Figure 130: China Engineering Software Market Value Share Analysis, by Application, 2020
Figure 131: China Engineering Software Market Value Share Analysis, by Application, 2030
Figure 132: China Engineering Software Market Value Share Analysis, by Enterprise Size, 2020
Figure 133: China Engineering Software Market Value Share Analysis, by Enterprise Size, 2030
Figure 134: Japan Engineering Software Market Value Share Analysis, by Component, 2020
Figure 135: Japan Engineering Software Market Value Share Analysis, by Component, 2030
Figure 136: Japan Engineering Software Market Value Share Analysis, by Deployment, 2020
Figure 137: Japan Engineering Software Market Value Share Analysis, by Deployment , 2030
Figure 138: Japan Engineering Software Market Value Share Analysis, by Application, 2020
Figure 139: Japan Engineering Software Market Value Share Analysis, by Application, 2030
Figure 140: Japan Engineering Software Market Value Share Analysis, by Enterprise Size, 2020
Figure 141: Japan Engineering Software Market Value Share Analysis, by Enterprise Size, 2030
Figure 142: India Engineering Software Market Value Share Analysis, by Component, 2020
Figure 143: India Engineering Software Market Value Share Analysis, by Component, 2030
Figure 144: India Engineering Software Market Value Share Analysis, by Deployment, 2020
Figure 145: India Engineering Software Market Value Share Analysis, by Deployment , 2030
Figure 146: India Engineering Software Market Value Share Analysis, by Application, 2020
Figure 147: India Engineering Software Market Value Share Analysis, by Application, 2030
Figure 148: India Engineering Software Market Value Share Analysis, by Enterprise Size, 2020
Figure 149: India Engineering Software Market Value Share Analysis, by Enterprise Size, 2030
Figure 150: ASEAN Engineering Software Market Value Share Analysis, by Component, 2020
Figure 151: ASEAN Engineering Software Market Value Share Analysis, by Component, 2030
Figure 152: ASEAN Engineering Software Market Value Share Analysis, by Deployment, 2020
Figure 153: ASEAN Engineering Software Market Value Share Analysis, by Deployment , 2030
Figure 154: ASEAN Engineering Software Market Value Share Analysis, by Application, 2020
Figure 155: ASEAN Engineering Software Market Value Share Analysis, by Application, 2030
Figure 156: ASEAN Engineering Software Market Value Share Analysis, by Enterprise Size, 2020
Figure 157: ASEAN Engineering Software Market Value Share Analysis, by Enterprise Size, 2030
Figure 158: Middle East & Africa Engineering Software Market Value Share Analysis, by Component, 2020
Figure 159: Middle East & Africa Engineering Software Market Value Share Analysis, by Component, 2030
Figure 160: Middle East & Africa Engineering Software Market Value Share Analysis, by Deployment, 2020
Figure 161: Middle East & Africa Engineering Software Market Value Share Analysis, by Deployment , 2030
Figure 162: Middle East & Africa Engineering Software Market Value Share Analysis, by Application, 2020
Figure 163: Middle East & Africa Engineering Software Market Value Share Analysis, by Application, 2030
Figure 164: Middle East & Africa Engineering Software Market Value Share Analysis, by Enterprise Size, 2020
Figure 165: Middle East & Africa Engineering Software Market Value Share Analysis, by Enterprise Size, 2030
Figure 166: Middle East & Africa Engineering Software Market Value Share Analysis, by Country, 2020
Figure 167: Middle East & Africa Engineering Software Market Value Share Analysis, by Country, 2030
Figure 168: Saudi Arabia Engineering Software Market Value Share Analysis, by Component, 2020
Figure 169: Saudi Arabia Engineering Software Market Value Share Analysis, by Component, 2030
Figure 170: Saudi Arabia Engineering Software Market Value Share Analysis, by Deployment, 2020
Figure 171: Saudi Arabia Engineering Software Market Value Share Analysis, by Deployment , 2030
Figure 172: Saudi Arabia Engineering Software Market Value Share Analysis, by Application, 2020
Figure 173: Saudi Arabia Engineering Software Market Value Share Analysis, by Application, 2030
Figure 174: Saudi Arabia Engineering Software Market Value Share Analysis, by Enterprise Size, 2020
Figure 175: Saudi Arabia Engineering Software Market Value Share Analysis, by Enterprise Size, 2030
Figure 176: UAE Engineering Software Market Value Share Analysis, by Component, 2020
Figure 177: UAE Engineering Software Market Value Share Analysis, by Component, 2030
Figure 178: UAE Engineering Software Market Value Share Analysis, by Deployment, 2020
Figure 179: UAE Engineering Software Market Value Share Analysis, by Deployment , 2030
Figure 180: UAE Engineering Software Market Value Share Analysis, by Application, 2020
Figure 181: UAE Engineering Software Market Value Share Analysis, by Application, 2030
Figure 182: UAE Engineering Software Market Value Share Analysis, by Enterprise Size, 2020
Figure 183: UAE Engineering Software Market Value Share Analysis, by Enterprise Size, 2030
Figure 184: South Africa Engineering Software Market Value Share Analysis, by Component, 2020
Figure 185: South Africa Engineering Software Market Value Share Analysis, by Component, 2030
Figure 186: South Africa Engineering Software Market Value Share Analysis, by Deployment, 2020
Figure 187: South Africa Engineering Software Market Value Share Analysis, by Deployment , 2030
Figure 188: South Africa Engineering Software Market Value Share Analysis, by Application, 2020
Figure 189: South Africa Engineering Software Market Value Share Analysis, by Application, 2030
Figure 190: South Africa Engineering Software Market Value Share Analysis, by Enterprise Size, 2020
Figure 191: South Africa Engineering Software Market Value Share Analysis, by Enterprise Size, 2030
Figure 192: Bahrain Engineering Software Market Value Share Analysis, by Component, 2020
Figure 193: Bahrain Engineering Software Market Value Share Analysis, by Component, 2030
Figure 194: Bahrain Engineering Software Market Value Share Analysis, by Deployment, 2020
Figure 195: Bahrain Engineering Software Market Value Share Analysis, by Deployment , 2030
Figure 196: Bahrain Engineering Software Market Value Share Analysis, by Application, 2020
Figure 197: Bahrain Engineering Software Market Value Share Analysis, by Application, 2030
Figure 198: Bahrain Engineering Software Market Value Share Analysis, by Enterprise Size, 2020
Figure 199: Bahrain Engineering Software Market Value Share Analysis, by Enterprise Size, 2030
Figure 200: Kuwait Engineering Software Market Value Share Analysis, by Component, 2020
Figure 201: Kuwait Engineering Software Market Value Share Analysis, by Component, 2030
Figure 202: Kuwait Engineering Software Market Value Share Analysis, by Deployment, 2020
Figure 203: Kuwait Engineering Software Market Value Share Analysis, by Deployment , 2030
Figure 204: Kuwait Engineering Software Market Value Share Analysis, by Application, 2020
Figure 205: Kuwait Engineering Software Market Value Share Analysis, by Application, 2030
Figure 206: Kuwait Engineering Software Market Value Share Analysis, by Enterprise Size, 2020
Figure 207: Kuwait Engineering Software Market Value Share Analysis, by Enterprise Size, 2030
Figure 208: Oman Engineering Software Market Value Share Analysis, by Component, 2020
Figure 209: Oman Engineering Software Market Value Share Analysis, by Component, 2030
Figure 210: Oman Engineering Software Market Value Share Analysis, by Deployment, 2020
Figure 211: Oman Engineering Software Market Value Share Analysis, by Deployment , 2030
Figure 212: Oman Engineering Software Market Value Share Analysis, by Application, 2020
Figure 213: Oman Engineering Software Market Value Share Analysis, by Application, 2030
Figure 214: Oman Engineering Software Market Value Share Analysis, by Enterprise Size, 2020
Figure 215: Oman Engineering Software Market Value Share Analysis, by Enterprise Size, 2030
Figure 216: Qatar Engineering Software Market Value Share Analysis, by Component, 2020
Figure 217: Qatar Engineering Software Market Value Share Analysis, by Component, 2030
Figure 218: Qatar Engineering Software Market Value Share Analysis, by Deployment, 2020
Figure 219: Qatar Engineering Software Market Value Share Analysis, by Deployment , 2030
Figure 220: Qatar Engineering Software Market Value Share Analysis, by Application, 2020
Figure 221: Qatar Engineering Software Market Value Share Analysis, by Application, 2030
Figure 222: Qatar Engineering Software Market Value Share Analysis, by Enterprise Size, 2020
Figure 223: Qatar Engineering Software Market Value Share Analysis, by Enterprise Size, 2030
Figure 224: South America Engineering Software Market Value Share Analysis, by Component, 2020
Figure 225: South America Engineering Software Market Value Share Analysis, by Component, 2030
Figure 226: South America Engineering Software Market Value Share Analysis, by Deployment, 2020
Figure 227: South America Engineering Software Market Value Share Analysis, by Deployment, 2030
Figure 228: South America Engineering Software Market Value Share Analysis, by Application, 2020
Figure 229: South America Engineering Software Market Value Share Analysis, by Application, 2030
Figure 230: South America Engineering Software Market Value Share Analysis, by Enterprise Size, 2020
Figure 231: South America Engineering Software Market Value Share Analysis, by Enterprise Size 2030
Figure 232: South America Engineering Software Market Value Share Analysis, by Country, 2020
Figure 233: South America Engineering Software Market Value Share Analysis, by Country, 2030
Figure 234: Brazil Engineering Software Market Value Share Analysis, by Component, 2020
Figure 235: Brazil Engineering Software Market Value Share Analysis, by Component, 2030
Figure 236: Brazil Engineering Software Market Value Share Analysis, by Deployment, 2020
Figure 237: Brazil Engineering Software Market Value Share Analysis, by Deployment, 2030
Figure 238: Brazil Engineering Software Market Value Share Analysis, by Application, 2020
Figure 239: Brazil Engineering Software Market Value Share Analysis, by Application, 2030
Figure 240: Brazil Engineering Software Market Value Share Analysis, by Enterprise Size, 2020
Figure 241: Brazil Engineering Software Market Value Share Analysis, by Enterprise Size 2030
Figure 242: Argentina Engineering Software Market Value Share Analysis, by Component, 2020
Figure 243: Argentina Engineering Software Market Value Share Analysis, by Component, 2030
Figure 244: Argentina Engineering Software Market Value Share Analysis, by Deployment, 2020
Figure 245: Argentina Engineering Software Market Value Share Analysis, by Deployment, 2030
Figure 246: Argentina Engineering Software Market Value Share Analysis, by Application, 2020
Figure 247: Argentina Engineering Software Market Value Share Analysis, by Application, 2030
Figure 248: Argentina Engineering Software Market Value Share Analysis, by Enterprise Size, 2020
Figure 249: Argentina Engineering Software Market Value Share Analysis, by Enterprise Size 2030
Figure 250: Rest of South America Engineering Software Market Value Share Analysis, by Component, 2020
Figure 251: Rest of South America Engineering Software Market Value Share Analysis, by Component, 2030
Figure 252: Rest of South America Engineering Software Market Value Share Analysis, by Deployment, 2020
Figure 253: Rest of South America Engineering Software Market Value Share Analysis, by Deployment, 2030
Figure 254: Rest of South America Engineering Software Market Value Share Analysis, by Application, 2020
Figure 255: Rest of South America Engineering Software Market Value Share Analysis, by Application, 2030
Figure 256: Rest of South America Engineering Software Market Value Share Analysis, by Enterprise Size, 2020
Figure 257: Rest of South America Engineering Software Market Value Share Analysis, by Enterprise Size 2030
Copyright © Transparency Market Research, Inc. All Rights reserved
Trust Online

Engineering Software Market