
Reports
Reports
Global Clear Brine Fluids Market: Snapshot
With increasing oil and gas drilling activities worldwide, companies operating in the global clear brine fluids market are being presented with lucrative opportunities to expand their business. As developed nations are striving to gain energy security, they are focusing on the development of shale reserves as a part of their strategy. The rise in oil and gas drilling activities for this purpose is likely to drive the sales of clear brine fluids as they are used in the completion process of oil and gas extraction. The increased drilling activities for the exploration of unconventional resources is an opportunity that manufacturers of clear brine fluid can capitalize on. However, the unstable economic and political situation in the Middle East is likely to impede oil and gas exploration activities resulting in a dip in the sales of clear brine fluids.
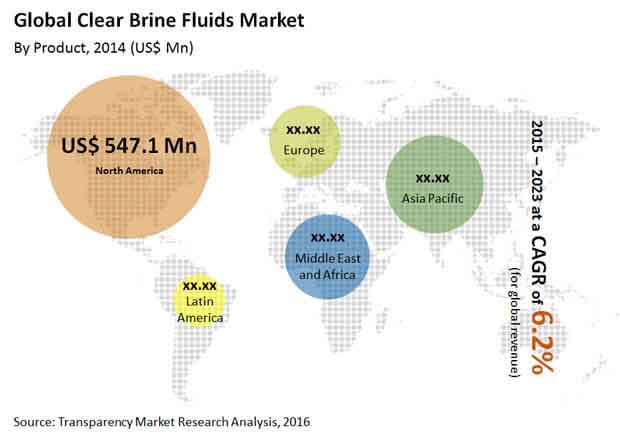
As a result of all these factors, the global clear brine fluids market is likely to expand at a 6.2 % CAGR from 2015 to 2023. The market was worth US$891.3 mn in 2015 and is projected to touch a valuation of US$1,444.7 mn by 2023.
Rise in Oil and Gas Drilling Activities to Enhance Sales of Clear Brine Fluids in North America
With leading oil and gas companies operating in the region, North America emerged as the largest region in the global clear brine fluids market. As developed nations are motivated to gain energy security, the oil and drilling activities in the region are increasing rapidly. To maintain their position in the market and not be dependent on OPEC for energy sources, the countries in North America have increased their drilling activities to discover more shale reserves. North America accounted for 65.7% in terms of volume of the global clear brine fluids market in 2014 and is expected to hold a share of 64.8% by 2023.
Asia Pacific emerged as the second largest region in the global clear brine fluids market owing to the presence of a large number of shale gas reservoirs in the region. China holds the largest share in the recoverable shale gas industry, which has made it the largest region in terms of consumption of clear brine fluids in Asia Pacific. The ongoing oil and gas drilling activities in Asia Pacific are subsequently boosting the sales of clear brine fluid in the region.
Potassium Chloride Brine Fluids Products Segment to Witness Fastest Growth
Potassium chloride brine fluids are used for stabilizing water sensitive clays during the extraction completion process. It helps in controlling the formation damage and pressure in reservoirs during the extraction process, thus making it the most used clear brine fluid among various end-use industries. The global potassium chloride brine fluids segment is projected to expand at a CAGR of 6.5% in terms of revenue between 2015 and 2023.
The calcium chloride brine fluids products segment is expected to witness the second fastest growth in the coming years. The single-salt composition of calcium chloride brine fluids makes it an effective component used in the formation of brine completion and workover fluids. Owing to the increasing demand for calcium chloride brine fluids in the oil and gas industry for preventing clay hydration during drilling, this product segment is likely to grow at a steady pace in the coming years.
The leading companies in the global clear brine fluids market are Israel Chemicals Ltd., Great Lake Solutions, Albemarle Corporation, and TETRA Technologies Inc.
Chapter 1 Preface
1.1 Report Description
1.2 Research Scope
1.3 Assumptions
1.4 Market Segmentation
1.5 Research Methodology
Chapter 2 Executive Summary
2.1 Global Clear Brine Fluids Market, 2014 - 2023, (Kilo Tons) (US$ Mn)
2.2 Clear Brine Fluids: Market Snapshot
Chapter 3 Clear Brine Fluids Market – Industry Analysis
3.1 Introduction
3.2 Value Chain Analysis
3.3 Market Drivers
3.3.1 Developed Nations Striving for Energy Security Driving the Clear Brine Fluids Market
3.4 Restraints
3.4.1 The Shale Gas Situation Coupled with the Political Imbalance in the Middle East
3.5 Opportunity
3.5.1 Focus on Exploring Unconventional Resources such as Shale Gas and Coal Bed Methane
3.6 Porter’s Five Forces Analysis
3.6.1 Bargaining Power of Suppliers
3.6.2 Bargaining Power of Buyers
3.6.3 Threat of New Entrants
3.6.4 Threat of Substitutes
3.6.5 Degree of Competition
3.7 Clear Brine Fluids: Market Attractiveness Analysis
3.7.1 Attractiveness Analysis: By Product type
3.7.2 Attractiveness Analysis: By Country
3.8 Clear Brine Fluids Market: Company Market Share Analysis, 2014
Chapter 4 Price Trend Analysis
4.1 Clear Brine Fluids Price Trend, 2014–2023 (US$/Ton)
Chapter 5 Clear Brine Fluids Market – Product Segment Analysis
5.1 Global Clear Brine Fluids Market for Potassium Chloride, 2014 – 2023 (Kilo Tons) (US$ Mn)
5.2 Global Clear Brine Fluids Market for Calcium Chloride, 2014 – 2023 (Kilo Tons) (US$ Mn)
5.3 Global Clear Brine Fluids Market for Sodium Chloride, 2014 – 2023 (Kilo Tons) (US$ Mn)
5.4 Global Clear Brine Fluids Market for Potassium Bromide, 2014 – 2023 (Kilo Tons) (US$ Mn)
5.5 Global Clear Brine Fluids Market for Sodium Bromide, 2014 – 2023 (Kilo Tons) (US$ Mn)
5.6 Global Clear Brine Fluids Market for Calcium Bromide, 2014 – 2023 (Kilo Tons) (US$ Mn)
5.7 Global Clear Brine Fluids Market for Others, 2014 – 2023 (Kilo Tons) (US$ Mn)
Chapter 6 Global Clear Brine Fluids Market: Regional Analysis
6.1 Global Clear Brine Fluids Market: Regional Overview
6.2 North America Clear Brine Fluids Market, 2014 and 2023
6.2.1 North America Clear Brine Fluids Market Volume, Product Segment Analysis, 2014 – 2023 (Kilo Tons)
6.2.2 North America Clear Brine Fluids Market Revenue, Product Segment Analysis, 2014 – 2023 (US$ Mn)
6.2.3 U.S. Clear Brine Fluids Market Volume, Product Segment Analysis, 2014 – 2023 (Kilo Tons)
6.2.4 U.S. Clear Brine Fluids Market Revenue, Product Segment Analysis, 2014 – 2023 (US$ Mn)
6.2.5 Rest of North America Clear Brine Fluids Market Volume, Product Segment Analysis, 2014 – 2023 (Kilo Tons)
6.2.6 Rest of North America Clear Brine Fluids Market Revenue, Product Segment Analysis, 2014 – 2023 (US$ Mn)
6.3 Europe Clear Brine Fluids Market, 2014 and 2023
6.3.1 Europe Clear Brine Fluids Market Revenue, Product Segment Analysis, 2014 – 2023 (Kilo Tons)
6.3.2 Europe Clear Brine Fluids Market Volume, Product Segment Analysis, 2014 – 2023 (US$ Mn)
6.3.3 Germany Clear Brine Fluids Market Volume, Product Segment Analysis, 2014 – 2023 (Kilo Tons)
6.3.4 Germany Clear Brine Fluids Market Revenue, Product Segment Analysis, 2014 – 2023 (US$ Mn)
6.3.5 UK Clear Brine Fluids Market Volume, Product Segment Analysis, 2014 – 2023 (Kilo Tons)
6.3.6 UK Clear Brine Fluids Market Revenue, Product Segment Analysis, 2014 – 2023 (US$ Mn)
6.3.7 Rest of Europe Clear Brine Fluids Market Volume, Product Segment Analysis, 2014 – 2023 (Kilo Tons)
6.3.8 Rest of Europe Clear Brine Fluids Market Revenue, Product Segment Analysis, 2014 – 2023 (US$ Mn)
6.4 Asia Pacific Clear Brine Fluids Market, 2014 and 2023
6.4.1 Asia Pacific Clear Brine Fluids Market Volume, Product Segment Analysis, 2014 – 2023 (Kilo Tons)
6.4.2 Asia Pacific Clear Brine Fluids Market Revenue, Product Segment Analysis, 2014 – 2023 (US$ Mn)
6.4.3 China Clear Brine Fluids Market Volume, Product Segment Analysis, 2014 – 2023 (Kilo Tons)
6.4.4 China Clear Brine Fluids Market Revenue, Product Segment Analysis, 2014 – 2023 (US$ Mn)
6.4.5 Japan Clear Brine Fluids Market Volume, Product Segment Analysis, 2014 – 2023 (Kilo Tons)
6.4.6 Japan Clear Brine Fluids Market Revenue, Product Segment Analysis, 2014 – 2023 (US$ Mn)
6.4.7 ASEAN Clear Brine Fluids Market Volume, Product Segment Analysis, 2014 – 2023 (Kilo Tons)
6.4.8 ASEAN Clear Brine Fluids Market Revenue, Product Segment Analysis, 2014 – 2023 (US$ Mn)
6.4.9 Rest of Asia Pacific Clear Brine Fluids Market Volume, Product Segment Analysis, 2014 – 2023 (Kilo Tons)
6.4.10 Rest of Asia Pacific Clear Brine Fluids Market Revenue, Product Segment Analysis, 2014 – 2023 (US$ Mn)
6.5 Latin America Clear Brine Fluids Market, 2014 and 2023
6.5.1 Latin America Clear Brine Fluids Market Volume, Product Segment Analysis, 2014 – 2023 (Kilo Tons)
6.5.2 Latin America Clear Brine Fluids Market Revenue, Product Segment Analysis, 2014 – 2023 (US$ Mn)
6.5.3 Brazil Clear Brine Fluids Market Volume, Product Segment Analysis, 2014 – 2023 (Kilo Tons)
6.5.4 Brazil Clear Brine Fluids Market Revenue, Product Segment Analysis, 2014 – 2023 (US$ Mn)
6.5.5 Rest of Latin America Clear Brine Fluids Market Volume, Product Segment Analysis, 2014 – 2023 (Kilo Tons)
6.5.6 Rest of Latin America Clear Brine Fluids Market Revenue, Product Segment Analysis, 2014 – 2023 (US$ Mn)
6.6 Middle East & Africa Clear Brine Fluids Market, 2014 and 2023
6.6.1 Middle East & Africa Clear Brine Fluids Market Volume, Product Segment Analysis, 2014 – 2023 (Kilo Tons)
6.6.2 Middle East & Africa Clear Brine Fluids Market Revenue, Product Segment Analysis, 2014 – 2023 (US$ Mn)
6.6.3 GCC Clear Brine Fluids Market Volume, Product Segment Analysis, 2014 – 2023 (Kilo Tons)
6.6.4 GCC Clear Brine Fluids Market Revenue, Product Segment Analysis, 2014 – 2023 (US$ Mn)
6.6.5 South Africa Clear Brine Fluids Market Volume, Product Segment Analysis, 2014 – 2023 (Kilo Tons)
6.6.6 South Africa Clear Brine Fluids Market Revenue, Product Segment Analysis, 2014 – 2023 (US$ Mn)
6.6.7 Rest of Middle East & Africa Clear Brine Fluids Market Volume, Product Segment Analysis, 2014 – 2023 (Kilo Tons)
6.6.8 Rest of Middle East & Africa Clear Brine Fluids Market Revenue, Product Segment Analysis, 2014 – 2023 (US$ Mn)
Chapter 7 Company Profiles
7.1 Albemarle Corporation
7.2 Egyptian Mud Engineering & Chemicals Company (EMEC)
7.3 Geo Drillings Fluids, Inc.
7.4 Great Lake Solutions
7.5 Israel Chemicals Ltd.
7.6 Zirax Ltd.
7.7 Solent Chemicals
7.8 TETRA Technologies, Inc
7.9 Cabot Corporation
7.10 Clements Fluids
7.11 Others
Chapter 8 Primary Research – Key Findings
Copyright © Transparency Market Research, Inc. All Rights reserved
Trust Online

Clear Brine Fluids Market