
Reports
Reports
Biochips are miniaturized laboratories that can perform thousands of biochemical reactions, such as polymerase chain reactions (PCR). The U.S. biochip product market held majority share of the total biochip market in 2011, at over 70%. However, the U.S. biochip services market will grow faster than the products market, due to increased opportunities of maintenance and technical support of microarray devices owing to growth in their numbers and obsolescence of older machines. The growth of this segment will also be spurred by the introduction of biochip consulting and subscription programs directed towards building long term relationships with customers.
Biochip services consist of contract research, consulting and technical support agreements. These also comprise of subscription programs that provide end-users with access to proprietary technologies, systems and processes. These services are directed towards building long term relationships with customers. The biochip services market segment is expected to witness higher growth rate than that of the products market due to a continuous increase in the number of microarray devices being used and aging of previously installed systems.
In the U.S. biochip products market, the microarray market is identified as the most attractive segment owing to the following factors:
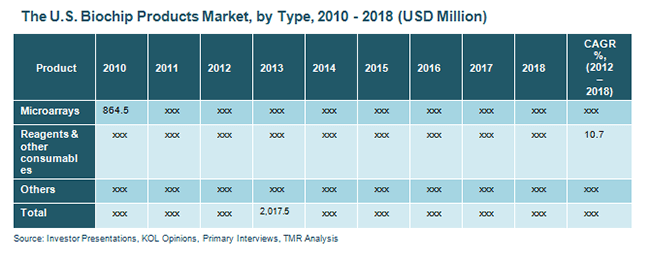
Table of Content
1. Preface
1.1. Report Description
1.2. Market Segmentation
1.3. Research Methodology
2. Executive Summary
3. Market Overview
3.1. Market Dynamics
3.1.1. Market Drivers
3.1.1.1. Rise in the Application of Genomics and Proteomics Technologies in Cancer Research
3.1.1.2. Growth in Drug Discovery, Personalized Medicine and Life Science Research
3.1.1.3. Impact Analysis of Market Drivers
3.1.2. Market Restraints
3.1.2.1. Low Commercial Acceptability of Biochips due to Their High Cost
3.1.2.2. Availability of Alternative Technologies such as Mass Spectrometry and Polymerase Chain Reaction (PCR)
3.1.2.3. Impact Analysis of Market Restraints
3.1.3. Opportunities
3.1.3.1. New Applications of Biochips
3.2. Porter’s Five Force Analysis for U.S. Biochip Market
3.2.1. Bargaining Power of Suppliers
3.2.2. Bargaining Power of Buyers
3.2.3. Threat of New Entrants
3.2.4. Threat of Substitutes
3.2.5. Competitive Rivalry
3.3. Market Attractiveness Analysis of U.S. Biochip Market, by Product Type
3.4. Market Size and Trends
3.4.1. U.S. Biochip Market, 2011-2018 (USD Million)
4. U.S. Biochip Market, by Segments
4.1. Overview
4.2. U.S. Biochip Services Market
4.2.1. U.S. Biochip Services Market, 2010-2018 (USD Million)
5. U.S. Biochip Products Market, by Type
5.1. Overview
5.2. U.S. Microarrays Market
5.2.1. U.S. Microarrays Market, 2010-2018 (USD Million)
5.3. U.S. Reagents and Other Consumables Market
5.3.1. U.S. Reagents and Other Consumables Market, 2010-2018 (USD Million)
5.4. U.S. Other Biochip Products (Biochip Instruments and Software) Market
5.4.1. U.S. Other Biochip Products Market, 2010-2018 (USD Million)
6. The U.S. Biochip Products and Services Market, by Application
6.1. Overview
6.2. U.S. Biochip Products and Services for Drug Delivery Market
6.2.1. U.S. Biochip Products and Services for Drug Delivery Market
6.3. U.S. Biochip Products and Services for Life Science Research Market
6.3.1. U.S. Biochip Products and Services for Life Science Research Market
6.4. U.S. Biochip Products and Services for In Vitro Diagnostic (IVD) Testing Market
6.4.1. U.S Biochip Products and Services for In Vitro Diagnostic Testing Market, 2010-2018 (USD Million)
6.5. U.S. Biochip Products and Services for Other Applications (Disease Management, Forensic Medicine, Defense Application) Market
6.5.1. The U.S. Biochip Products and Services for Other Applications Market, 2010-2018 (USD Million)
7. Competitive Landscape
7.1. Biochip Industry Composition in U.S.
8. Company Profiles
8.1. Abbott Laboratories
8.1.1. Company Overview
8.1.2. Financial Overview
8.1.3. Business Strategy
8.1.4. Product Portfolio
8.1.5. Recent Developments
8.2. Affymetrix Inc.
8.2.1. Company Overview
8.2.2. Financial Overview
8.2.3. Business Strategy
8.2.4. Product Portfolio
8.2.5. Recent Developments
8.3. Agilent Technologies
8.3.1. Company Overview
8.3.2. Financial Overview
8.3.3. Business Strategy
8.3.4. Product Portfolio
8.3.5. Recent Developments
8.4. Beckman Coulter, Inc.
8.4.1. Company Overview
8.4.2. Financial Overview
8.4.3. Business Strategies
8.4.4. Product Portfolio
8.4.5. Recent Developments
8.5. Illumina Incorporated
8.5.1. Company Overview
8.5.2. Financial Overview
8.5.3. Business Strategies
8.5.4. Product Portfolio
8.5.5. Recent Developments
8.6. Life Technologies Corporation
8.6.1. Company Overview
8.6.2. Financial Overview
8.6.3. Business Strategies
8.6.4. Product Portfolio
8.6.5. Recent Developments
8.7. GE Healthcare
8.7.1. Company Overview
8.7.2. Financial Overview
8.7.3. Business Strategy
8.7.4. Product Portfolio
8.7.5. Recent Developments
8.8. Roche
8.8.1. Company Overview
8.8.2. Financial Overview
8.8.3. Business Strategy
8.8.4. Product Portfolio
8.8.5. Recent Developments
List of Tables
TABLE 1: Market Snapshot: U.S. Biochip Market
TABLE 2: Impact Analysis Of Market Drivers
TABLE 3: Impact Analysis Of Market Restraints
List of Figures
FIG. 1: Market Segmentation: U.S. Biochip Market
FIG. 2: U.S. Biochip Market, by Product Type, 2011 (USD Million)
FIG. 3: Porter’s Five Force Analysis for U.S. Biochip Market
FIG. 4: Market Attractiveness Analysis of the U.S. Biochip Market, by Product Type
FIG. 5: U.S. Biochip Market, 2010-2018 (USD Million)
FIG. 6: Comparative Analysis: U.S. Biochip Market, by Segments, 2011 & 2018 (Value %)
FIG. 7: U.S. Biochip Services Market, 2010-2018 (USD Million)
FIG. 8: Comparative Analysis: U.S. Biochip Products Market, by Type, 2011 & 2018 (Value %)
FIG. 9: U.S. Microarrays Market, 2010-2018 (USD Million)
FIG. 10: U.S. Reagents and Other Consumables Market, 2010-2018 (USD Million)
FIG. 11: U.S. Other Biochip Products Market, 2010-2018 (USD Million)
FIG. 12: Comparative Analysis: U.S. Biochip Products and Services Market, by Application, 2011 & 2018 (Value %)
FIG. 13: U.S. Biochip Products and Services for Drug Delivery Market, 2010-2018 (USD Million)
FIG. 14: U.S. Biochip Products and Services for Life Science Research Market, 2010-2018 (USD Million)
FIG. 15: U.S. Biochip Products and Services for In Vitro Diagnostic Testing Market, 2010-2018 (USD Million)
FIG. 16: U.S. Biochip Products and Services for Other Applications Market, 2010-2018 (USD Million)
FIG. 17: Annual Revenues: Abbott Laboratories, 2010-2011 (USD Million)
FIG. 18: Annual Revenues: Affymetrix Incorporated, 2010-2011 (USD Million)
FIG. 19: Annual Revenues: Agilent Technologies, 2010-2011 (USD Million)
FIG. 20: Annual Revenues: Illumina Incorporated, 2010-2011 (USD Million)
FIG. 21: Annual Revenues: Life Technologies Corporation, 2010-2011 (USD Million)
FIG. 22: Annual Revenues: GE Healthcare, 2010-2011 (USD Million)
FIG. 23: Annual Revenues: Roche, 2010-2011 (USD Million)
Copyright © Transparency Market Research, Inc. All Rights reserved
Trust Online

Biochip Products and Services Market