
Reports
Reports
The automotive industry has consistently provided a wide array of opportunities for the automated optical metrology players. The current boom in auto sales, especially in emerging regions, is therefore a key factor driving the demand for automated optical metrology. The same applies to the aerospace sector, where increasing air traffic and the need for advanced automation processes is creating an accelerated demand for automated optical metrology.
Industries have to adhere to the various quality standards set by each region. The growing rate of standardization for quality control on an international level is therefore allowing players from the automated optical metrology market provide invaluable services for the same.
The standards for automated optical metrology services themselves, however, are lacking a sturdy universal measurement foundation. This could continue to hamper the growth of automated optical metrology players until a standard is maintained.
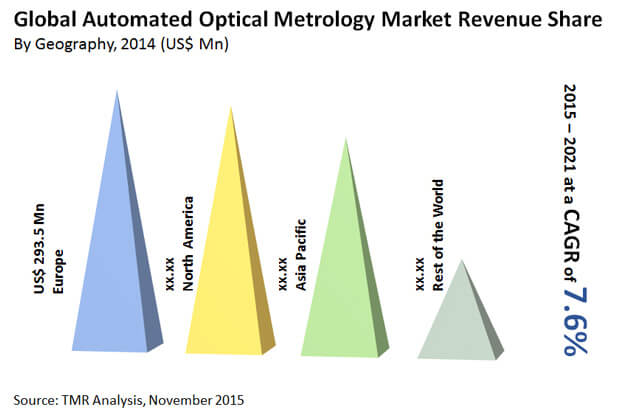
It is owing to these factors that the global automated optical metrology market is expected to expand at a CAGR of 7.6% from 2015 to 2021. This market is expected to accrue a revenue of US$1.565 bn by the end of 2021.
Emerging economies such as those from the Asia Pacific region are showing a high demand for reducing the level of human handling. This is calling on the automated optical metrology players for implementing advanced automated systems that can function with the least amount of human intervention, thus providing massive opportunities for the manufacturers of these systems.
China, Japan, and India are the three key countries in the Asia Pacific to demand automated optical metrology equipment. Their high demand is caused due to the rapid rate of industrial evolution and the growth of industrial infrastructure.
Meanwhile, Europe continues to lead the demand for automated optical metrology systems due to a high need for swathing over to international measurement compliances. The region is showing an especially high demand for automated optical metrology for the accurate measurement of non-contact surfaces, along with a growing auto industry.
Automotive, consumer electronics, medical, industrial, and aerospace and defense are the major application sectors for automated optical metrology. It can be assumed that any changes in the market behavior of these sectors will directly reflect on the overall demand for automated optical metrology. This applies more to the automotive and aerospace industries, where the growth of users and travelers is creating a high demand for advanced transport methods.
Both sectors – especially the automotive sector – are witnessing a growth in users. The current high demand for vehicles with improved features is spurring the use of automated optical metrology in modern cars. By the end of 2021, the automotive sector is expected to take up 26.9% of the overall revenue generated in the automated optical metrology market.
The top players in the automated optical metrology market currently include KLA Tencor Corporation, ASML Holding NV, Hexagon Metrology, Inc., Nikon Metrology NV, and Steinbichler Optotechnik GmbH.
Chapter 1 Preface
1.1 Report description
1.2 Research scope
1.3 Key Take away
1.3 Research methodology
Chapter 2 Executive Summary
Chapter 3 Automated Optical Metrology Market Overview
3.1 Introduction
3.2 Nature of the market
3.3 Market dynamics
3.3.1 Market Drivers
3.3.1.1 Increasing need for compliance to international industry quality control and measurement standards
3.3.1.2 Growth of automotive and aerospace sector
3.3.2 Market Restraints
3.3.2.1 Lack of universal measurement system
3.3.3 Market Opportunities
3.4 Market share of automated optical metrology key players, 2014 (Value %)
3.4.1 Competitive strategies adopted by key players
3.5 Global automated optical metrology market: market attractiveness analysis
Chapter 4 Global Automated Optical Metrology Market: By Product
4.1 Overview
4.1.1 Global Automated Optical Metrology Market Revenue Share (%), By Product, 2014 and 2021
4.2 Global Video Measuring Machines Market Revenue Forecast, 2014 – 2021 (USD million)
4.3 Global Laser Scanners Market Revenue Forecast, 2014 – 2021 (USD million)
4.4 Global Coordinate Measuring Machines Market Revenue Forecast, 2014 - 2021 (USD million
Chapter 5 Global Automated Optical Metrology Market: By Application
5.1 Overview
5.1.1 Global Automated Optical Metrology Market Revenue Share (%), by Application, 2014 and 2021
5.2 Global Automotive Market Revenue Forecast, 2014 – 2021 (USD million)
5.3 Global Consumer Electronics Market Revenue Forecast, 2014 – 2021 (USD million)
5.4 Global Industrial Market Revenue Forecast, 2014 – 2021 (USD million)
5.5 Global Medical Market Revenue Forecast, 2014 – 2021 (USD million)
5.6 Global Aerospace & Defense Market Revenue Forecast, 2014 – 2021 (USD million)
Chapter 6 Global Automated Optical Metrology Market by Geography
6.1 Overview
6.1.1 Global Automated Optical Metrology Market Revenue Share (%), by Geography, 2014 and 2021
6.2 North America Automated Optical Metrology Market Revenue Forecast, 2014 – 2021 (USD million)
6.2.1 North America Automated Optical Metrology Market Revenue Forecast, By Product, 2014 – 2021 (USD million)
6.2.2 North America Automated Optical Metrology Market Revenue Forecast, By Application, 2014 – 2021 (USD million)
6.2.3 North America Automated Optical Metrology Market Revenue Forecast, By Country, 2014 – 2021 (USD million)
6.3 Europe Automated Optical Metrology Market Revenue Forecast, 2014 – 2021 (USD million)
6.3.1 Europe Automated Optical Metrology Market Revenue Forecast, By Product, 2014 – 2021 (USD million)
6.3.2 Europe Automated Optical Metrology Market Revenue and Forecast, By Application, 2014 – 2021 (USD million)
6.3.3 Europe Automated Optical Metrology Market Revenue Forecast, By Country, 2014 – 2021 (USD million)
6.4 Asia Pacific Automated Optical Metrology Market Revenue and Forecast, 2014 – 2021 (USD million)
6.4.1 Asia Pacific Automated Optical Metrology Market Revenue Forecast, By Product, 2014 – 2021 (USD million)
6.4.2 Asia Pacific Automated Optical Metrology Market Revenue Forecast, By Application, 2014 – 2021 (USD million)
6.4.3 Asia Pacific Automated Optical Metrology Market Revenue Forecast, By Country, 2014 – 2021 (USD million)
6.5 Rest of the World (RoW) Automated Optical Metrology Market Revenue Forecast, 2014 – 2021 (USD million)
6.5.1 Rest of the World (RoW) Automated Optical Metrology Market Revenue Forecast, By Product, 2014 – 2021 (USD million)
6.5.2 Rest of the World (RoW) Automated Optical Metrology Market Revenue Forecast, By Application, 2014 – 2021 (USD million)
6.5.2 Rest of the World (RoW) Automated Optical Metrology Market Revenue Forecast, By Country, 2014 – 2021 (USD million)
Chapter 7 Company Profiles
7.1 KLA Tencor Corporation
7.2 ASML Holding NV
7.3 Hexagon Metrology, Inc.
7.4 Nikon Metrology NV
7.5 Steinbichler Optotechnik GmbH
List of Tables
TABLE 1 Snapshot: Global Automated Optical Metrology Market
TABLE 2 Drivers for Global Automated Optical Metrology Market: Impact Analysis
TABLE 3 Restraints for Global Automated Optical Metrology Market
TABLE 4 North America Automated Optical Metrology Market Revenue Forecast, By Product, 2014 – 2021 (USD million)
TABLE 5 North America Automated Optical Metrology Market Revenue Forecast, By Application, 2014 – 2021 (USD million)
TABLE 6 North America Automated Optical Metrology Market Revenue Forecast, By Country, 2014 – 2021 (USD million)
TABLE 7 Europe Automated Optical Metrology Market Revenue Forecast, By Product, 2014 – 2021 (USD million)
TABLE 8 Europe Automated Optical Metrology Market Revenue Forecast, By Application, 2014 – 2021 (USD million)
TABLE 9 Europe Automated Optical Metrology Market Revenue Forecast, By Country, 2014 – 2021 (USD million)
TABLE 10 Asia Pacific Automated Optical Metrology Market Revenue Forecast, By Product, 2014 – 2021 (USD million)
TABLE 11 Asia Pacific Automated Optical Metrology Market Revenue Forecast, By Application, 2014 – 2021 (USD million)
TABLE 12 Asia Pacific Automated Optical Metrology Market Revenue Forecast, By Country, 2014 – 2021 (USD million)
TABLE 11 RoW Automated Optical Metrology Market Revenue Forecast, By Product, 2014 – 2021 (USD million)
TABLE 11 RoW Automated Optical Metrology Market Revenue Forecast, By Application, 2014 – 2021 (USD million)
TABLE 11 RoW Automated Optical Metrology Market Revenue Forecast, By Country, 2014 – 2021 (USD million)
List of Figures
FIG. 1 Market Segmentation Automated Optical Metrology Market
FIG. 2 Market share of Automated Optical Metrology key players, 2014 (Value %)
FIG. 3 Global Automated Optical Metrology Market: Market Attractiveness Analysis, By Product
FIG. 4 Global Automated Optical Metrology Market Revenue Forecast, By Product, 2014 – 2021 (USD million)
FIG. 5 Global Video Measuring Machines Market Revenue Forecast, 2014 – 2021 (USD million)
FIG. 6 Global Laser Scanners Market Revenue Forecast, 2014 – 2021 (USD million)
FIG. 7 Global Coordinate Measuring Machines Market Revenue Forecast, 2014 – 2021 (USD million)
FIG. 8 Global Automated Optical Metrology Market Revenue Forecast, By Application, 2014 – 2021 (USD million)
FIG. 9 Global Automotive Market Revenue Forecast, 2014 – 2021 (USD million)
FIG. 10 Global Consumer Electronics Market Revenue Forecast, 2014 – 2021 (USD million)
FIG. 11 Global Industrial Market Revenue Forecast, 2014 – 2021 (USD million)
FIG. 12 Global Medical Market Revenue Forecast, 2014 – 2021 (USD million)
FIG. 13 Global Aerospace and Defense Market Revenue Forecast, 2014 – 2021 (USD million)
FIG. 14 Global Automated Optical Metrology Market Revenue Forecast, By Geography, 2014 – 2021 (USD million)
FIG. 15 North America Automated Optical Metrology Market Revenue Forecast, 2014 – 2021 (USD million)
FIG. 16 Europe Automated Optical Metrology Market Revenue Forecast, 2014 – 2021 (USD million)
FIG. 17 Asia Pacific Automated Optical Metrology Market Revenue Forecast, 2014 – 2021 (USD million)
FIG. 18 RoW Automated Optical Metrology Market Revenue Forecast, 2014 – 2021 (USD million)
Copyright © Transparency Market Research, Inc. All Rights reserved
Trust Online

Automated Optical Metrology Market